Abstract
Purpose
This paper examines the influence of age on several attributes of sensorimotor performance while performing a reaching task. Our hypothesis, based on previous studies, is that aged persons will show differences in one or more of the attributes of sensorimotor performance.
Patients and methods
Fifty-one subjects (aged 20–80 years) with no known neuromotor disorders of the upper limbs participated in the study. Subjects were asked to grasp the end-effector of a pneumatic robotic device with two degrees of freedom in order to reach peripheral targets (1.0 cm radius), “quickly and accurately”, from a centrally located target (1.0 cm radius). Subjects began each trial by holding the hand within the central target for 2000 milliseconds. Afterwards, a peripheral target was illuminated. Then participants were given 3000 milliseconds to complete the movement. When a target was reached, the participant had to return to the central target in order to start a new trial. A total of 64 trials were completed and each peripheral target was illuminated in a random block design.
Results
Subjects were divided into three groups according to age: group 1 (age 20–40 years), group 2 (age 41–60 years), and group 3 (age 61–80 years). The Kruskal–Wallis test showed significant differences (P < 0.05) between groups, except for the variables postural speed in the dominant arm, and postural speed and initial deviation in the non-dominant arm (P > 0.05). These results suggest that age introduces significant differences in upper-limb motor function.
Conclusion
Our findings show that there are objective differences in sensorimotor function due to age, and that these differences are greater for the dominant arm. Therefore for the assessment of upper-limb function, we should take into account the influence of age. Moreover, these results suggest that robotic systems can provide a new and effective approach in the assessment of sensorimotor function.
Introduction
Impairment and disability following an acquired brain injury (ABI) are often assessed by many scales that are long, difficult to administer, and centered only on some aspects of the impairment. Therefore, it is often necessary to use more than one scale in order to achieve a global and complete assessment. The most common scales are the Chedoke-McMaster Stroke Assessment Scale (CMSA),Citation1 Fugl-Meyer Assessment (FMA),Citation2 and Functional Independence Measure (FIM).Citation3 Furthermore, although these scales are standardized and validated, they depend on the therapist’s perceptual decision when monitoring the behavioral performance of the person and are thus inherently subjective.Citation4 Another limitation of these protocols is their scoring system that is relatively coarse, since the observer typically scores the patient’s performance on an ordinal or ordered categorical scale with few options to choose from. This makes it difficult to quantify improvement and detect subtle but clinically important functional changes.Citation4–Citation6
Despite the weaknesses of traditional approaches for the clinical assessment of ABI, assessment is essential to monitor the progress of the patient, as well as to determine the effectiveness of rehabilitation treatment.
At the same time, the many rehabilitation approaches vary widely across therapists with little empirical evidence to support one approach over another.Citation7,Citation8 The result is a vicious circle between clinical assessment and rehabilitation due to the lack of sensitive tools to quantify dysfunction making it difficult to identify the effectiveness of the current rehabilitation approaches and to determine if one rehabilitation approach is better than another.Citation6 Thus, it is essential to search for new alternatives that would more rapidly objectively quantify impairments and disabilities following an ABI.
Recent developments in robotic technology have shown that robotic devices are capable of playing a role in rehabilitation because of their objectivity and reliability. They can gather kinematic and kinetic data in order to identify useful markers that quantify the motor recovery process.Citation4–Citation6,Citation9,Citation10
Over the past few decades, robotic visually guided and reaching movements have been used to study sensorimotor function.Citation5,Citation11,Citation12–Citation16 A number of these studies assumed that there is a deficit in the sensorimotor function in individuals who have had a stroke in comparison with controls. However, the influence of age in this function has not yet been considered.
The purpose of this study was to use a robotic system and a reaching task to identify useful and noticeable kinematic and kinetic measures in order to determine the influence of age on specific aspects of sensorimotor function. We hypothesized that many aged persons would show differences in one or more of the attributes of sensorimotor performance, according to previous studies.Citation17–Citation19
Material and methods
Robotic device
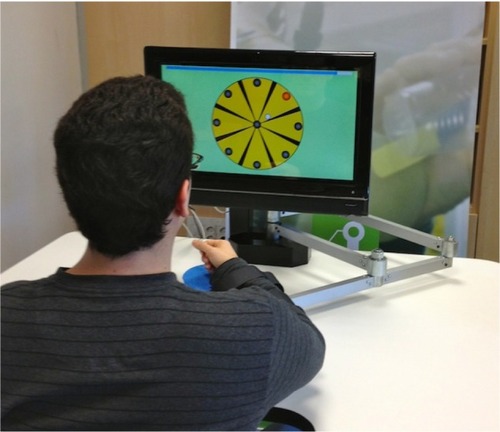
The task was monitored by a pneumatic robotic device with two degrees of freedom called RoboTherapist 2D that was designed by the Biomedical Neuroengineering Group at Miguel Hernández University and is now commercialized by Instead Technologies Inc (Elche, Spain). This device () has been designed as a rehabilitation robot for patients who suffer from stroke or other neurological disorders. The system permits only horizontal motion involving flexion and extension of the shoulder and elbow, and horizontal abduction and adduction. In this study, we did not use gravitational support since the machine was programmed not to assist the participants in completing the task. Therefore the RoboTherapist 2D only recorded the movements using parameters such as position, tangential velocity, and concerned forces. This information can be further used to assess the patients’ progress in rehabilitation.
Figure 1 RoboTherapist 2D robotic device used in this study to monitor the reaching task.
Experiment setup and protocol
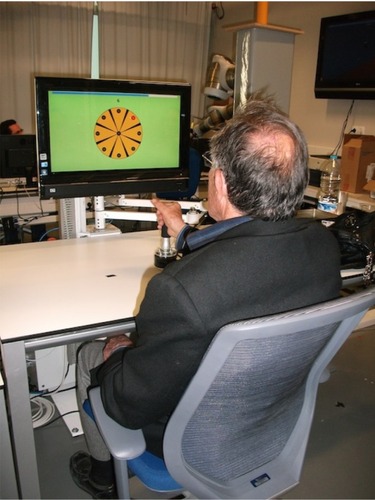
Prior to commencing the trials, the participants were seated in a chair in front of the RoboTherapist 2D in a comfortable musculoskeletal position. The end effector was grasped flexing the elbow 90 degrees and the shoulder internally rotated about 30 degrees related to the anatomical position. Therefore, the forearm was in the sagittal plane and the hand in front of the trunk ().
Figure 2 A participant grasping the robot end effector in the setup position.
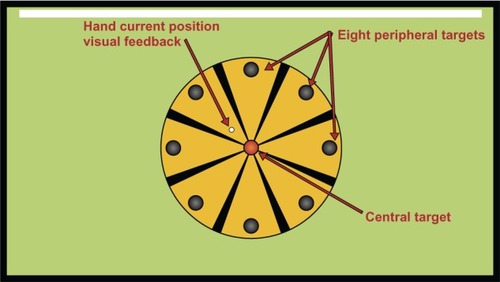
The protocol design was based on the design by Coderre et al.Citation5 Participants were asked to grasp the end effector of the robotic device in order to reach peripheral targets (1.0 cm radius), “quickly and accurately” from a centrally located target (1.0 cm radius). There were eight peripheral targets distributed uniformly on the circumference of a circle and placed 10 cm from the center target. The participant was provided with hand position visual feedback by a small white circle (0.4 cm radius; ). Targets and feedback were presented by software called REVIRE (developed by the Biomedical Neuroengineering Group at Miguel Hernández University) in a screen located 70 cm in front of the participant (). Participants began each trial by holding the hand within the central target for 2000 milliseconds. Afterwards, a peripheral target was illuminated. Next, participants were given 3000 milliseconds to complete the movement. When a target was reached, the participant had to return toward the central target in order to start a new trial. A total of 64 trials were completed and each peripheral target was illuminated in a random block design.
Figure 3 Targets and feedback presented to the participant using the REVIRE software.
Participants
Fifty-one subjects (age 20–80 years) with no known neuromotor disorders of the upper limbs participated in the study. Subjects were divided into three groups according to their age: group 1 (age 20–40 years), group 2 (age 41–60 years), and group 3 (age 61–80 years). Each group had 17 subjects. Group descriptions and participant demographics are reported in .
Table 1 Participants: summary demographic data
The protocol was approved by the ethics committee of the University Miguel Hernandez and all subjects gave written informed consent.
Movement parameters
To characterize performance, ten movement parameters were calculated from each trial, based on parameters from Coderre et al.Citation5 The setup movement was identified by a single velocity threshold: 5% of the maximum velocity achieved in each trial. The final movement was identified as the moment when the target was reached whereas the initial phase of movement was defined as the time period from movement onset to the first maximum speed. In addition, the following parameters were calculated from the position data recorded by the RoboTherapist 2D robotic device (see ):
Figure 4 Movement parameters calculated from position data recorded by the RoboTherapist 2D robotic device as described in Coderre et al.Citation5
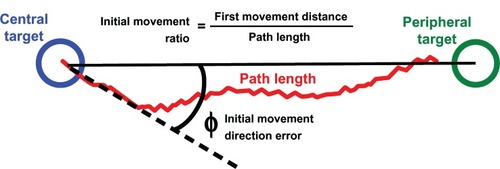
Initial movement direction error (in degrees), defined as the angular deviation between a straight line from the central target to the peripheral target and the vector from the central target to the hand position after the initial phase of movement.
Initial movement ratio, measured as the ratio of the distance travelled by the hand during the participant initial movement to the distance the hand travelled between movement onset and offset.
Path length (in mm), defined as the total distance travelled by the hand between movement onset and offset.
Number of no ended tasks, defined as the number of trials for which no movement end was detected, for example when the participant did not reach the target within 3000 milliseconds.
Likewise, from the tangential velocity data recorded by RoboTherapist 2D we calculated the following parameters (see ):
Figure 5 Movement parameters calculated from tangential velocity data recorded by the RoboTherapist 2D robotic device as described in Coderre et al.Citation5
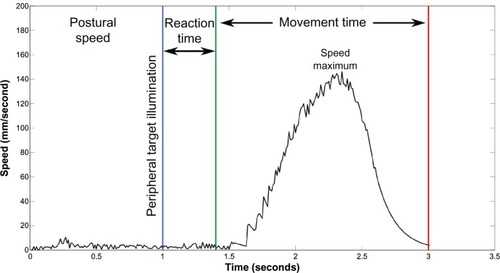
Postural speed (mm/second), calculated as the mean speed during the 500 milliseconds preceding peripheral target illumination.
Reaction time (seconds), determined by the time between the illumination of the peripheral target and the onset of movement.
Number of no initiated tasks, corresponding to the number of trials for which no movement onset was detected, for example when the participant did not leave the central target within 2000 milliseconds after the illumination of the peripheral target.
Movement time (seconds), defined as the total time elapsed from movement onset and offset.
Maximum speed (mm/second), defined by the maximum speed reached by the hand movement.
Besides these parameters and independently of position and velocity data, we also calculated:
Force (N), calculated as the mean force that is exerted in order to move the end effector in the desired direction and with the selected speed.
Statistical analysis
Statistical analyses were performed using the Statistical Package for Social Sciences (SPSS version 19.0; IBM Corporation, Armonk, NY, USA). A participant’s performance for each movement parameter was characterized by the average of the 64 recordings. Comparisons of continuous variables between subjects were performed using the Kruskal–Wallis H test. This test was used because several of the measured parameters were not normally distributed and therefore did not meet the requirements for a parametric test. The Mann–Whitney U test with Bonferroni correction for three groups was used to evaluate and identify the source of the difference. The performances for non-dominant and dominant arms were analyzed independently. Furthermore, we used the Wilcoxon test to study whether there were significant differences in the performance of the dominant versus non-dominant arms. Statistical significance was set at a P-value of less than 0.05.
Results
shows the main descriptive statistics including the median, the degree and direction of asymmetry (skewness) and the kurtosis for the three age groups. The number of no ended tasks and the number of no initiated tasks are not shown in this table because they do not appear in all subjects and all trials.
Table 2 Descriptive statistics, median, skewness, and kurtosis for the three age groups
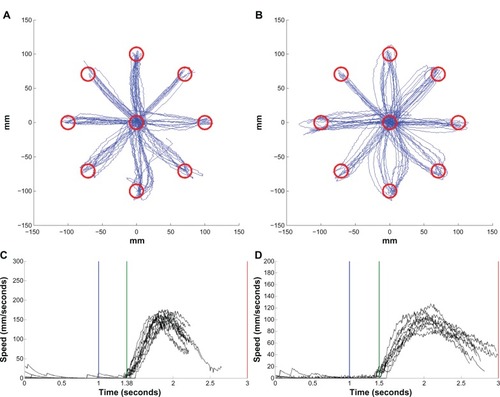
The interaction with the robot was well accepted by all participants and nobody quit the study. As expected based on previous studies,Citation5,Citation14 the collective hand paths of the total participants were relatively straight, with small corrective movements and modest amounts of trial-to-trial variability (see and ). The hand trajectories for movements made to each of the eight targets and the speed profiles for one movement direction are shown in for an older subject (group 3) and in for a younger subject (group 1). The differences between both subjects can be seen in the speed profiles: the reaction time for the younger subject (1.38 seconds) is less than for the older subject (1.46 seconds) and the maximum speed for the younger subject is greater than for the older subject.
Figure 6 Hand trajectories for a 67-year old, right handed, male (#38).
Notes: Hand trajectories are plotted for movements made to each of the eight targets and speed profiles are plotted for one movement direction. The dominant arm is on the left (A and C) and the non-dominant arm is on the right (B and D). Each line in the hand trajectory (A and B) and speed profile (C and D) plots represents a single trial. The blue vertical line in the speed profiles represents the time when the peripheral target was illuminated.

Figure 7 Hand trajectories for a 23-year-old, right handed, male (#5).
A Kruskal–Wallis test was conducted to evaluate differences among the three age groups. The results ( and ) show significant differences (P < 0.05) among the three age groups for all the measured parameters except for postural speed in the dominant arm, and the postural speed, and initial deviation in the non-dominant arm (P > 0.05).
Table 3 Kruskal–Wallis test, dominant arm
Table 4 Kruskal–Wallis test, non-dominant arm
Follow-up tests were used to evaluate pairwise differences among the three groups, controlling for type I error across the tests using the Bonferroni approach. The results of these tests indicated a significant difference especially for the following parameters: initial movement direction error, initial movement ratio, maximum speed and path length, movement time, and force (see ).
Table 5 Pairwise comparisons of the different parameters of the dominant arm using the Mann–Whitney U test
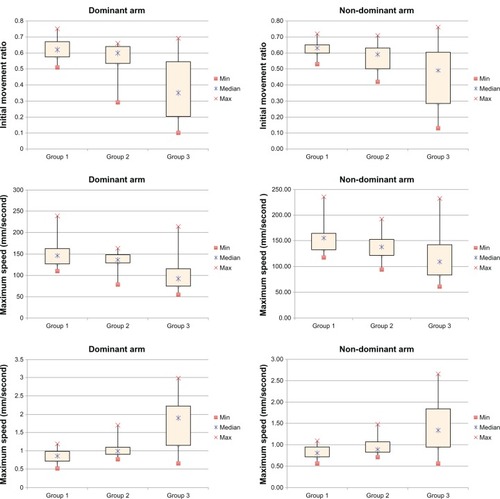
In general, the statistically significant differences were more marked between group 1 (10–40 years) and group 3 (61–80 years) than between groups 1 and 2 or between groups 2 and 3. The movement parameters that best identified these differences were initial movement ratio, maximum speed, and movement time. These parameters are plotted for the three groups as box plots in . On a box plot, the central mark represents the median value, the bottom and top of the box represent the 25th and 75th percentiles, and the whiskers represent the minimum and maximum of all the data. There were slight differences between groups 1 and 2 but when we compared group 1 to group 3 we found a clear fall in initial movement ratio and maximum speed and a significant increase in the movement time values. These changes were more noticeable in the performance of the dominant arms (see ).
Figure 8 Significant movement parameters plotted for the three groups.
To analyze whether there were significant differences in the performance of the dominant versus non-dominant arms we used the Wilcoxon test. Our results show that there were statistically significant differences only in the initial movement direction error (Z = −2.667, P = 0.008), maximum speed (Z = −3.065, P = 0.002), path length (Z = −4.406, P = 0.000), and movement time (Z = −3.886, P = 0.000).
Discussion
Previous studies have identified correlations between the sensorimotor function and demographic characteristics such as the age, gender, or ethnic group. Several parameters are important for the assessment of sensorimotor function,Citation20 since they influence the effectiveness and speed of the response;Citation20,Citation21 however, most of the studies in this field are strongly biased by subjective assessments. Thus, many of the current tools use coarse, ordinal scales resulting in floor and ceiling effects.Citation5 In this context, the main goal of this study was to evaluate a selected motor ability (reaching movement) in people of different ages in order to assess the correlation between upper-limb motor function and aging in an objective manner.
We used a commercially available pneumatic robotic device (RoboTherapist 2D; Instead Technologies Inc) to examine the influence of age on attributes of sensorimotor performance while performing a reaching task. Our results show a significant decrease in the sensorimotor abilities that can be easy quantified using objective kinematic and kinetic parameters. These changes are more noticeable in the aged participants (61–80 years) and could be related to the loss of efficiency of physiological processes in old age (ie, nerve conduction velocity declines with increasing age, action-potential amplitude is reduced, etc).Citation22
Although this is a preliminary study, our findings support the point of view that robotic devices can contribute significantly to our understanding of motor functions since they provide a reliable and very sensitive tool to quantify motor functions. However we have to also take into account the robotic devices intrinsic weaknesses and/or limitations. Thus, an obvious limitation of the RoboTherapist 2D robotic system is that it only allows planar movements that involve the shoulder and elbow. These movements are not functional in a strict sense and one may ask to what extent the assessment is useful for functional movements such as drinking from a glass of water. Despite this limitation, this position is highly recommended for performing assessments in the upper limb since the device supports the limb against gravity. Thus, older persons, or for example patients with weakness following stroke, are able to engage in assessments that would not be possible otherwise. This is highly advantageous in the clinical environment where early assessment may hold the key to important prognostic information. Nevertheless, further refinements of the motor tasks and derived measures as well as more data are necessary to create better measurements of upper-limb motor function that can be useful to quantify the development of aging or the course of rehabilitation.
Conclusion
The present study used a reaching movement in order to identify differences in the sensorimotor function due to age. The nature of the task, without support of the limb against gravity, permitted us to explore deficits in motor coordination and also the influence of loss of muscle strength on motor performance. Our results showed significant differences between group 1 (20–40 years) and group 3 (61–80 years) in most of the measured parameters. Furthermore, this difference was not the same for both arms (dominant and non-dominant); but, in most cases, it was greater for the dominant arm.
The findings from this study indicate that assessments of upper-limb sensorimotor function should take into account the influence of age. Moreover robotic systems can provide a new and effective approach for the assessment and rehabilitation of neurological patients. Therefore, the conventional physiotherapy and the robotic technology must not be alternatives but complementary approaches in the rehabilitation process.
Acknowledgments
This work was partly supported by the European Commission (FP7-ECHORD MAAT experiment) and by the Spanish Government through the project “Interpretation of the human intention and performance through biomedical signals and analysis of kinematic and dynamic motion” (DPI2011-29660-C04-04). AL carried out the study, the statistical analyses and drafted the manuscript; FJ contributed to data acquisition, analysis and drafting the manuscript; RM contributed to modifying the control system and software application of the robotic device to fit with the requirements of the study and drafting the manuscript; NG contributed to data analysis and interpretation and drafting of the manuscript; JM contributed to data acquisition, data analysis, data interpretation and drafting the manuscript; EF conceived the study and participated in its design and coordination and helped draft the manuscript. All authors read and approved the final manuscript.
Disclosure
The authors report no conflicts of interest in this work.
References
- GowlandCStratfordPWardMMeasuring physical impairment and disability with the Chedoke-McMaster Stroke AssessmentStroke199324158638418551
- Fugl-MeyerARJääsköLLeymanIOlssonSSteglindSThe post-stroke hemiplegic patient. 1. A method for evaluation of physical performanceScand J Rehabil Med19757113311135616
- MahoneyFIBarthelDWFunctional evaluation: the Barthel indexMd State Med J196514616514258950
- EinavOGevaDYoeliDKerzhnerMMauritzKHDevelopment and validation of the first robotic scale for the clinical assessment of upper extremity motor impairments in stroke patientsTop Stroke Rehabil201118Suppl 158759822120028
- CoderreAMZeidAADukelowSPAssessment of upper-limb sensorimotor function of subacute stroke patients using visually guided reachingNeurorehabil Neural Repair201024652854120233965
- ScottSHDukelowSPPotential of robots as next-generation technology for clinical assessment of neurological disorders and upper-limb therapyJ Rehabil Res Dev201148433535321674387
- PaciMPhysiotherapy based on the Bobath concept for adults with post-stroke hemiplegia: a review of effectiveness studiesJ Rehabil Med20033512712610841
- KollenBJLennonSLyonsBThe effectiveness of the Bobath concept in stroke rehabilitation: what is the evidence?Stroke2009404e89e9719182079
- VolpeBTHuertaPTZipseJLRobotic devices as therapeutic and diagnostic tools for stroke recoveryArch Neurol20096691086109019752297
- BoseckerCDipietroLVolpeBKrebsHIKinematic robot-based evaluation scales and clinical counterparts to measure upper limb motor performance in patients with chronic strokeNeurorehabil Neural Repair2010241626919684304
- MoralesRBadesaFJGarcía-AracilNSabaterJMPérez-VidalCPneumatic robotic systems for upper limb rehabilitationMed Biol Eng Comput201149101145115621822631
- KrebsHIAisenMLVolpeBTHoganNQuantization of continuous arm movements in humans with brain injuryProc Natl Acad Sci USA19999684645464910200316
- CirsteaMCMitnitskiABFeldmanAGLevinMFInterjoint coordination dynamics during reaching in strokeExp Brain Res2003151328930012819841
- BeerRFDewaldJPRymerWZDeficits in the coordination of multijoint arm movements in patients with hemiparesis: evidence for disturbed control of limb dynamicsExp Brain Res2000131330531910789946
- PattonJLStoykovMEKovicMMussa-IvaldiFAEvaluation of robotic training forces that either enhance or reduce error in chronic hemiparetic stroke survivorsExp Brain Res2006168336838316249912
- ReinkensmeyerDJEmkenJLCramerSCRobotics, motor learning, and neurologic recoveryAnnu Rev Biomed Eng2004649752515255778
- KalischTTegenthoffMDinseHRImprovement of sensorimotor functions in old age by passive sensory stimulationClin Interv Aging20083467369019281060
- MurphyMPRickJTMilgramNWIvyGOA simple and rapid test of sensorimotor function in the aged ratNeurobiol Learn Mem19956421811867582826
- RueckriegelSMBlankenburgFBurghardtRInfluence of age and movement complexity on kinematic hand movement parameters in childhood and adolescenceInt J Dev Neurosci200826765566318725285
- Daza-LesmesJEvaluación clínico funcional del movimiento corporal humano [Clinical and functional evaluation of human bodily movement]BogotáMedica Panamericana2007 Spanish
- WhitingPRutjesAWReitsmaJBGlasASBossuytPMKleijnenJSources of variation and bias in studies of diagnostic accuracy: a systematic reviewAnn Intern Med2004140318920214757617
- KalischTTegenthoffMDinseHRImprovement of sensorimotor functions in old age by passive sensory stimulationClin Interv Aging20083467369019281060