
Abstract
Purpose
This study aims to develop a novel MRI-based paravertebral muscle quality (PVMQ) score for assessing muscle quality and to investigate its correlation with the degree of fat infiltration (DFF) and the vertebral bone quality (VBQ) score of paravertebral muscles. Additionally, the study compares the effectiveness of the PVMQ score and the VBQ score in assessing muscle quality and bone quality.
Methods
PVMQ scores were derived from the ratio of paravertebral muscle signal intensity (SI) to L3 cerebrospinal fluid SI on T2-weighted MRI. Image J software assessed paravertebral muscle cross-sectional area (CSA) and DFF. Spearman rank correlation analyses explored associations between PVMQ, VBQ scores, DFF, and T-scores in both genders. Receiver operating characteristic (ROC) curves compared PVMQ and VBQ scores’ effectiveness in distinguishing osteopenia/osteoporosis and high paraspinal muscle DFF.
Results
In this study of 144 patients (94 females), PVMQ scores were significantly higher in osteoporosis and osteopenia groups compared to normals, with variations observed between genders (P < 0.05). PVMQ showed stronger positive correlation with VBQ scores and DFF in females than males (0.584 vs 0.445, 0.579 vs 0.528; P < 0.01). ROC analysis favored PVMQ over VBQ for low muscle mass in both genders (AUC = 0.767 vs 0.718, 0.793 vs 0.718). VBQ was better for bone mass in males (0.737/0.865 vs 0.691/0.858), whereas PVMQ excelled for females (0.808/0.764 vs 0.721/0.718).
Conclusion
The novel PVMQ score provides a reliable assessment of paravertebral muscle quality and shows a strong correlation with VBQ scores and DFF, particularly in females. It outperforms VBQ scores in evaluating muscle mass and offers valuable insights for assessing bone mass in females. These findings underscore the potential of the PVMQ score as a dual-purpose tool for evaluating both muscle and bone health, informing future research and clinical practice.
Introduction
Sarcopenia and osteoporosis result in the decline of muscle quality and bone quality, respectively, with a growing prevalence among the elderly population.Citation1,Citation2 Both conditions are linked to heightened disability, mortality, and an increased risk of fractures, classifying them as significant public health concerns impacting overall well-being.Citation3,Citation4 Given the shared pathophysiological mechanisms between sarcopenia and osteoporosis,Citation5 researchers introduce the term “osteosarcopenia” to signify their coexistence.Citation6 This underscores the need to explore the potential interplay between muscle and bone quality.
The European Working Group on Sarcopenia in Older People (EWGSOP) revised the definition of sarcopenia in 2019, characterizing it as a decline in both muscle quality and muscle strength.Citation7 Despite the availability of various imaging and non-imaging techniques for diagnosing sarcopenia, a universally accepted clinical diagnostic standard has not yet been established.Citation8 Bioelectrical impedance analysis (BIA) emerges as a straightforward non-imaging tool for assessing sarcopenia, offering a swift estimation of total muscle quality.Citation8 However, its precision may be compromised in patients with fluid and electrolyte imbalances.Citation9 Additionally, dual-energy X-ray absorptiometry (DXA) is regarded as the preferred method for evaluating local and total body muscle quality, delivering a relatively precise assessment of skeletal muscle quality in sarcopenia.Citation10 While computed tomography (CT) and magnetic resonance imaging (MRI) can effectively screen for sarcopenia by capturing muscle mass and cross-sectional area at specific sites,Citation9,Citation11 their use may introduce extra radiation, cost, and time due to technical limitations.Citation9 Hence, there is an imperative need for a widely accessible, uncomplicated, and expeditious tool for evaluating muscle quality.
Recently, methods for scoring vertebral bone quality (VBQ) based on MRI have been proposed for osteoporosis and fragility fracture assessment, demonstrating strong correlations with DXA T-scores and bone mineral density (BMD) measured by quantitative CT (QCT).Citation12–15 The key advantage of VBQ scoring lies in its capacity to opportunistically assess bone quality through the utilization of existing MRI examinations, thus circumventing additional patient radiation exposure and costs. However, a simple and effective tool for muscle mass assessment is lacking. Recent studies have shown that with age, sarcopenia leads to an increase in the degree of fat infiltration (DFF) in the paravertebral muscles, which appears as high signal on MRI T2-weighted images.Citation16,Citation17 Therefore, higher signal intensity (SI) in paravertebral muscles indicates greater DFF and poorer muscle quality.
The aim of this study was to create an MRI-based paravertebral muscle quality (PVMQ) score and to elucidate the extent to which it correlates with paraspinal muscle DFF. In addition, since bone and muscle are interconnected as a whole, we will further elucidate the correlation between the PVMQ score and the VBQ score and the DXA T-score and demonstrate its value in the assessment of bone quality and muscle quality.
Materials and Methods
Study Population
We conducted a retrospective collection of inpatients attending our hospital for low back pain or lumbar decompression surgery between January 2019 and December 2022. The inclusion criteria were as follows: patients who had both lumbar MRI and DXA scans performed within a time interval of less than 2 months. This criterion was set to ensure maximum consistency between the results from the two diagnostic tools. Exclusion criteria included: (1) patients under the age of 18 years or bedridden for more than 3 months; (2) patients with a history of spinal fracture, spinal surgery, spinal tumor or infection, or muscle strains, as these conditions may affect the measurements of the PVMQ and VBQ scores; and (3) patients with incomplete medical records. This study was approved by the Ethics Committee of our institution (2024CYFYIRB-BA-May 10). All procedures were conducted in accordance with the Declaration of Helsinki and its subsequent amendments, and all patient data are kept confidential. Informed consent was not required due to the retrospective nature of the study. Data on age, gender, body mass index (BMI), history of smoking, alcohol consumption, hypertension, diabetes mellitus, and long-term hormone use were collected from electronic medical records. Radiological data included Modic changes, DXA T-scores, MRI T2-weighted PVMQ scores, and T1-weighted VBQ scores.
DXA T-Score Measurement
Measurements were obtained using a DXA scanner at specific sites including the femoral neck and total hip to calculate T-scores. Lumbar T-scores are frequently influenced by kyphosis, osteoarthritis, or degenerative spinal conditions, potentially leading to inaccuracies in lumbar BMD measurements.Citation18 Consequently, to mitigate these confounding factors, only T-scores from the femoral neck and total hip were gathered for this study. Patients were stratified into 3 groups based on the lowest T-scores at the femoral neck and total hip: T-scores ≥ −1 were classified as the healthy bone group, T-scores between −1 and −2.5 were designated as the osteopenia group, and T-scores ≤ −2.5 were categorized as the osteoporotic group.
Definition and Staging of Modic Changes on MRI
According to a previous study,Citation19 Modic changes were defined as areas of low and high signal changes along the endplates on sagittal T1-weighted (T1W) and T2-weighted (T2W) images of the lumbar spine. We evaluated the Modic changes in the four segments from L1/L2 to L4/L5 in each patient. Type 0 was normal signal; Type 1 was defined as low signal on T1W and high signal on T2W; Type 2 was defined as high signal on both T1W and T2W; Type 3 was defined as low signal on both T1W and T2W.
Measurement of the PVMQ Score
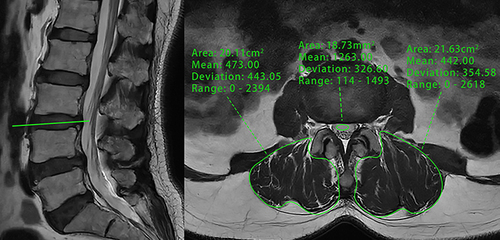
A patient’s lumbar MRI was analyzed using the hospital’s Picture Archiving and Communication System (PACS). A senior musculoskeletal radiologist trained two spine surgeons in PVMQ measurement techniques using PACS. The specific measurements were conducted as follows: first, MRI T2-weighted images of the intermediate cross-sectional sections at the L1/L2-L4/L5 disc levels were selected.Citation20 The observer then drew the contours of the right and left erector spinae and multifidus muscles along the boundaries of the muscle circles and averaged the values of the two sides to obtain measurements for each individual disc level (). Typically, adipose tissue exhibits high SI on T2-weighted images; thus, an increase in mean SI within a specific muscle region indicates a high degree of intramuscular fat infiltration.Citation21 Although region of interest (ROIs) are subjectively mapped, previous studies have demonstrated the intra- and inter-observer reliability of this measurement.Citation22 Additionally, similar to the VBQ score, cerebrospinal fluid at the L3 transect level was used as an adjusted indicator of signal difference from baseline.Citation23 Finally, the PVMQ score was calculated by dividing the mean SI of the four segments from L1/L2 to L4/L5 by the SI of the L3 cerebrospinal fluid (CSF) using the following formula:
Figure 1 Representative images used to calculate region of interest (ROI) for PVMQ scores: ROIs were positioned within the erector spinae and multifidus muscles on both the left and right sides of the L3/L4 intervertebral discs, as well as within the CSF of the L3/L4 segments, utilizing the PACS to assess their signal intensity.
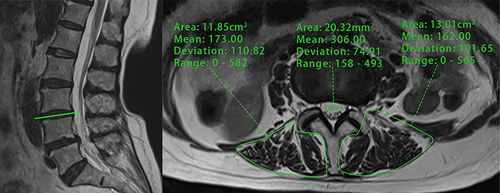
To evaluate the efficacy of PVMQ in patients with severe muscular dystrophy and fat infiltration, we conducted PVMQ score measurements in a single patient with severe muscular dystrophy (see ).
Figure 2 A 75-year-old woman with MRI t2-weighted images suggestive of severe muscle atrophy and more fatty infiltration of the paravertebral muscles had the signal intensity (SI) of the right and left paravertebral muscles and cerebrospinal fluid measured separately at the L3/4 disc level.
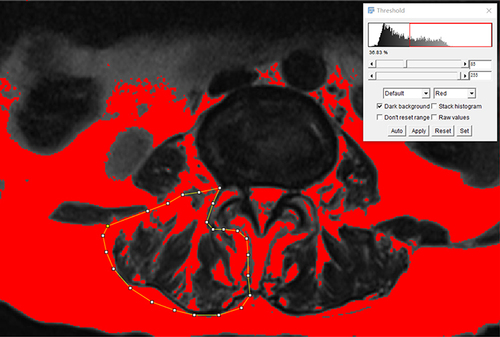
To assess the correlation between PVMQ scores and actual paravertebral muscle DFF, paravertebral muscle DFF was measured using Image J open-source software (version 1.53, National Institutes of Health, Bethesda, MD). Sagittal locator lines were employed to identify the L1/2-L4/5 disc levels on axial T2-weighted MRI, and ROIs were delineated by outlining the edges of the erector spinae and multifidus muscles. Cross-sectional area (CSA) was then measured, with mean CSA defined as the average of the two sides of each disc and the four disc levels. The percentage fat content of the paravertebral muscles was determined using a pseudo-coloring technique, where bright pixels of adipose tissue were colored red, and the area of fat within the red region in the muscle compartment was quantified (). Paravertebral muscle DFF was defined as the ratio of total fat CSA to total CSA.Citation24
Figure 3 Paravertebral muscle fat measurements by manually tracing the contours of the erector spinae and multifidus muscles in ImageJ software.
Measurement of the VBQ Score
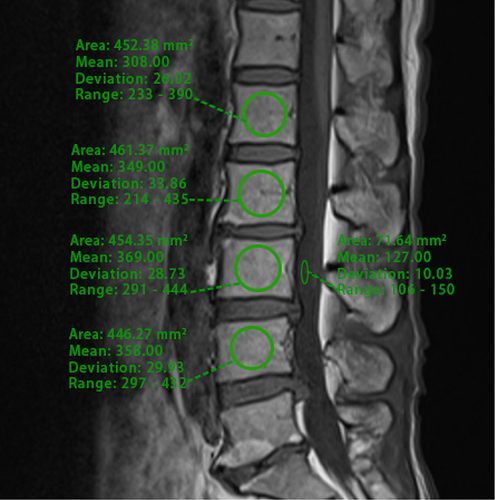
We adopted the same measurements as conducted by Ehresman et al.Citation23 This involved initially selecting T1-weighted magnetic resonance images of the lumbar spine in the median sagittal position, followed by the placement of ROI in the cancellous bone region of the L1-4 vertebrae and within the L3 CSF to calculate the mean SI (). Special care was taken to exclude any focal lesions as well as the posterior venous plexus, and if the ROI could not be placed due to these structures, parasagittal slices were used. The average SI of the L1-L4 vertebrae was divided by the SI of the L3 CSF using the following formula:
Figure 4 Sagittal non-contrast-enhanced T1-weighted MRI of the lumbar spine was conducted with ROI positioned at the vertebral bodies of L1-L4 and at the CSF level at L3 using the PACS.
PVMQ scores, VBQ scores, and muscle mass-related parameters were measured and calculated for all patients by spine surgeon Y.H, who is trained in MRI musculoskeletal radiology. To assess intraobserver reliability, these measurements were repeated in 35 randomly selected patients. To evaluate interobserver reliability, another researcher (B.Q.) independently assessed these 35 randomly selected patients. The researcher was blinded to the patients’ DXA results and utilized intraclass correlation coefficients (ICC) to analyze intra- and inter-observer reliability.
Statistical Analysis
All continuous variables underwent normality analysis using the Shapiro–Wilk test before further examination. Parametric tests, including one-way analysis of variance (ANOVA) and Student’s t-test, were employed for normally distributed variables, while non-parametric tests, such as Kruskal–Wallis H-test and Mann–Whitney U-test, were used for non-normally distributed variables. The chi-square test was applied for categorical variables. To control for confounding factors such as age and BMI, analysis of covariance (ANCOVA) was utilized to determine differences in muscle- and bone-related parameters among different BMD groups. Post-hoc comparisons of PVMQ scores, VBQ scores, mean CSA, and DFF were adjusted for P values using Bonferroni correction across the BMD groups. Intra- and inter-observer agreement of PVMQ scores, VBQ scores, and muscle-related parameters were assessed using the ICC, where ICC ≥ 0.75 indicated good reliability. Spearman rank correlation was employed to evaluate the correlation between PVMQ scores and VBQ scores, DFF, mean CSA, femoral neck T-score, total hip T-score, and lowest T-score in men and women, respectively. The optimal threshold was identified using the maximum Youden index of the receiver operating characteristic (ROC) curve, and the area under the curve (AUC), sensitivity, and specificity were computed. Multiple linear regression analyses were conducted with PVMQ scores as the dependent variable and VBQ, muscle-related parameters, T-scores, and demographic data as independent variables. Statistical analyses were performed using SPSS 26.0 (IBM, New York, USA) software, and GraphPad Prism 9.02 was used for plotting. A significance level of P < 0.05 was considered statistically significant.
Results
Patient Characteristics
A total of 144 patients, including 94 females, were enrolled in this study. According to the minimum T-score diagnostic criteria, 46 patients exhibited normal BMD (age range: 45–79 years), 53 patients had reduced bone mass (age range: 48–89 years), and 45 patients were diagnosed with osteoporosis (age range: 48–92 years). Detailed demographic and radiological data of the study population are provided in . Patients with osteopenia and osteoporosis were older (p < 0.001) and had lower BMI (p = 0.004) compared to the normal group. Femoral neck, total hip, and lowest T-scores were significantly lower in the osteopenia and osteoporosis groups than in the normal group (p < 0.001). Additionally, PVMQ scores, VBQ scores, and paravertebral muscle DFF were significantly higher in the bone loss and osteoporosis groups compared to patients with normal BMD, while the mean CSA was significantly lower than that of the normal patients (p < 0.001). The remaining variables were not significantly different between groups. After adjusting for age and BMI, the VBQ score, PVMQ score, mean CSA, and DFF remained statistically different.
Table 1 Demographics and Radiological Data of the Study Population (n=144)
To compare the differences in PVMQ scores, VBQ scores, mean CSA, and DFF among the various BMD groups, post hoc tests were conducted (). The findings revealed significant differences in all four variables between the normal and osteoporotic groups (adjusted P < 0.001). Additionally, PVMQ, DFF, and CSA exhibited differences between the normal and osteopenia groups, while VBQ and PVMQ were significantly different between the osteopenia and osteoporotic groups (adjusted P < 0.05).
Table 2 Post Hoc Tests of Muscle Mass and Bone Quality Parameters Between Different BMD Groups
Differences in Parameters Related to Bone Quality and Muscle Quality in Males and Females
To further mitigate the influence of gender on the outcomes, subgroup analyses of muscle mass and bone mass-related parameters were conducted for both male and female groups (). The analysis revealed that PVMQ scores and DFF were significantly higher in females compared to males (0.380 vs 0.311, 28.19% vs 23.48%, p < 0.05), while VBQ scores and mean CSA showed no significant differences between genders.
Table 3 Comparison of Muscle Quality and Bone Quality Parameters Between Genders
Correlation Analysis of Bone and Muscle Related Parameters Between Genders
Correlation analyses revealed that within the male group, PVMQ exhibited a moderate positive correlation with VBQ scores and DFF (r = 0.445 and 0.528, respectively, p < 0.01), alongside a moderate positive correlation between VBQ and DFF (r = 0.398, p < 0.01). Conversely, within the female group, PVMQ displayed a moderately positive correlation with VBQ scores and DFF, with a stronger correlation observed compared to males (r = 0.584 and 0.579, p < 0.01, respectively). Additionally, a positive correlation was observed between VBQ and DFF (r = 0.341, p < 0.01). Moreover, PVMQ and VBQ scores exhibited significant negative correlations with DXA T scores in both males and females (p < 0.01) ().
Table 4 Correlations Between PVMQ Scores and VBQ Scores and T Scores
Comparison of the Value of PVMQ and VBQ Scores for Assessing Bone Quality and Muscle Quality Males and Females
The overall median DFF in the paravertebral muscles was 25.52% (). Hence, patients were divided into two groups based on DFF levels: those with DFF < 25% were classified into the low DFF group, while those with DFF ≥ 25% were categorized into the high DFF group, consistent with previous studies.Citation25
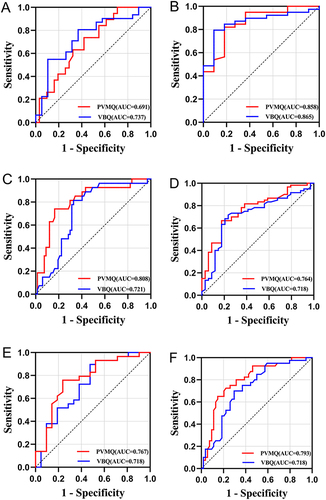
ROC curve analysis revealed that in men, the AUC for predicting low bone density and osteoporosis were 0.691 and 0.858, respectively, with PVMQ scores having cut-off values of 0.324 and 0.392, while for VBQ scores, the AUCs were 0.737 and 0.865 with cut-off values of 2.90 and 2.91, respectively. Additionally, the AUC for high DFF assessment was higher for PVMQ compared to VBQ (0.767 vs 0.718) (, and ). In women, the AUCs for predicting low bone density and osteoporosis were 0.808 and 0.764 with PVMQ scores having cut-off values of 0.335 and 0.368, respectively, and 0.721 and 0.718 with VBQ scores having cut-off values of 2.82 and 3.00. Furthermore, the AUCs for assessing DFF were higher for PVMQ compared to VBQ (0.793 vs 0.718) ( and ).
Table 5 Accuracy of PVMQ and VBQ in Diagnosing Low BMD, Osteoporosis, and High DFF in Male and Female Populations
Figure 5 ROC curves of PVMQ and VBQ scores for screening for osteopenia and osteoporosis, (A, B) for men and (C, D) for women. In addition, E and F denote the value of PVMQ and VBQ scores for screening men and women for high DFF, respectively.
Independent Predictors of PVMQ Score
Based on multiple linear regression analyses, the VBQ score (β = 0.281; p < 0.001), lowest T-score (β = −0.224; p = 0.004), DFF (β = 0.400; p < 0.001), and female gender (β = 0.155; p = 0.017) emerged as independent predictor variables of PVMQ scores. The overall regression model demonstrated statistical significance (F = 12.122, p < 0.001) with an adjusted R² = 0.483, suggesting that approximately 48.3% of the variance in PVMQ scores could be elucidated by the independent variables ().
Table 6 Regression Coefficients for Predicting PVMQ Scores
The ICC Results demonstrated good intra- and inter-rater reliability for the PVMQ, VBQ, mean CSA, and DFF, with ICCs exceeding 0.80 ().
Table 7 Intra- and Inter-Assessor Reliability of Muscle Mass and Bone Mass Parameters Using Intra-Group Correlation Coefficients
Discussion
It is well known that muscle and bone are metabolically and functionally interconnected as a whole. Muscle imparts a mechanical load on bone during contraction, activating signal transduction pathways in osteoblasts and thereby mitigating the risk of osteoporosis.Citation26 With advancing age, the prevalence of osteoporosis and sarcopenia substantially increases, often coexisting and heightening the susceptibility to fragility fractures, falls, and mortality.Citation27 A study conducted by Huo et alCitation28 revealed that the concurrent presence of osteoporosis and sarcopenia significantly elevates the risk of fractures, depression, and malnutrition. Moreover, a large prospective study demonstrated that women with sarcopenia face a 1.66-fold increased risk of osteoporosis.Citation29 In a study by Sjoblom et al,Citation30 patients with sarcopenia exhibited a 12.9-fold higher risk of osteoporosis compared to those without sarcopenia. Hence, evaluating muscle mass is crucial not only for preventing sarcopenia but also for mitigating the risk of osteoporosis.Citation31
In this study, the novel PVMQ score demonstrated a moderate correlation with paravertebral muscle DFF, VBQ, and T scores. PVMQ and DFF were significantly higher in osteoporotic patients compared to non-osteoporotic patients, aligning with the increased fat infiltration of paravertebral muscles in osteoporotic individuals.Citation32 ROC curve analysis revealed that the VBQ score effectively screened for low bone density/osteoporosis in males, while the PVMQ score was more effective in females. Notably, the PVMQ was more valuable than the VBQ for assessing muscle mass in both genders. Multiple linear regression analyses identified paravertebral muscle DFF and VBQ scores as independent predictors of PVMQ scores, highlighting the significance of PVMQ scores in reflecting both muscle and bone quality.
The diagnosis of sarcopenia relies on evaluating both muscle quality and strength. While standardized diagnostic criteria for sarcopenia are lacking, various tools are available for muscle quality assessment.Citation7 DXA is the most commonly used tool for body composition assessment and has been widely used for whole-body muscle quality measurement.Citation9 However, DXA is unable to assess intramuscular fat, which accounts for 5–15% of observed muscle quality in obese populations.Citation33 Furthermore, its muscle quality assessment is infrequently used in the general population and lacks routine clinical applicability. CT and MRI offer the ability to assess total muscle area and fat-free muscle area with higher accuracy and reproducibility for fat and muscle, proving more sensitive than DXA.Citation9,Citation11 However, whole-body CT involves high radiation and limited utility, while MRI is costlier, more procedurally intricate, and less readily available.Citation34 Hence, there is a pressing need for a routine, clinically applicable method for muscle mass assessment to enhance sarcopenia diagnosis.
The VBQ score, a novel method measuring the extent of fat infiltration in the vertebral body, serves as an indirect indicator of bone quality and has demonstrated robust correlations with both the T-score and QCT.Citation12–14 Notably, the VBQ score remains unaffected by variables such as degenerative spinal lesions during bone quality assessment, positioning it as a potentially more precise tool for evaluating osteoporosis compared to the DXA T-score.Citation35 Recently, Li et alCitation36 first associated VBQ scores with paravertebral muscle mass, measured using ImageJ software, and demonstrated a moderate correlation between the two (r = 0.344–0.481). This finding is consistent with the results of the present study, which showed correlation coefficients of 0.341 and 0.398 for VBQ and DFF, respectively. However, the use of ImageJ for muscle mass assessment necessitates additional analysis software, limiting its general applicability in clinical settings.
Therefore, inspired by the VBQ score, we developed a simple and practical opportunistic paraspinal muscle quality assessment tool and analysed its correlation with the VBQ score and paraspinal DFF. Post hoc analysis demonstrated statistically significant differences in PVMQ scores between all three groups (adjusted P < 0.05), while VBQ scores did not show significant differences between the normal and osteopenia groups (adjusted P = 0.071). This suggests that the PVMQ score might exhibit greater sensitivity in distinguishing patients with normal and abnormal BMD.
Given the differences in muscle mass-related parameters between males and females,Citation37 we performed gender-specific subgroup analyses. Results indicated that PVMQ and DFF were significantly higher in females than in males (P < 0.05), while VBQ and CSA did not differ significantly between genders. Correlation analysis revealed that PVMQ scores were moderately positively correlated with both DFF and VBQ scores (r = 0.528 and 0.445 for males; r = 0.579 and 0.584 for females), and moderately negatively correlated with T-scores (r = −0.540 to −0.459). These findings align with previous research indicating a relationship between muscle mass and bone mass.Citation36,Citation38 However, this study did not find a correlation between VBQ and CSA, which contrasts with prior studies.Citation36 This discrepancy may be attributed to the older age of the patients in this study (68.3 vs 58.3 years).
In recent years, multiple studies have highlighted the potential of muscle mass in diagnosing osteoporosis. Kajiki et alCitation38 demonstrated a significant correlation between the psoas muscle index and femoral neck BMD, as measured by DXA (r = 0.525). Moreover, the lumbar muscle index exhibited moderate accuracy in predicting osteoporosis (AUC = 0.739). In this study, we compared the ability of PVMQ and VBQ scores to predict high muscle DFF and osteoporosis in men and women. The VBQ score was more effective than the PVMQ score in diagnosing low bone density/osteoporosis in men (AUC = 0.737 vs 0.691 for low bone density; AUC = 0.865 vs 0.858 for osteoporosis). Conversely, the PVMQ score was more effective than the VBQ score in diagnosing low bone density/osteoporosis in women (AUC = 0.808 vs 0.721 for low bone density; AUC = 0.764 vs 0.718 for osteoporosis). Notably, the PVMQ score was superior to the VBQ score for assessing high DFF in both men and women. Therefore, VBQ may be more suitable for bone mass screening in men, while PVMQ scores may provide better results for both bone mass and muscle mass assessment in women. Consequently, individuals with elevated PVMQ scores should be alerted to the dual risks of sarcopenia and osteoporosis. Timely preventive and therapeutic interventions, such as resistance exercise, appropriate nutritional enhancement,Citation39 and the utilization of DXA for accurate assessment of BMD and muscle quality, should be promptly implemented.
Multiple linear regression analyses showed that the VBQ score, DFF, and lowest T-score were all independent predictors of the PVMQ score (adjusted R² = 0.483). This underscores the significant value of the PVMQ score in assessing muscle and bone mass. Although further large-sample prospective studies are needed to validate its reliability and validity, these findings suggest that the PVMQ score may become an important parameter in future research on the relationship between sarcopenia and osteoporosis.
However, several limitations are acknowledged in this study. Firstly, the single-center population data were constrained by geographic location and the availability of medical records, potentially restricting the generalizability of our findings to other patient cohorts. Further validation through prospective multicenter studies is imperative to enhance the external validity of our results. Secondly, the inclusion of patients taking anti-osteoporotic medications in this study could impact the measurement of the PVMQ score. Subsequent investigations are warranted to ascertain the suitability and accuracy of applying this score in patients undergoing such treatment. Thirdly, due to the limitations of a retrospective study, we utilized MRI T2-weighted cross-sectional images for PVMQ measurements. The validity of T1-weighted images for PVMQ score measurements remains unknown, and further prospective studies comparing different sequences are necessary. However, several studies have demonstrated the reliability of MRI T2 images for muscle mass assessment.Citation40,Citation41 Finally, the diagnosis of sarcopenia includes not only muscle quality, but also the assessment of muscle strength and physical function. Therefore, we are still unclear about the relationship between PVMQ in sarcopenia and non-sarcopenia groups, and further evidence is needed in future studies.
Conclusion
Our study introduces a novel MRI-based PVMQ score, demonstrating its significant association with VBQ scores and DFF. Notably, PVMQ outperforms VBQ in assessing muscle quality, particularly in females. These findings underscore the clinical relevance of PVMQ in evaluating musculoskeletal health and suggest avenues for future research into gender-specific diagnostic and therapeutic strategies.
Abbreviations
PVMQ, paravertebral muscle quality; VBQ, vertebral bone quality; BMD, bone mineral density; DXA, dual-energy X-ray absorptiometry; CT, computed tomography; ROI, region of interest; CSF, cerebrospinal fluid; MRI, magnetic resonance imaging; ROC, receiver operating characteristic, CSA, cross-sectional area, DFF, degree of fat infiltration.
Ethical Statement
This was a retrospective study approved by the Ethics Committee of the First Affiliated Hospital of Chengdu Medical College (No. 2024CYFYIRB-BA-May 10) and exempted from completing the patient informed consent form. The study was conducted in accordance with the Declaration of Helsinki and patient data were confidential.
Disclosure
The authors report no conflicts of interest in this work.
Additional information
Funding
References
- Laurent MR, Dubois V, Claessens F, et al. Muscle-bone interactions: from experimental models to the clinic? A critical update. Mol Cell Endocrinol. 2016;432:14–36. doi:10.1016/j.mce.2015.10.017
- Beaudart C, Dawson A, Shaw SC, et al. Nutrition and physical activity in the prevention and treatment of sarcopenia: systematic review. Osteoporos Int. 2017;28(6):1817–1833. doi:10.1007/s00198-017-3980-9
- Edwards MH, Dennison EM, Aihie SA, et al. Osteoporosis and sarcopenia in older age. Bone. 2015;80:126–130. doi:10.1016/j.bone.2015.04.016
- Sousa AS, Guerra RS, Fonseca I, et al. Financial impact of sarcopenia on hospitalization costs. Eur J Clin Nutr. 2016;70(9):1046–1051. doi:10.1038/ejcn.2016.73
- Paintin J, Cooper C, Dennison E. Osteosarcopenia. Br J Hosp Med. 2018;79(5):253–258. doi:10.12968/hmed.2018.79.5.253
- Clynes MA, Gregson CL, Bruyere O, et al. Osteosarcopenia: where osteoporosis and sarcopenia collide. Rheumatology. 2021;60(2):529–537. doi:10.1093/rheumatology/keaa755
- Cruz-Jentoft AJ, Bahat G, Bauer J, et al. Sarcopenia: revised European consensus on definition and diagnosis. Age Ageing. 2019;48(4):601. doi:10.1093/ageing/afz046
- Cooper C, Fielding R, Visser M, et al. Tools in the assessment of sarcopenia. Calcif Tissue Int. 2013;93(3):201–210. doi:10.1007/s00223-013-9757-z
- Messina C, Maffi G, Vitale JA, et al. Diagnostic imaging of osteoporosis and sarcopenia: a narrative review. Quant Imaging Med Surg. 2018;8(1):86–99. doi:10.21037/qims.2018.01.01
- Cheng KY, Chow SK, Hung VW, et al. Diagnosis of sarcopenia by evaluating skeletal muscle mass by adjusted bioimpedance analysis validated with dual-energy X-ray absorptiometry. J Cachexia Sarcopenia Muscle. 2021;12(6):2163–2173. doi:10.1002/jcsm.12825
- Chen Z, Wang Z, Lohman T, et al. Dual-energy X-ray absorptiometry is a valid tool for assessing skeletal muscle mass in older women. J Nutr. 2007;137(12):2775–2780. doi:10.1093/jn/137.12.2775
- Ehresman J, Pennington Z, Schilling A, et al. Novel MRI-based score for assessment of bone density in operative spine patients. Spine J. 2020;20(4):556–562. doi:10.1016/j.spinee.2019.10.018
- Salzmann SN, Okano I, Jones C, et al. Preoperative MRI-based vertebral bone quality (VBQ) score assessment in patients undergoing lumbar spinal fusion. Spine J. 2022;22(8):1301–1308. doi:10.1016/j.spinee.2022.03.006
- Wang S, Liu H, Yang K, et al. The significance of combined OSTA, HU Value and VBQ score in osteoporosis screening before spinal surgery. World Neurosurg. 2024;182:e692–e701. doi:10.1016/j.wneu.2023.12.022
- Wang S, Hu Y, Liu H, et al. Simplified S1 vertebral bone quality score in the assessment of patients with vertebral fragility fractures. World Neurosurg. 2024;185:e1004–e1012. doi:10.1016/j.wneu.2024.03.011
- Han G, Jiang Y, Zhang B, et al. Imaging evaluation of fat infiltration in paraspinal muscles on MRI: a systematic review with a focus on methodology. Orthop Surg. 2021;13(4):1141–1148. doi:10.1111/os.12962
- Teichtahl AJ, Urquhart DM, Wang Y, et al. Lumbar disc degeneration is associated with modic change and high paraspinal fat content - A 3.0T magnetic resonance imaging study. BMC Musculoskelet Disord. 2016;17(1):439. doi:10.1186/s12891-016-1297-z
- Paiva LC, Filardi S, Pinto-Neto AM, et al. Impact of degenerative radiographic abnormalities and vertebral fractures on spinal bone density of women with osteoporosis. Sao Paulo Med J. 2002;120(1):9–12. doi:10.1590/s1516-31802002000100003
- Modic MT, Steinberg PM, Ross JS, et al. Degenerative disk disease: assessment of changes in vertebral body marrow with MR imaging. Radiology. 1988;166(1 Pt 1):193–199. doi:10.1148/radiology.166.1.3336678
- Hoppe S, Maurer D, Valenzuela W, et al. 3D analysis of fatty infiltration of the paravertebral lumbar muscles using T2 images-A new approach. Eur Spine J. 2021;30(9):2570–2576. doi:10.1007/s00586-021-06810-7
- Zhao Y, Huang M, Serrano SM, et al. Fatty infiltration of paraspinal muscles is associated with bone mineral density of the lumbar spine. Arch Osteoporos. 2019;14(1):99. doi:10.1007/s11657-019-0639-5
- Battaglia PJ, Maeda Y, Welk A, et al. Reliability of the Goutallier classification in quantifying muscle fatty degeneration in the lumbar multifidus using magnetic resonance imaging. J Manipulative Physiol Ther. 2014;37(3):190–197. doi:10.1016/j.jmpt.2013.12.010
- Ehresman J, Schilling A, Yang X, et al. Vertebral bone quality score predicts fragility fractures independently of bone mineral density. Spine J. 2021;21(1):20–27. doi:10.1016/j.spinee.2020.05.540
- Takayama K, Kita T, Nakamura H, et al. New predictive index for lumbar paraspinal muscle degeneration associated with aging. Spine. 2016;41(2):E84–E90. doi:10.1097/BRS.0000000000001154
- Liu Y, Liu Y, Hai Y, et al. Fat infiltration in the multifidus muscle as a predictor of prognosis after decompression and fusion in patients with single-segment degenerative lumbar spinal stenosis: an ambispective cohort study based on propensity score matching. World Neurosurg. 2019;128:e989–e1001. doi:10.1016/j.wneu.2019.05.055
- Tagliaferri C, Wittrant Y, Davicco MJ, et al. Muscle and bone, two interconnected tissues. Ageing Res Rev. 2015;21:55–70. doi:10.1016/j.arr.2015.03.002
- Binkley N, Krueger D, Buehring B. What’s in a name revisited: should osteoporosis and sarcopenia be considered components of ”dysmobility syndrome?”. Osteoporos Int. 2013;24(12):2955–2959. doi:10.1007/s00198-013-2427-1
- Huo YR, Suriyaarachchi P, Gomez F, et al. Phenotype of osteosarcopenia in older individuals with a history of falling. J Am Med Dir Assoc. 2015;16(4):290–295. doi:10.1016/j.jamda.2014.10.018
- Petermann-Rocha F, Ferguson LD, Gray SR, et al. Association of sarcopenia with incident osteoporosis: a prospective study of 168,682 UK biobank participants. J Cachexia Sarcopenia Muscle. 2021;12(5):1179–1188. doi:10.1002/jcsm.12757
- Sjoblom S, Suuronen J, Rikkonen T, et al. Relationship between postmenopausal osteoporosis and the components of clinical sarcopenia. Maturitas. 2013;75(2):175–180. doi:10.1016/j.maturitas.2013.03.016
- Bettis T, Kim BJ, Hamrick MW. Impact of muscle atrophy on bone metabolism and bone strength: implications for muscle-bone crosstalk with aging and disuse. Osteoporos Int. 2018;29(8):1713–1720. doi:10.1007/s00198-018-4570-1
- Sollmann N, Dieckmeyer M, Schlaeger S, et al. Associations between lumbar vertebral bone marrow and paraspinal muscle fat compositions-an investigation by chemical shift encoding-based water-fat MRI. Front Endocrinol. 2018;9:563. doi:10.3389/fendo.2018.00563
- Plank LD. Dual-energy X-ray absorptiometry and body composition. Curr Opin Clin Nutr Metab Care. 2005;8(3):305–309. doi:10.1097/01.mco.0000165010.31826.3d
- Boutin RD, Houston DK, Chaudhari AS, et al. Imaging of Sarcopenia. Radiol Clin North Am. 2022;60(4):575–582. doi:10.1016/j.rcl.2022.03.001
- Chen H, Zhu X, Zhou Q, et al. Utility of MRI-based vertebral bone quality scores and CT-based Hounsfield unit values in vertebral bone mineral density assessment for patients with diffuse idiopathic skeletal hyperostosis. Osteoporos Int. 2023. doi:10.1007/s00198-023-06999-x
- Li W, Wang F, Chen J, et al. MRI‑based vertebral bone quality score is a comprehensive index reflecting the quality of bone and paravertebral muscle. Spine J. 2023. doi:10.1016/j.spinee.2023.11.007
- Ning HT, Du Y, Zhao LJ, et al. Racial and gender differences in the relationship between sarcopenia and bone mineral density among older adults. Osteoporos Int. 2021;32(5):841–851. doi:10.1007/s00198-020-05744-y
- Kajiki Y, Tsuji H, Misawa H, et al. Psoas muscle index predicts osteoporosis and fracture risk in individuals with degenerative spinal disease. Nutrition. 2022;93:111428. doi:10.1016/j.nut.2021.111428
- Cruz-Jentoft AJ, Landi F, Schneider SM, et al. Prevalence of and interventions for sarcopenia in ageing adults: a systematic review. Report of the international sarcopenia initiative (EWGSOP and IWGS). Age Ageing. 2014;43(6):748–759. doi:10.1093/ageing/afu115
- Vitale J, Sconfienza LM, Galbusera F. Cross-sectional area and fat infiltration of the lumbar spine muscles in patients with back disorders: a deep learning-based big data analysis. Eur Spine J. 2024;33(1):1–10. doi:10.1007/s00586-023-07982-0
- Fortin M, Lazary A, Varga PP, et al. Paraspinal muscle asymmetry and fat infiltration in patients with symptomatic disc herniation. Eur Spine J. 2016;25(5):1452–1459. doi:10.1007/s00586-016-4503-7