Abstract
Objective
To estimate the value of the different thromboelastogram indices for predicting hemorrhage and vascular obstruction in an elderly population.
Methods
This was a prospective cohort study of patients 65 years and older without hemato-logic disorders who received thromboelastography (TEG) examination at the Chinese People’s Liberation Army General Hospital from January 2007 to December 2010. Detailed information was collected at recruitment including their TEG test results. Subjects were then followed during outpatient visits and hospitalization. The primary outcome measures were hemorrhage and vascular obstruction. Receiver-operating characteristics (ROC) curves were used to compare the predictive value of the four TEG indices, reaction time (R), clot formation time (K), maximal amplitude (MA), alpha angle (ANGLE) and their combination for predicting hemorrhage and vascular obstruction. The maximal Youden’s index was used to estimate optimal cut-off values for the indices. Areas under the ROC curves were used to estimate overall predictive accuracies.
Results
A total of 403 elderly patients met inclusion criteria and were included: 373 male and 30 females with mean age 83.0 ± 7.3 years and range of 65–103 years. Hemorrhage occurred in 25 (6.2%) patients and vascular obstruction in 78 (19.4%) patients during the 2-year follow up. The currently recommended TEG cut-off values were poorly predictive of vascular obstruction and modestly predictive of hemorrhage. Based on maximal Youden’s, the optimal cutoffs of the TEG indices for predicting vascular obstruction were: R = 7, K = 1.5, MA = 63.5, and ANGLE = 67.1. A combination of all four showed the best predictive value (area under the ROC curve of 0.60, sensitivity 85.9%, and specificity 34.7%). The optimal cut-off values for predicting hemorrhage were: R = 7.8, K = 2.3, MA = 50.5, ANGLE = 53.7. A combination of R and MA was also most predictive of hemorrhage (area under ROC curve 0.66, sensitivity 60%, and specificity 71.7%).
Conclusion
The currently adopted cut-off values for TEG indices are poorly and modestly predictive of hemorrhage and obstruction, respectively, in the elderly population. Optimal cutoff values determined by ROC curve analysis improved the prediction of vascular obstruction and hemorrhage.
Introduction
As life expectancy increases in the People’s Republic of China and around the world, the number of elderly people continues to rise.Citation1–Citation4 Hemorrhage and vascular obstruction are two common complications in this population and early diagnosis is important in reducing morbidity and mortality.
Thromboelastography (TEG) is based on measurements of the viscoelastic properties of whole blood specimens and the various activities that transpire in coagulation.Citation5 It gives a real-time functional evaluation of the coagulation cascade, beginning with initial platelet-fibrin interaction through platelet aggregation, clot strengthening, and fibrin cross-linkage, and eventually clot lysis.Citation6 As it is able to provide an assessment of clot initiation and formation and stability of the clot, it is ideally suited to demonstrate both hypo- and hypercoagulable states. TEG has been shown to predict venous thromboembolism (VTE), vascular graft occlusion, and myocardial infarction risk in various patient populations.Citation7–Citation10
Prior studies have demonstrated the value of TEG indices for predicting hemorrhage and vascular obstruction after surgery or trauma.Citation11–Citation15 However, there have been no long-term follow-up studies investigating the ability of TEG to predict obstruction and hemorrhagic events. In addition, due to the unique physiology of the elderly, the threshold of the TEG indices for diagnosing these conditions may be different from those currently recommended.
The objective of the present study is two-fold: (1) to test the predictive value of current cutoffs of TEG indices for predicating hemorrhage and vascular obstruction, and (2) to estimate the optimal cut-off values of TEG indices for predicting hemorrhage and obstruction in the elderly.
Materials and methods
Study setting
This was a two-year, prospective cohort study. The institutional review board of the Chinese PLA General Hospital approved this study. The Chinese PLA General Hospital, located in Beijing, People’s Republic of China, is the largest comprehensive level 3 Grade-A hospital in the army. It is well acknowledged as a modern medical institution with a full range of medical service, health care, advanced medical education, and powerful scientific research.
Selection of participants
Patients 65 years or older who received the TEG test at the Chinese People’s Liberation Army General Hospital from January 2007 to December 2010 were included. Patients with hematological disorders and those who did not complete the 2-year follow-up were excluded. Detailed information including sex, age, TEG test result, bed rest history, medication history, and disease history was collected at enrollment. Subjects were then followed for 2 years at each outpatient visit or hospitalization for the occurrence of hemorrhage or vascular obstruction.
Laboratory setting and processing of specimens
All TEG specimens were run on Thromboelastograph Analyzer 5000 (Haemoscope Corporation, Braintree, MA, USA). According to the manufacturer’s guidelines, 1 mL of citrated blood was placed in a vial contained 1% kaolin. After adding the blood sample, the vial was inverted five times to ensure activation of the respective additives. After activation, 340 μL of blood was pipetted into one cuvette, TEG analysis was performed at once with on-line analysis (TEG Analytical Software: Version 4.2.101; Haemoscope Corporation, Braintree, MA, USA). The tracing was automatically stopped after a period following attainment of maximum amplitude (MA). Quality control checks were completed within 8 hours of blood collection per the manufacturer. The following indexes were recorded from the computer-generated thromboelastograph for each sample.
TEG measurements
The main TEG parameters recorded included: (1) reaction time (R) the time required from the start of blood sample test to fibrin formation; normal range is 2–8 minutes; longer R suggests hypocoagulable state, and shorter R suggests hyper-coagulable state), (2) clot formation time (K), the time from start of coagulation to the amplitude of TEG traces reaching 20 mm; normal range is 1–3 minutes; longer K suggests hypocoagulable state and shorter K suggests hypercoagulable state, (3) maximum amplitude (MA), reflecting the absolute strength of blood clots; normal range is 51–69 mm; smaller MA suggests hypocoagulable state and larger MA suggests hypercoagulable state, and (4) alpha angle (ANGLE), referring to the angle between horizontal line and the line tangential to the maximum radian curve from the point of blood clot formation to trace diagram; representing the rate of blood clot formation; normal range is 55°–78°; smaller ANGLE suggests hypocoagulable state and larger ANGLE suggests hypercoagulable state.Citation16
Define of outcomes
The primary outcome measures were vascular obstructions and hemorrhage. Vascular obstruction was defined as the occurrence of any of the following: myocardial infarction, ischemic stroke, deep vein thrombosis, and pulmonary embolism. New myocardial infarction was diagnosed by clinical symptoms, ECG changes, and myocardial enzymes. Ischemic stroke was diagnosed clinically and confirmed by a head computerized tomography or magnetic resonance imaging. Diagnosis of deep vein thrombosis was made by clinical manifestations and venous ultrasound scan, while pulmonary embolism was confirmed by a chest or pulmonary angiography. Hemorrhagic events were defined as the occurrence of any of the following: hematuria, gastrointestinal hemorrhage, surgical wound hemorrhage, hemorrhage in the mouth or nose, purpura, or ecchymosis. These were confirmed by direct clinical manifestations, and results of microscopic examination and occult blood test.
Statistical analysis
Data were analyzed using SAS 9.13 (SAS Institute Inc, Cary, NC, USA) statistics software package. Continuous variables were compared between multiple groups using analysis of variance (ANOVA) while categorical variables were compared using the X2 test. Tests with P < 0.05 were considered statistically significant. PROC LOGISTIC procedure was used to construct ROC curves. The maximal Youden’s index was used to estimate the optimal cut-off values of different TEG indices. Sensitivity and specificity of different TEG indices in predicting outcome events were calculated. Areas under the ROC curves were used to estimate overall predicting accuracy of different TEG indices and combinations, and were compared using the Delong Clarke-Pearson test. Multi-factor Cox regression model was used to identify independent predictors of the outcome events.
Results
Demographic and baseline data
A total of 403 patients were enrolled, including 373 men (92.6%) and 30 women (7.4%), with a mean age of 83.0 ± 7.3 years old, ranging from 65–103 years old. During the follow-up study, 25 (6.2%) hemorrhagic events and 78 (19.4%) obstruction events (including 32 cases of myocardial infarction, 19 cases of cerebral infarction, 3 cases of limb arterial thrombosis, 20 cases of limb venous thrombosis, and 4 cases of mesenteric arterial thrombosis) occurred. A comparison of clinical characteristics laboratory test results for these groups is shown in . There were no differences in sex or treatment with anticoagulation drugs among groups. However, age, long-term bed rest, and history of obstructive diseases were significantly different among the three groups. Baseline values of TEG indices R, K, and ANGLE were also significantly different among the groups.
Table 1 Comparison of general information and clinical features between patients in different groups
ROC analysis
Currently recommended cut-off values (R ≤ 2, K ≤ 1, MA ≥ 69, or ANGLE ≥ 78) demonstrated poor predictive value for vascular obstruction (). Whereas K and MA had high specificity (95% and 94%, respectively), the corresponding sensitivities were rather low (only 5.1% and 14.1%, respectively). The other two indices R and ANGLE were unable to detect positive cases of obstruction.
Table 2 Predicting obstruction in elderly population using ROC curves and currently adopted cutoff values for different TEG indices
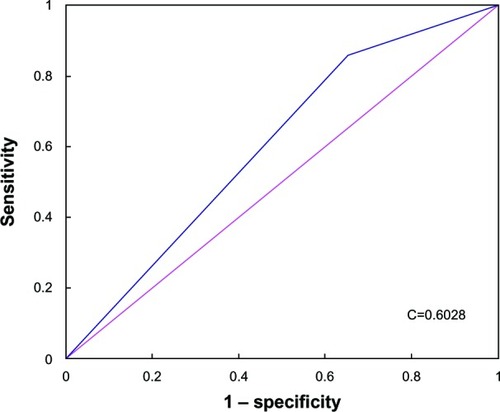
Based on maximal Youden’s indices, the optimal cut-off values for different TEG indices for predicting vascular obstruction in the elderly were R = 7, K = 1.5, MA = 63.5, and ANGLE = 67.1. Using these optimal cut-off values, sensitivity, specificity, positive predictive value, negative predictive value, accuracy, and AUC of ROC curve were calculated (). When these optimal cut-off values were used, all four TEG indices showed statistically significant, but modest improvements in predictive value (area under ROC curves 0.59, 0.60, 0.58, and 0.57 for R, K, MA, and ANGLE, respectively). The predictive values of the four TEG indices were variable in the order of K > R > MA > ANGLE with R having the highest sensitivity (78.2%) and ANGLE having the highest specificity (77%). Analysis of different serial and parallel combinations showed that a joint index combining all four indices in parallel resulted in better predictive value than any single index (; area under ROC curve 0.60, sensitivity 85.9%, specificity 34.7%, positive predictive value 25.5%, and negative predictive value 90.5%).
Table 3 Predicting obstruction in elderly population using ROC curves and optimal cutoff values for different TEG indices
Figure 1 Receiver-operating characteristics (ROC) curve of joint index and obstruction occurrence.
The currently recommended cut-off values (R ≥ 8, K ≥ 3, MA ≤ 51, or ANGLE ≤ 55) were modestly predictive of hemorrhagic events (). K and MA showed high specificity (93.7% and 94.6%, respectively), but the corresponding sensitivities were rather low (only 8% and 20%, respectively). For R and ANGLE, the sensitivities were 36% and 84%, while specificities were 77% and 26.7%, respectively.
Table 4 Predicting hemorrhage in elderly population using ROC curves and currently adopted cutoff values for different TEG indices
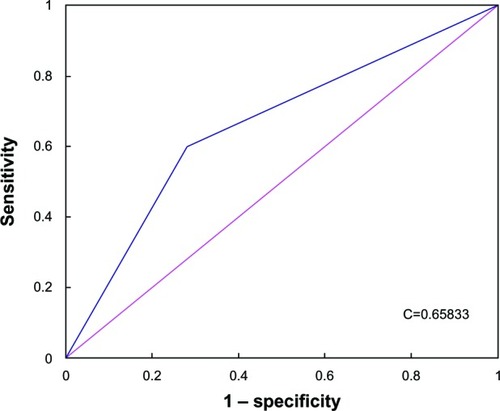
The optimal cut-off values for different TEG indices for predicting hemorrhage in elderly population based on the maximal Youden’s indices were R = 7.8, K = 2.3, MA = 50.5, ANGLE = 53.7 (). When these optimal cut-off values were used, the areas under the ROC curves were also statistically different, but only modestly improved (areas under ROC curves 0.57, 0.56, 0.58 and 0.55 for R, K, MA and ANGLE, respectively) the predictive values for hemorrhage were in the order of MA > R > K > ANGLE. Compared to the corresponding current cut-off values, there were no significant improvements in the predictive values for the TEG indices, with the exception K. Analysis of different serial and parallel combinations of indices showed that a joint index combining R and MA in parallel resulted in optimal predictive value (; area under ROC was 0.66, sensitivity 60%, specificity 71.7%, positive predictive value 15%, and negative predictive value 95.6%).
Table 5 Predicting hemorrhage in elderly population using ROC curves and optimal cutoff values for different TEG indices
Figure 2 Receiver-operating characteristics (ROC) curve of joint index and hemorrhage occurrence.
Multi-factor analysis
With sex, age, long-term bed rest, treatment with anticoagulation drugs, history of obstructive diseases, R ≤ 7.0, K ≤ 1.5, MA ≥ 63.5, and ANGLE ≥ 67.1 as the independent variables, and vascular obstruction as the dependent variable, using multivariate Cox regression controlling for potential confounders, long-term bed rest, history of obstructive diseases, and MA ≥ 63.5 were significantly associated with vascular obstruction. MA ≥ 63.5 was an independent predictor of vascular obstruction (). In similar analysis, long-term bed rest, R ≥ 7.8, and MA ≤ 50.5 were significantly associated with hemorrhage, and R ≥ 7.8 and MA ≤ 50.5 were independent predictors of hemorrhage ().
Table 6 Multi-factor Cox regression analysis on predicting obstruction occurrence
Table 7 Multi-factor Cox regression analysis on predicting hemorrhage occurrence
Discussion
In this 2-year follow-up investigation of 403 elderly patients, we explored the value of TEG indices for predicting hemorrhage and vascular obstruction. The results show that currently adopted cut-off values are poorly predictive of hemorrhage and obstruction in elderly population. Optimal cut-off values for each TEG index determined by ROC curve analysis exhibit improved, but only with modest predictive value compared to currently cut-off values. A combination of TEG indices also improved prediction.
A number of studies have demonstrated the value of TEG for predicting deep vein thrombosis, pulmonary embolism, myocardial infarction, and other diseases. In these studies, commonly used TEG index for evaluating the risk of obstruction was MA. MA is the maximum amplitude in TEG, and reflects the strength of blood clots. Cotton et alCitation10 used TEG to evaluate the risk of pulmonary embolism among 2,070 hospitalized patients with severe trauma, and showed that MA could be used to identify severe trauma patients of high risk for pulmonary embolism: when MA > 65 mm, the sensitivity of predicting pulmonary embolism was 82% and specificity 53%; when MA > 72 mm, the sensitivity of predicting pulmonary embolism was 49% and specificity 87%. McCrath et alCitation7 used TEG to evaluate occurrence of postoperative obstruction in 240 patients who received non-cardiac surgical treatment, and found that MA > 68 mm was significantly correlated with occurrence of postoperative obstruction, the sensitivity of predicting postoperative obstruction being 80% and specificity being 62%.
We found that the current cut-off value for MA of ≥69 mm had a sensitivity of only 14.1% and specificity 94% (area under ROC curve of 0.54). When the optimal cut-off value for MA determined by ROC curve analysis was used, the sensitivity of MA ≥ 63.5 mm in predicting obstruction was found to be 47.4% and specificity 75% (area under ROC curve 0.58). The optimal cut-off value for MA determined in the present study is lower than that used in previous studies conducted on patients who received surgical treatment. This suggests that in elderly populations, the threshold used for diagnosis may be lower than in younger populations. The current cut-off values for R and ANGLE were poor predictors of vascular obstruction. Yet with optimal cut-off values for R and ANGLE, improved prediction was achieved. In addition, the predictive value of the joint indices was superior to any single index alone, with a sensitivity of 85.9%, specificity 34.7%, and area under the ROC curve of 0.61. This suggests that in future studies, different TEG indices should be considered together.
The value of TEG in predicting hemorrhage has also been demonstrated in previous studies. Cammerer et alCitation15 studied postoperative hemorrhage in 255 patients who received cardiac surgery, and showed that TEG index ANGLE was a rather good predictive factor; when ANGLE = 71° was used as the cut-off value, AUC of ROC was 0.69, sensitivity 59.4%, and specificity 68.8%. Han et alCitation17 used TEG to predict gastrointestinal hemorrhage in 118 patients with liver diseases, and reported that TEG index ANGLE was able to predict the risk of short-term gastrointestinal hemorrhage in patients with liver diseases rather accurately; the cut-off value was 44.6, and at ANGLE less than 44.6, sensitivity of predicting short-term gastrointestinal hemorrhage in patients with liver diseases was 86.67% and specificity 67.96%.
In the present study, we found that the current cut-off value for ANGLE (55) was modestly predictive of hemorrhage (sensitivity 84%, and specificity 26.7%). Prediction was only modestly improved using the newly determine optimal cut-off values (sensitivity 92%, and specificity 24%). A joint index that combined R and MA in parallel showed optimal predictive value for hemorrhage and was superior to any single TEG index alone.
Multi-factor Cox regression analysis showed that long-term bed rest, history of obstructive diseases and MA ≥ 63.5 were significantly independent predictors of obstruction, while long-term bed rest, R ≥ 7.8 and MA ≤ 50.5 were significant predictors of hemorrhage. Liu et alCitation18 compared hemorheology and coagulation indices of 86 long-term bedridden patients and that of 172 healthy controls, and found that hemorheology index values of long-term bedridden patients were significantly higher than that of healthy control; the coagulation index values were also significantly different between the two groups. They proposed that this was because prolonged bed rest may cause impairment to microcirculation of blood, resulting in a hypercoagulable state, inducing and aggravating venous thrombosis and other vascular diseases. We found that long-term bed rest increased the risk of vascular obstruction over 4-fold and hemorrhagic events over 37-fold.
There are limitations to our study. Firstly, as this is a medical record database study, although we have tried our best to collect the comprehensive data available for us, it is possible that some potential variables have been neglected. Another limitation is that this study was conducted in one hospital with the sample size of 403 subjects. Our conclusion should be tested in future multicenter, prospective, longitudinal studies. The third and last limitation is the relatively short-term follow-up period. Within the short study period, we were unable to ascertain having collected all relevant adverse events, since 74.4% of the patients did not reach their end points.
In conclusion, current cut-off values for TEG indices are poorly and modestly predictive of hemorrhage and obstruction, respectively, in the elderly population. Optimal cut-off values determined by ROC curve analysis improved the prediction of vascular obstruction and hemorrhage.
Disclosure
The authors report no conflicts of interest in this work.
References
- TaoGSEvidence-based use of aspirin to prevent cardiovascular and cerebrovascular diseasesHealth Care2006111819
- WangLKongLWuFBaiYBurtonRPreventing chronic diseases in ChinaLancet200536694991821182416298221
- WenLSCorrect understanding and rational use of aspirin to prevent thrombotic diseasesModern Preventive Medicine2007341426622663 Chinese
- LongSBBlahaMJBlumenthalRSMichosEDClinical utility of rosuvastatin and other statins for cardiovascular risk reduction among the elderlyClin Interv Aging20116273521472089
- ReikvamHSteienEHaugeBThrombelastographyTransfus Apher Sci200940211912319249246
- MallettSVCoxDJThrombelastographyBr J Anaesth19926933073131389849
- McCrathDJCerboniEFrumentoRJHirshALBennett-GuerreroEThromboelastography maximum amplitude predicts postoperative thrombotic complications including myocardial infarctionAnesth Analg200510061576158315920177
- CapriniJAArcelusJILaubachMPostoperative hypercoagulability and deep-vein thrombosis after laparoscopic cholecystectomySurg Endosc1995933043097597604
- WilsonDCookeEAMcNallyMAWilsonHKYeatesAMollanRAChanges in coagulability as measured by thrombelastography following surgery for proximal femoral fractureInjury2001321076577011754883
- CottonBAMineiKMRadwanZAAdmission rapid thrombe-lastography predicts development of pulmonary embolism in trauma patientsJ Trauma Acute Care Surg201272614701475 discussion 1475–147722695409
- SchreiberMADifferdingJThorborgPMayberryJCMullinsRJHypercoagulability is most prevalent early after injury and in female patientsJ Trauma2005583475480 discussion 480–48115761339
- KashukJLMooreEESabelARapid thrombelastography (r-TEG) identifies hypercoagulability and predicts thromboembolic events in surgical patientsSurgery20091464764772 discussion 772–77419789037
- TumanKJMcCarthyRJMarchRJDeLariaGAPatelRVIvankovichADEffects of epidural anesthesia and analgesia on coagulation and outcome after major vascular surgeryAnesth Analg19917366967041952169
- TraversoCIArcelusJIGomezEProspective assessment of the risk of deep vein thrombosis in elective abdominal surgery: predictive role of thromboelastographyThromb Haemarrh Disorders199371915
- CammererUDietrichWRampfTBraunSLRichterJAThe predictive value of modified computerized thromboelastography and platelet function analysis for postoperative blood loss in routine cardiac surgeryAnesth Analg20039615157 table of contents12505922
- TEG 5000 Hemostasis Analyzer System [Package insert]Braintree, MAHaemoscope Corp2009
- HanXDHuangXYWangFThe study on the value of thrombe-lastogram predict hemorrhage short term alimentary tract hemorrhage in patients with hepatopathChinese Journal of Clinical Gastroenterology2010223131134 Chinese
- LiuBCTangHYuXHThe study of coagulation in patients with long-term bedridden status and blood rheologyChinese Journal of Difficult and Complicated Cases2012113199201 Chinese