
Abstract
Objective
Multimorbidity (MM) is more prevalent among people of lower socioeconomic status (SES), and both MM and SES are associated with higher mortality rates. However, little is known about the relationship between SES, MM, and mortality. This study investigates the association between educational level and mortality, and to what extent MM modifies this association.
Methods
We followed 239,547 individuals invited to participate in the Danish National Health Survey 2010 (mean follow-up time: 3.8 years). MM was assessed by using information on drug prescriptions and diagnoses for 39 long-term conditions. Data on educational level were provided by Statistics Denmark. Date of death was obtained from the Civil Registration System. Information on lifestyle factors and quality of life was collected from the survey. The main outcomes were overall and premature mortality (death before the age of 75).
Results
Of a total of 12,480 deaths, 6,607 (9.5%) were of people with low educational level (LEL) and 1,272 (2.3%) were of people with high educational level (HEL). The mortality rate was higher among people with LEL compared with HEL in groups of people with 0–1 disease (hazard ratio: 2.26, 95% confidence interval: 2.00–2.55) and ≥4 diseases (hazard ratio: 1.14, 95% confidence interval: 1.04–1.24), respectively (adjusted model). The absolute number of deaths was six times higher among people with LEL than those with HEL in those with ≥4 diseases. The 1-year cumulative mortality proportions for overall death in those with ≥4 diseases was 5.59% for people with HEL versus 7.27% for people with LEL, and 1-year cumulative mortality proportions for premature death was 2.93% for people with HEL versus 4.04% for people with LEL. Adjusting for potential mediating factors such as lifestyle and quality of life eliminated the statistical association between educational level and mortality in people with MM.
Conclusion
Our study suggests that LEL is associated with higher overall and premature mortality and that the association is affected by MM, lifestyle factors, and quality of life.
Introduction
The pattern of health challenges has changed over the recent decades. Chronic diseases now account for majority of deaths in developed countries.Citation1 The rising prevalence of multiple chronic diseases in an increasingly aging populationCitation2,Citation3 poses considerable challenges in the highly specialized health care systems, which primarily focus on treating single diseases.Citation4–Citation6 MM is associated with several adverse health outcomes, including high health care utilization,Citation7 unplanned hospital admission,Citation8 lower quality of life,Citation9–Citation13 mental health disorders,Citation14 lower functional level,Citation15–Citation17 higher prevalence of pain,Citation18 and higher mortality rates.Citation19–Citation21
Several cross-sectional studies have reported that the prevalence of MM is socially patterned. This has been shown by using various deprivation indices as proxies for socioeconomic status (SES).Citation22–Citation24 Barnett et al found that MM occurs 10–15 years earlier in people living in deprived areas of Scotland compared with affluent areas. Socioeconomic deprivation is particularly associated with MM involving mental health disorders.Citation14 Other studies have investigated educational level as a risk factor for developing long-term disease, and these have confirmed that MM is more common among people with low SES.Citation25–Citation28
It is well established in many European countries that people with low educational level (LEL) (as a measure for SES) have higher mortality than those with high educational level (HEL). This difference illustrates the considerable inequalities in health.Citation29–Citation32 As knowledge on the association between educational level, MM, and mortality is limited, prospective studies are warranted on the impact of SES on the long-term survival in people with MM.Citation33
The objective of this study was to examine the impact of educational level on all-cause mortality when taking MM status into account. Poor lifestyle choices are known to be associated with MM,Citation34 low SES,Citation35 and high mortality.Citation36 This underlines the importance of including relevant lifestyle factors when answering the research question. We used a large population-based cohort comprising a representative sample of the Danish population to compare information on socioeconomic factors, morbidity burden, and specific lifestyle factors. A 4-year follow-up study was conducted, and additionally, lifestyle was further investigated for a subgroup. We hypothesized that low SES, chronic disease burden, and poor lifestyle choices would interact and contribute to an impaired prognosis in people with MM.
Methods
Study design
This nationwide population-based cohort study with prospectively recorded data was conducted using information on people who were invited to participate in the Danish National Health Survey 2010.Citation37 The survey population consisted of a random nationally representative sample of all Danish citizens from each of the five Danish regions and an additional national sample invited by the National Institute of Public Health. Information collected through a paper- and web-based survey questionnaire was linked to nationwide health registries at the personal level by using the unique 10-digit civil personal registration (CPR) number assigned to all Danish residents upon birth or immigration.Citation38 Register data were collected prospectively. All participants entered the study on May 1, 2010 (baseline), at which time all questionnaires were collected. They were followed until death or emigration, or at the endpoint of the study (March 2014, 29), whichever came first.
Study population
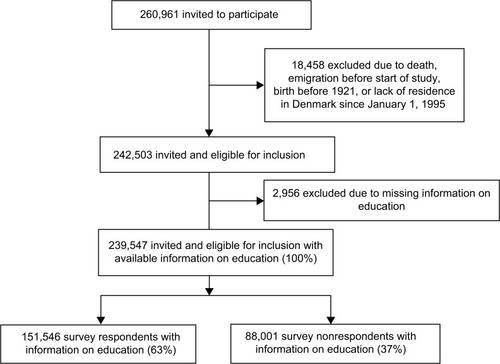
We included all people who were invited to participate in the survey. Inclusion criteria were 25–89 years of age at baseline and residing in Denmark since January 1, 1995, to ensure the most complete register information. Participants with missing information on educational level (n=2,956) were excluded from the analyses. The study population (n=239,547) was subsequently divided into two sub-cohorts: survey respondents and nonrespondents, () leaving us with three cohorts; two sub-cohorts contained within the study population cohort.
Figure 1 Flowchart of participants.
Exposure
MM status
The study population was categorized with MM if they had two or more of the selected 39 long-term conditions, which have previously been defined and used in Danish cohortsCitation39 based on recommendations in systematic reviews.Citation40,Citation41 The conditions were identified by combining data from the Danish National Patient Register,Citation42 the Danish Cancer Register,Citation43 the Danish Diabetes Register,Citation44 the Danish Psychiatric Central Register,Citation45 and the Danish National Prescription RegistryCitation46 from 1995 up until the baseline of study. Conditions were considered to be either physical or mental.Citation39 We divided the study population into three MM groups, which included both physical and mental conditions, at baseline: no (zero to one condition), moderate (two to three conditions), and severe MM (four or more conditions).
Educational level
Data on educational level were collected from Statistics DenmarkCitation47,Citation48 at the baseline of the study. Educational level was categorized according to United Nations Educational, Scientific and Cultural Organization’s International Standard Classification of Education.Citation49 Based on information on the highest degree attained, the study population was divided into three groups according to years of schoolingCitation50: 1) LEL: ≤10 years (e.g., no formal education, elementary school), 2) medium educational level (MEL): >10 and ≤15 years (e.g., high school), and 3) HEL: >15 years (e.g., primary school teacher, journalist, physiotherapist, or physician).
Outcome
Information on death
The primary outcome was all-cause mortality. Information on death was obtained from the Danish Civil Registration System,Citation38 which holds continuously updated information on vital status. Information on death is updated on a daily basis. In a sensitivity analysis, we investigated premature mortality defined as death before the age of 75 years.
Covariates
Self-reported covariates
Self-reported baseline characteristics were obtained on the sub-cohort of respondents from the Danish National Health Survey (). We included information on lifestyle factors in groupings: physical activity (light or no physical activity, moderate physical activity of ≥4 h/week, and hard physical activity of ≥4 h/week), alcohol habits (<7/<14, 7–14/14–21, and >14/>21 units per week for females/males), smoking status (never, former, and current), body mass index (underweight, i.e., <18 kg; normal weight, i.e., 18–25 kg; overweight, i.e., 25–30 kg; or obese, i.e., >30 kg), ethnicity (Danish, other western background, or other), and self-rated physical and quality of life (measured by the Short-Form Health Survey (SF-12)Citation51 by scores 0–100, with 100 being the best possible state of health).
Other covariates
From the Danish Civil Registration System,Citation38 we obtained individual information on gender, date of birth, and civil status (cohabiting or single). The data were fully anonymized.
The study did not need approval from the regional ethics committee, but it was approved by the Danish Data Protection Agency (file number 2013–41-1719).
Statistical analysis
The demographic characteristics of both study cohort and respondent cohort according to educational level were evaluated at baseline.
Hazard ratios (HRs) of all-cause mortality with 95% confidence intervals (95% CIs) were calculated using a Cox proportional hazards model with age as the timescale. We checked the proportional hazards assumption using log (−log[survival]) plots, and we saw no violations.
We developed four adjustment models. In the crude model (M1), we included the intrinsic correction for age used as timescale. In the second model (M2), we further adjusted for sex and cohabitation status. In the third model (M3), we additionally adjusted for all physical and mental conditions from the registers in the form of 39 dummy variables to account for the differences in influence on mortality caused by each condition. In a fourth model (M4), which was only applied to the respondent cohort, we further adjusted for self-reported lifestyle factors and quality of life (SF-12). In the last model, we imputed missing survey data on lifestyle and socioeconomic factors in a chained equations model. This is a method based on sequential multivariate regressions on missing parameters that allows us to impute multiple variables. We included all our analysis parameters, outcome variable, and time variable in the imputation model. Ordinal logistic regression was used for categorical variables and predictive mean matching for the SF-12 variables. We estimated that 20 imputation sets would be sufficient according to guidelines, and the resulting estimates were combined using Rubin’s rules. Multiple imputation operates under the assumption that given the variables used in the imputation procedure, the missing data are missing at random, which means that the probability that a value is missing depends only on observed values and not on unobserved values.Citation52,Citation53
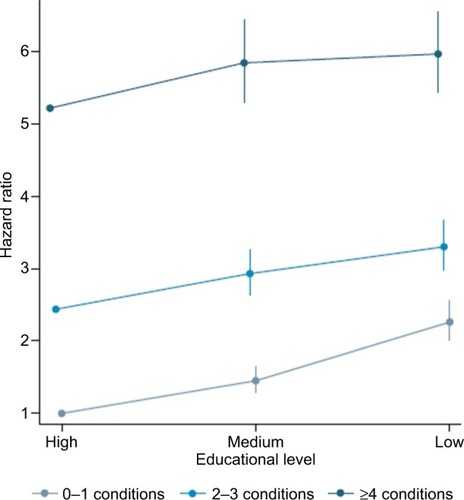
The association between educational level and mortality was examined by setting the highest educational level as reference and applying M1, M2, and M3. The association between MM and mortality was examined by setting “0–1 condition” as reference and applying M1 and M2. We then examined the association between educational level and mortality across MM groups by using M1, M2, and M3, and additionally applying M4 for survey respondents. Effect modification was assessed by testing for multiplicative interaction using a likelihood ratio test. The point estimates and the corresponding 95% CIs were presented graphically; point estimates for educational level were adjusted using M3 and calculated for each MM group, and the ratios between the MM groups were adjusted using M2 and scaled by risk-time-weighted average HRs within each MM group using the non-MM group as the reference group. This scaling was done to reflect the actual observed differences in condition status between MM groups ().
Figure 2 Association between educational level, multimorbidity group, and mortality hazard ratio.
Using a standard Kaplan–Meier approach, we calculated the cumulative mortality proportion (CIP) for death after 1year in all combinations of educational level across each MM group (CIP after 1 year [CIP]1y). To assess the magnitude of educational level across MM groups in absolute numbers, we multiplied the CIP1y with the adjusted attributable fraction (HR-1)/HR and yielded the excess CIP1y.Citation54
Multiple sensitivity analyses were performed. In one sensitivity analysis, we examined the effect of educational level on premature mortality across MM groups. In this analysis, individuals were censored at the time of their 75th birthday; once a person turned 75, he/she was no longer at risk of dying prematurely, that is, turning 75 years old is a competing risk of dying prematurely. As a consequence of this, the CIP1y was estimated using a competing risk method in this sensitivity analysis.Citation55,Citation56 As in the main analysis, HRs were calculated using a standard Cox proportional hazards model with age as the timescale.
In another analysis, we excluded people <35 years at baseline to test the hypothesis on a cohort who more certainly had completed their education.
We also examined whether the effect of educational level across MM groups in the entire cohort differed by sex and age registered using stratified analyses. A likelihood ratio test was applied to test for multiplicative interaction across the different strata.
Respondent and nonrespondents were compared regarding demographic characteristics and mortality. The effect of educational level across MM groups was examined and compared between respondents and nonrespondents by using M3.
All analyses were performed using Stata 13 (Stata Corporation, College Station, TX, USA).
Results
We followed 239,547 individuals invited to participate in the Danish National Health Survey 2010 for a total of 910,400 person-years at risk (mean follow-up time: 3.8 years; ). In the study cohort, 29% had LEL, 48% had MEL, and 23% had HEL at baseline. LEL was more common among participants, who were elderly and single, had ≥4 diseases, and had a psychiatric condition ().
Table 1 Baseline characteristics according to educational level (entire study population)
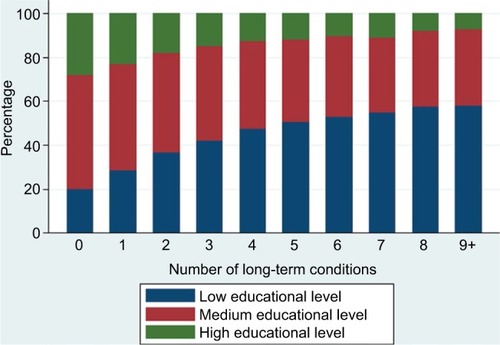
The absolute number of long-term conditions increased with decreasing educational level ().
Figure 3 The distribution of educational level relative to the number of long-term conditions.
Association between educational level and mortality across MM groups
We identified 12,480 deaths, of which 9,742 (78%) were among people with MM. Among people with LEL 6,607 people (9.5%) died, among people with MEL 4,601 (4.0%) died, and among people with HEL 1,272 (2.3%) died during follow-up.
The mortality increased with decreasing educational level and with increasing number of underlying diseases. The association between educational level and mortality measured on the relative scale (HRs) attenuated with increasing level of MM; the P-value for interaction was <0.001 (). The mortality rate was 126% higher among people with LEL compared with those with HEL in the group of people with 0–1 conditions (HR: 2.26, 95% CI: 2.00–2.55), whereas the corresponding estimates were 14% higher among people with ≥4 diseases (HR: 1.14, 95% CI: 1.04–1.24) after adjusting for age, sex, cohabitation status, and the 39 conditions (M3). However, the absolute number of deaths was higher among people with LEL than those with HEL in all MM groups; for those with 0–1 conditions, 335 persons (0.8%) with HEL died versus 1,293 (3.4%) persons with LEL. For those with ≥4 diseases, 514 persons (18.3%) with HEL died (CIP1y: 5.59%) versus 3,245 persons (25.9%) with LEL (CIP1y: 7.27%; ).
Figure 4 Cumulative incidence proportions of death at 1 year across educational levels and multimorbidity group.
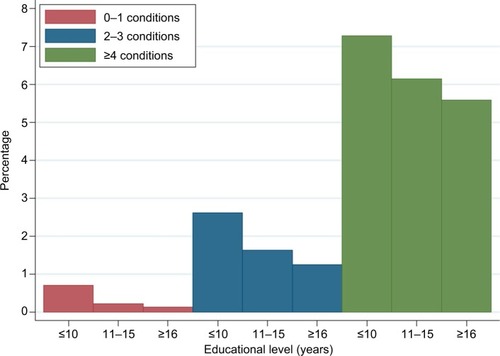
Table 2 Mortality HRs for educational level across multimorbidity groups (entire study population)
Theoretically, had those with LEL had the same risk of dying as those with HEL, 0.40% of people with LEL would not have died in the group of people with 0–1 diseases and 0.89% in the group of people with ≥4 diseases ().
shows that the background mortality was highest for people with severe MM and the association for education levels off with increasing morbidity.
Association between educational level and premature mortality across MM groups
We identified 5,170 premature deaths: 2,215 people (3.2%) with LEL died prematurely and 36% of them had ≥4 conditions; 596 people (1.1%) with HEL died prematurely and 30% of them had ≥4 conditions. In the group of people with ≥4 conditions, the overall mortality was 14% higher for people LEL compared with people with HEL (HR: 1.14, 95% CI: 1.04–1.24), whereas the corresponding estimates for premature mortality as outcome was 40% (HR: 1.40, 95% CI: 1.17–1.67) after adjusting for age, sex, cohabitation status, and the 39 conditions (M3). The absolute number of premature deaths was higher among people with LEL than those with HEL in all MM groups: for those with ≥4 diseases, 147 persons with HEL died (CIP1y: 2.99%) versus 803 persons with LEL (CIP1y: 4.17%). Theoretically, if those with LEL had the same risk of dying as those with HEL, 0.24% of the people with LEL would not have died in the group of people with 0–1 conditions and 1.15% with LEL in the group of people with ≥4 diseases (). Among people with LEL, 2,214 (3.2%) died prematurely during follow-up and 36% of them had severe MM. Among people with HEL, 596 (1.1%) died prematurely during follow-up and 25% of them had severe MM.
Table 3 Premature mortality HRs for educational level across multimorbidity groups (full study population)
Subanalyses
Effect modification by age and sex
We found that the association between educational level and mortality across MM groups decreased slightly with increasing age (Table S1). The association was similar for men and women (Table S2)
Lifestyle and quality of life in survey respondents
We performed a subgroup analysis of the survey respondent group with self-reported data on lifestyle and quality of life SF-12 (; Table S3). We followed this cohort for a total of 580,646 person-years at risk (mean follow-up time: 3.8 years) and identified 5,875 deaths of which 4,573 (78%) occurred in people with MM and 2,789 (47%) occurred in people with LEL.
The association between educational level and mortality disappeared for people with MM when we adjusted for lifestyle factors and SF-12 (Table S4).
Comparison of respondent and nonrespondent cohorts
The response rate in the survey was 63%. Nonrespondents were more likely to be male, single, aged 25–45 years or ≥75 years, to have multiple diseases, lower educational level (Table S5), and higher mortality than respondents (Table S6). However, the association between educational level and mortality was remarkably similar for respondents and non-respondents in most strata of MM (Table S7).
The results were consistent with our main findings when we excluded participants under the age of 35 years (data not shown).
Discussion
In this population-based cohort study, we confirmed that both LEL and MM were associated with higher overall mortality.Citation19,Citation57 Further, our findings suggested that the relative risk of overall and premature mortality for people with LEL compared with HEL decreased with increasing number of underlying chronic conditions.
However, the absolute number of both overall and premature deaths was higher among people with LEL than those with HEL in all MM groups and the highest proportion of deaths that theoretically could have been avoided, given people with LEL had the same mortality as those with HEL, was found in the group of people with ≥4 diseases: both for overall and premature mortality. Among people with LEL, 36% of those who died prematurely had severe MM, indicating that the association between LEL and higher overall and premature mortality could be driven by MM. In other words, the findings indicate that the relative effect on death decreases the more diseases you suffer from, because the diseases have a direct effect on mortality as seen from the absolute numbers.
Adjusting for lifestyle factors and quality of life (SF-12) eliminated the statistical association between educational level and mortality in people with MM.
Strength and limitations
We followed a large and representative sample of the Danish populationCitation37 for up to 4 years with virtually no loss to follow-up. The survey response rate was 63%. Even though the respondent group differed from the nonrespondent group on a range of baseline characteristics, the association between educational level, MM, and mortality was still remarkably similar in the two groups. This finding speaks against selection problems.
The use of national registers with prospectively recorded data ensured highly valid and complete data on deaths, educational level, and baseline socioeconomic factors.Citation58 The MM groups were established by an algorithm combining information from Danish national registries with secondary care diagnosis and drug prescriptions on an individual level. The algorithm has been described in detail in a previous study of a similar cohort.Citation39 We obtained information on educational level at baseline for 98.8% of the participants. People with missing data on educational level were equally distributed across gender, age, and MM groups, and we have no reason to believe that the association between educational level and mortality was biased by this approach to missing data. In a subgroup analysis of survey respondents, we further controlled for lifestyle factors and self-rated health. Adverse lifestyle is a well-known prognostic factor for MM and SF-12 can be seen as a proxy for disease severity. The sample size of the study cohort allowed us to investigate mortality at several levels of education and MM and to adjust for many potential confounders. The differences in group sizes reflect the target population, and both our relative and absolute statistical estimates take this into account. Owing to our large study sample, there was sufficient number of events to estimate the effect with each group.
An established definition of SES does not exist in the literature. Krieger et al have described socioeconomic position as referring to the social and economic factors that influence the type of positions that individuals or groups may hold within the structure of a society.Citation59 Galobardes et al state that there is no single best indicator of SES that is both suitable for all study aims and yet applicable at all time points in all settings.Citation60 In our study, we chose years of schooling as the measure of SES and categorized people into three groups. Education as a proxy for SES is historically founded in Weber’s theory of a status domain.Citation61 Educational level captures both the transition from parents’ SES to own adulthood SES and serves as a determinant for future employment and income.Citation62 Additionally, educational level may express a person’s ability to navigate in the health care system; it is fixed early in adult life and reported consistently.Citation54
Compared to income as a marker of SES, educational level is less volatile, less affected by changes in health status that could impair work capacity, and more stable regarding different use of public benefits such as state educational grants and postemployment benefits.
One important limitation in our study was that the understanding of educational level varies among birth cohorts because considerable changes in educational opportunities have been seen over the recent decades. Hence, a majority of the low educated was found in the older birth cohorts. We addressed this challenge by choosing age as the time-scale and letting all individuals enter the study at the same date. Additionally, we performed a stratified analysis after dividing the study population into two age groups of equal size. Another limitation was that we obtained no information about type of education when using years of schooling as SES measure. Furthermore, educational level does not measure human or social capital. The relationship between health and education is complex because formal education is a dynamic process that provides people with multiple resources. Data on educational level from Statistics Denmark were collected prospectively and are regarded as valid.Citation47
In the literature, no standard method of measuring MM exists. Consensus is lacking on which conditions to include, how to define the conditions, and whether or not to weight the measure.Citation40 The MM status in our study was based on clinically acknowledged conditions from all Danish hospitals and outpatient clinics, including recommended key diseases.Citation63 In order to capture common diseases treated in primary care, our algorithm also included redeemed drug prescriptions from all Danish pharmacies. This approach was taken because primary care diagnoses were not available. Several studies on MM use simple disease count models to describe the MM burden.Citation41 We weigh the diseases by adjusting for each disease as a dummy variable within each MM stratum; this allows the MM groups to have a different impact on the education level categories due to different combinations of the diseases within each educational level. By doing this, we reduce the residual confounding that may emerge from associating LEL with more severe disease. Yet, we could not account for untreated primary care conditions and the duration or severity of each condition. If people with LEL have an earlier onset of some diseases and more severe states of individual diseases, confounding of the results may occur. We considered people with no chronic diseases and people with one chronic disease as one group. When stratifying on no and one chronic disease, the estimates were not clinically significantly different from each other (data not shown).
In our study, we were able to control for a wide range of potential confounders at the individual level. We were able to adjust for lifestyle factors and quality of life in the survey respondent cohort. We were not able to include information on nutrition that could be a confounder for the association. However, we have adjusted for BMI and other lifestyle factors associated with nutrition. Consequently, the association between educational level and mortality disappeared; this indicates that confounding from these factors may play a role. However, we cannot rule out that some of the factors that we adjusted for are intermediate variables; LEL may lead to an unhealthy lifestyle, which again could lead to higher mortality. If so, adjustment for lifestyle factors could result in underestimation of the true association between educational level and mortality.Citation54 Even though our study includes many potential confounders, we acknowledge that observational studies may be subject to residual confounding. However, from this finding, it can be discussed how resources should be used. Maybe it would be more reasonable to focus on people having an adverse lifestyle who are at greater risk of developing MM than those who are already multimorbid in order to influence mortality.
Comparison with other studies
In line with the findings from cross-sectional studies in other countries, we found that MM was associated with LEL.Citation64 Our study suggests that the impact of this social determinant on prognosis diminished for people diagnosed with multiple chronic conditions. This finding is consistent with a newly published study from Ontario, Canada,Citation65 in which the effect of increasing chronic condition burden on mortality was shown to be similar across neighborhood income quintiles among older people. However, in our study, we were able to look at SES at the individual level across all age groups for 39 long-term conditions. In another study from the UK, the researchers found that the relative socioeconomic inequalities in mortality were smaller at higher levels of morbidity.Citation66 They used deprivation categories and included only four chronic diseases. Many studies have investigated the individual impact of educational level and MM on mortality. Yet, as far as we know, our study is the first to contribute with knowledge about the impact of individual educational level on mortality for people with and without MM in a setting with universal health care.
The Danish health care system is predominantly financed through income tax, and universal care is available to all Danish residents. The associations found in our study could possibly be stronger in countries without universal health care or free education.
Conclusion and implications
Our study suggests that educational level is an important prognostic factor for all-cause mortality and premature mortality. The findings also indicate that this association is modified by level of MM and confounded or modified by lifestyle factors and quality of life. However, the increase in absolute number of deaths for people with LEL compared with people with HEL was greatest in the group of people with severe MM. These findings suggest that both educational level and lifestyle factors must be taken into account when treating people with MM in order to reduce the socioeconomic inequalities in mortality. Increased focus should be directed toward preventing early development of long-term conditions, especially in people with low SES.
Disclosure
The authors report no conflicts of interest in this work.
References
- LopezADMathersCDMeasuring the global burden of disease and epidemiological transitions: 2002–2030Ann Trop Med Parasitol20061005–648149916899150
- FortinMBravoGHudonCVanasseALapointeLPrevalence of multimorbidity among adults seen in family practiceAnn Fam Med20053322322815928225
- UijenAAvan de LisdonkEHMultimorbidity in primary care: prevalence and trend over the last 20 yearsEur J Gen Pract200814Suppl 1283218949641
- MercerSWGunnJBowerPWykeSGuthrieBManaging patients with mental and physical multimorbidityBMJ2012345e555922945951
- CottrellEYardleySLived experiences of multimorbidity: an interpretative meta-synthesis of patients’, general practitioners’ and trainees’ perceptionsChronic Illn201511427930325770097
- SalisburyCMultimorbidity: redesigning health care for people who use itLancet201238098367922579042
- WolffJLStarfieldBAndersonGPrevalence, expenditures, and complications of multiple chronic conditions in the elderlyArch Intern Med2002162202269227612418941
- PayneRAAbelGAGuthrieBMercerSWThe effect of physical multimorbidity, mental health conditions and socioeconomic deprivation on unplanned admissions to hospital: a retrospective cohort studyCMAJ20131855E221E22823422444
- ForjazMJRodriguez-BlazquezCAyalaAChronic conditions, disability, and quality of life in older adults with multimorbidity in SpainEur J Intern Med201526317618125724771
- Alonso-MoranENuno-SolinisROruetaJFFernandez-RuanovaBAlday-JuradoAGutierrez-FraileEHealth-related quality of life and multimorbidity in community-dwelling telecare-assisted elders in the Basque countryEur J Intern Med201526316917525704329
- FortinMDuboisMFHudonCSoubhiHAlmirallJMultimorbidity and quality of life: a closer lookHealth Qual Life Outcomes200755217683600
- FortinMBravoGHudonCRelationship between multimorbidity and health-related quality of life of patients in primary careQual Life Res2006151839116411033
- LawsonKDMercerSWWykeSDouble trouble: the impact of multimorbidity and deprivation on preference-weighted health related quality of life a cross sectional analysis of the Scottish health surveyInt J Equity Health2013126723962150
- BarnettKMercerSWNorburyMWattGWykeSGuthrieBEpidemiology of multimorbidity and implications for health care, research, and medical education: a cross-sectional studyLancet20123809836374322579043
- LiddyCBlazkhoVMillKChallenges of self-management when living with multiple chronic conditions: systematic review of the qualitative literatureCan Fam Physician201460121123113325642490
- AartsSden AkkerMBosmaHThe effect of multimorbidity on health related functioning: Temporary or persistent? Results from a longitudinal cohort studyJ Psychosom Res201273321121722850262
- WooJLeungJMulti-morbidity, dependency, and frailty singly or in combination have different impact on health outcomesAge (Dordr)201436292393124091565
- EckerbladJTheanderKEkdahlASymptom burden in community-dwelling older people with multimorbidity: a cross-sectional studyBMC Geriatr201515125559550
- KoroukianSMWarnerDFOwusuCGivenCWMultimorbidity redefined: prospective health outcomes and the cumulative effect of co-occurring conditionsPrev Chronic Dis201512E5525906436
- CaugheyGERamsayENVitryAIComorbid chronic diseases, discordant impact on mortality in older people: a 14-year longitudinal population studyJ Epidemiol Community Health201064121036104219854745
- MenottiAMulderINissinenAGiampaoliSFeskensEJKromhoutDPrevalence of morbidity and multimorbidity in elderly male populations and their impact on 10-year all-cause mortality: the FINE study (finland, italy, netherlands, elderly)J Clin Epidemiol200154768068611438408
- McLeanGGunnJWykeSThe influence of socioeconomic deprivation on multimorbidity at different ages: a cross-sectional studyBr J Gen Pract201464624e440e44724982497
- SalisburyCJohnsonLPurdySValderasJMMontgomeryAAEpidemiology and impact of multimorbidity in primary care: a retrospective cohort studyBr J Gen Pract201161582e122121401985
- ViolanCFoguet-BoreuQFlores-MateoGPrevalence, determinants and patterns of multimorbidity in primary care: a systematic review of observational studiesPLoS One201497e10214925048354
- SmithWCAndersonESalinasDHorvatekRBakerDPA meta-analysis of education effects on chronic disease: the causal dynamics of the population education transition curveSocSci Med20151272940
- AfsharSRoderickPJKowalPDimitrovBDHillAGMultimorbidity and the inequalities of global ageing: a cross-sectional study of 28 countries using the world health surveysBMC Public Health20151577626268536
- van den AkkerMBuntinxFMetsemakersJFRoosSKnottnerusJAMultimorbidity in general practice: prevalence, incidence, and determinants of co-occurring chronic and recurrent diseasesJ Clin Epidemiol19985153673759619963
- MarengoniAWinbladBKarpAFratiglioniLPrevalence of chronic diseases and multimorbidity among the elderly population in SwedenAm J Public Health20089871198120018511722
- MackenbachJPStirbuIRoskamAJEuropean Union Working Group on Socioeconomic Inequalities in HealthSocioeconomic inequalities in health in 22 European countriesN Engl J Med2008358232468248118525043
- MadsenMAndersenAMChristensenKAndersenPKOslerMDoes educational status impact adult mortality in Denmark? A twin approachAm J Epidemiol2010172222523420530466
- ShkolnikovVMAndreevEMJdanovDAIncreasing absolute mortality disparities by education in Finland, Norway and Sweden, 1971–2000J Epidemiol Community Health201266437237821282141
- MackenbachJPBosVAndersenOWidening socioeconomic inequalities in mortality in six western European countriesInt J Epidemiol200332583083714559760
- FranceEFWykeSGunnJMMairFSMcLeanGMercerSWMultimorbidity in primary care: a systematic review of prospective cohort studiesBr J Gen Pract201262597e297e30722520918
- FortinMHaggertyJAlmirallJBouhaliTSassevilleMLemieuxMLifestyle factors and multimorbidity: a cross sectional studyBMC Public Health20141468624996220
- VereeckenCAMaesLDe BacquerDThe influence of parental occupation and the pupils’ educational level on lifestyle behaviors among adolescents in BelgiumJ Adolesc Health200434433033815041003
- van DamRMLiTSpiegelmanDFrancoOHHuFBCombined impact of lifestyle factors on mortality: prospective cohort study in US womenBMJ2008337a144018796495
- ChristensenAIEkholmOGlumerCThe danish national health survey 2010. Study design and respondent characteristicsScand J Public Health201240439139722786925
- PedersenCBGotzscheHMollerJOMortensenPBThe danish civil registration system. A cohort of eight million personsDan Med Bull200653444144917150149
- PriorAFenger-GronMLarsenKKThe association between perceived stress and mortality among people with multimorbidity: a prospective population-based cohort studyAm J Epidemiol2016184319921027407085
- DiederichsCBergerKBartelsDBThe measurement of multiple chronic diseases–a systematic review on existing multimorbidity indicesJ Gerontol A BiolSci Med Sci2011663301311
- HuntleyALJohnsonRPurdySValderasJMSalisburyCMeasures of multimorbidity and morbidity burden for use in primary care and community settings: a systematic review and guideAnn Fam Med201210213414122412005
- AndersenTFMadsenMJorgensenJMellemkjoerLOlsenJHThe danish national hospital register. A valuable source of data for modern health sciencesDan Med Bull199946326326810421985
- GjerstorffMLThe danish cancer registryScand J Public Health2011397 Suppl424521775350
- CarstensenBKristensenJKMarcussenMMBorch-JohnsenKThe national diabetes registerScand J Public Health2011397 Suppl5861
- MorsOPertoGPMortensenPBThe danish psychiatric central research registerScand J Public Health2011397 Suppl545721775352
- KildemoesHWSorensenHTHallasJThe danish national prescription registryScand J Public Health2011397 Suppl384121775349
- JensenVMRasmussenAWDanish education registersScand J Public Health2011397 Suppl919421775362
- Statistics DenmarkHighest education attained Available from: http://www.dst.dk/en/Statistik/dokumentation/documentationofstatistics/highest-education-attainedAccessed April 24, 2017
- UNESCO Institute for StatisticsInternational Standard Classification of EducationISCED2011 Available from: http://www.uis.unesco.org/education/documents/isced-2011-en.pdfAccessed April 17, 2017
- Danish Ministry of Higher Education and ScienceThe Danish education system Available at: http://ufm.dk/en/education-and-institutions/the-danish-education-systemAccessed April 17, 2017
- WareJJrKosinskiMKellerSDA 12-item short-form health survey: construction of scales and preliminary tests of reliability and validityMed Care19963432202338628042
- WhiteIRRoystonPWoodAMMultiple imputation using chained equations: issues and guidance for practiceStat Med201130437739921225900
- SterneJAWhiteIRCarlinJBMultiple imputation for missing data in epidemiological and clinical research: potential and pitfallsBMJ2009338b239319564179
- RothmanKGreenlandSLashTLModern Epidemiology3rd edPhiladelphia, PALippincott, Williams & Wilkins2008
- AndersenPKGeskusRBde WitteTPutterHCompeting risks in epidemiology: possibilities and pitfallsInt J Epidemiol201241386187022253319
- KollerMTRaatzHSteyerbergEWWolbersMCompeting risks and the clinical community: irrelevance or ignorance?Stat Med20123111–121089109721953401
- OslerMPrescottEEducational level as a contextual and proximate determinant of all cause mortality in danish adultsJ Epidemiol Community Health200357426626912646542
- ErlangsenAFedyszynIDanish nationwide registers for public health and health-related researchScand J Public Health201543433333925759376
- KriegerNWilliamsDRMossNEMeasuring social class in US public health research: concepts, methodologies, and guidelinesAnnu Rev Public Health1997183413789143723
- GalobardesBShawMLawlorDALynchJWDavey SmithGIndicators of socioeconomic position (part 1)J Epidemiol Community Health2006601712
- LiberatosPLinkBGKelseyJLThe measurement of social class in epidemiologyEpidemiol Rev198810871213066632
- LynchJKGSocioeconomic positionBerkmanLFKawachiISocial Epidemiology1st edOxfordOxford university Press20001335
- HuntleyALJohnsonRPurdySValderasJMSalisburyCMeasures of multimorbidity and morbidity burden for use in primary care and community settings: a systematic review and guideAnn Fam Med201210213414122412005
- ViolanCFoguet-BoreuQFlores-MateoGPrevalence, determinants and patterns of multimorbidity in primary care: a systematic review of observational studiesPLoS One201497e10214925048354
- LaneNEMaxwellCJGruneirABronskillSEWodchisWPAbsence of a socioeconomic gradient in older adults’ survival with multiple chronic conditionsEBioMedicine20152122094210026844290
- CharltonJRudisillCBhattaraiNGullifordMImpact of deprivation on occurrence, outcomes and health care costs of people with multiple morbidityJ Health Serv Res Policy201318421522323945679