
Abstract
Population-based health care databases are a valuable tool for observational studies as they reflect daily medical practice for large and representative populations. A constant challenge in observational designs is, however, to rule out confounding, and the value of these databases for a given study question accordingly depends on completeness and validity of the information on confounding factors. In this article, we describe the types of potential confounding factors typically lacking in large health care databases and suggest strategies for confounding control when data on important confounders are unavailable. Using Danish health care databases as examples, we present the use of proxy measures for important confounders and the use of external adjustment. We also briefly discuss the potential value of active comparators, high-dimensional propensity scores, self-controlled designs, pseudorandomization, and the use of positive or negative controls.
Introduction
Observational studies based on large existing health care databases have a well-established role in clinical research. Nevertheless, there are controversies regarding the validity of observational studies based on such databases. Among limitations is the fact that the data collection methods are predetermined and not controlled by the researcher. Misclassification constitutes a frequent limitation of registry-based research. In addition, as with any type of nonrandomized epidemiological research, the absence of confounding cannot be assumed in studies of associations between a given exposure and a given outcome using large databases. The value of these population-based databases for interpreting observed associations as causal will therefore also depend on how effectively confounding can be controlled.
Confounding is the situation in which the difference in the risk of the outcome (or lack thereof) between exposed and unexposed can be explained entirely or partly by imbalance of other causes of the outcome in the contrasted groups.Citation1 Ideally, to directly observe a causal (ie, confounding-free) exposure–outcome relation, we would like to examine the occurrence of a given outcome in the same group of people over the same period of time under two contrasted exposure conditions. In reality, this is impossible, as for each person only the outcome under one exposure condition is observed; the outcome under the counterfactual exposure condition is not observed. Thus, one will need to find ways to control confounding or at least assess its potential impact.
When an exposure is allocated randomly, as in randomized controlled trials, any association between a given prognostic variable and the exposure will be random. Accordingly, if the trial is adequately powered and well designed, randomization will, on average, control both known (measured and unmeasured) and unmeasured confounders, be it that there is no guarantee of ideal balance in any single study.Citation2 Randomized trials often have narrow inclusion criteriaCitation3 and therefore tend to enroll a selection of patients with only one diagnosis, with no concomitant therapies, neither very young nor old, and with a reasonable prognosis.Citation4,Citation5 In contrast, large population-based health care databases reflect the entire daily clinical practice for large and representative populations. Yet, the ability of a given strategy to control confounding in studies based on these databases depends on completeness and validity of the recorded information on confounding factors.
The aims of this article are to describe the types of potential confounding factors about which data are not typically recorded in large medical databases and to present potential strategies for dealing with such confounding. Therefore, we will also briefly discuss self-controlled designs, the use of external adjustment, pseudorandomization, high-dimensional propensity scores, active comparators, and the use of positive or negative controls – all of which are attempts to overcome the potential lack of availability of information on confounding factors. We thereby intend to give a quick overview that can serve as a primer for clinicians.
Many of our examples stem from the use of Danish population-based health care databases. However, we think that similar concerns and similar solutions will exist in other databases in other countries. Database research is becoming increasingly important for clinical research worldwide. Denmark has the experience of a long tradition for establishing and maintaining population-based medical registries and databases. Possibility of linkage of these data sources using a 10-digit personal identification number (the civil personal register number), which follows each Dane from cradle to grave, creates a valuable tool for observational research, with an added benefit of the underlying universal access to health care, making selection bias negligible in many situations.Citation6
Which confounders are recorded?
Whether confounding is a potential threat to the validity in each specific observational study depends on the study question and the data availability, as most strategies to cope with potential confounding require that we are aware of the confounding variables and able to measure them ().
Table 1 Different types of confounders and potential solutions on how to control for these in observational studies based on health care databases
To obtain an overview of the potential confounders, a first and time-honored strategy is to start with a list of variables that are known causes of the outcome, based on our knowledge of the existing literature.Citation7 Next, we can remove the variables that are not associated with the exposure. We should also remove variables that are causes of the outcome but lie on the exposure–outcome causal pathway because it would be wrong to treat them as confounders.Citation1 Then, we can categorize the remaining potential confounders in our list into variables that are measured in the data and variables that are not measured but are measurable in a substudy or in another setting. Finally, we may have variables that are not measured and on which we have no information, as well as confounders that are unknown at present. In most straightforward studies of the effect of an exposure on an outcome, this strategy of selecting confounders will work well. In case the problem is more intricate, however, with complex exposures (eg, exposures that are strongly related to background social conditions) or in complex study situations (eg, repeated measurements and time dependency of exposures and confounders), a possibility is to use directed acyclic graphs (DAGs) to elicit potential causal pathways. An explanation of how to use DAGs is outside the scope of this article, but excellent introductions are widely available.Citation8,Citation9
For instance, if we want to examine the evolution of 30-day survival following a first myocardial infarction over several decades, the list of potential confounders could be short. It may be sufficient to take only sex and age into account, and these variables are easily accessible in all Danish registries.Citation10 If we are going to examine whether the use of statins protects against cerebral glioma, it may be necessary to adjust for several potential confounding factors, such as diabetes, a history of stroke, exposure to endogenous sex hormones, exposure to ionizing radiation, use of various drugs, and lifestyle factors and socioeconomic status.Citation11 In the latter case, not all potential confounders are available in most of the health care databases.
In administrative registries, such as the Danish National Patient Registry (DNPR), we have access to hospital diagnoses and proceduresCitation12 while data on lifestyle factors are sparse.Citation13 For example, information on smoking is usually not well recorded in all patient groups in the typical administrative health registries.Citation13 In some cases, a diagnosis of chronic obstructive lung disease (COPD) can be considered as a proxy measure of smoking. However, although a diagnosis of COPD may be a good marker of previous smoking, it may be an imprecise marker of current smoking status as most of the patients are encouraged to quit smoking when they receive COPD diagnosis.Citation14 Instead, we can consider retrieving information on smoking status from medical charts on a subpopulation or we can use information from, eg, health surveys on how smoking is likely distributed in the exposure groups and how strongly it is associated with the outcome. We can then take this information into account using external adjustment.Citation15
If the external information or information from a subgroup is not easily obtainable, sensitivity analysis might be helpful to assess the potential impact that an unmeasured confounder could have on the study. Svensson et alCitation16 used Danish registries to examine the association between vagotomy and subsequent risk of Parkinson’s disease. After 20 years of follow-up, the adjusted hazard ratio of Parkinson’s disease in vagotomized persons compared with the general population was 0.53 (95% CI, 0.28–0.99). Because smoking is associated with an increased risk of peptic ulcer (the underlying indication for vagotomy)Citation17 and, at the same time, may protect against Parkinson’s disease,Citation18 lack of data on smoking was of concern, as smoking, rather than vagotomy, could be behind the observed protective association. First, the authors considered using COPD as a proxy measure for smoking. Controlling for a diagnosis of COPD would, however, only to some degree control the effect of smoking, since the prevalence of COPD is much lower than the prevalence of smoking (2.4% of patients who underwent truncal vagotomy had a COPD diagnosis compared to 1.2% of the comparison cohort), suggesting that most of the confounding would remain uncontrolled. To address the potential residual confounding by smoking, the authors performed a sensitivity analysis for unmeasured confoundingCitation19 in which they assumed that the relative risk of Parkinson’s disease in smokers was 0.53 based on data from a US studyCitation20 and that the proportion of smokers in the unexposed cohort (ie, in the general population of Denmark) was 60% in the 1970s.Citation21 If 85% of the vagotomized patients were assumed to be smokers, the corrected adjusted hazard ratio was 0.66. This sensitivity analysis demonstrated that although smoking was likely to confound the association between vagotomy and Parkinson’s disease, differences in smoking prevalence could only explain a minor part of the protective effect observed after vagotomy.
Disease severity, often an important confounder, is not consistently recorded in medical databases. If we are comparing the effect of a certain drug in patients with a specific disease of interest with the outcome in patients with the same disease who do not use the drug or use a different one, then severity of underlying disease could be the indicator of the treatment choices. The untreated group may include both patients with very mild disease who do not need any treatment and patients with treatment contraindications for treatment who may be severely ill.Citation22 If severity measures are not available, proxy measures, such as use of health care services and use of certain medications, should be considered, and these proxies may also be combined. Actually, the longitudinal data in the large population-based medical databases can be understood as a set of proxies that indirectly describe the health status of a given patient.Citation23 High-dimensional propensity score adjustment is a technique initially developed to empirically identify and select a large number of covariates from routine health care data, which when combined, allow for high-dimensional proxy adjustment that would reduce residual confounding.Citation23 By using all available information and combining variables into a propensity score, the hope is to catch sufficient amount of information to remove the effect of confounding, including unknown confounding. However, like for other methods of statistical adjustment,Citation24 we have no guarantee that propensity score methods will remove unknown confounding. For example, a British study compared the results of using propensity score methods to study the effect of spironolactone treatment on mortality in patients with heart failure in an observational setting to those of a randomized controlled trial.Citation25 This study demonstrated that the propensity score analyses were unable to capture the effect of severity of the underlying illness (confounding by indication), and thus, the propensity score analyses provided biased results. Although high-dimensional propensity score adjustment may not always make a big difference in the ability to control confounding if major confounders are measured,Citation26 this method seems, in some cases, more effective than simple confounder adjustment by variables selected based on clinical reasoning, even in large databases as in the Nordic countries.Citation27 Also when compared with conventional propensity score methods, high-dimensional propensity score may better control confounding by indication in pharmacoepidemiological studies.Citation28 Although propensity score methods are often recommended over standard regression methods when the outcome is rare,Citation29 one needs to be careful in using high-dimensional propensity score without including investigator-selected variables in case of rare outcomes. Otherwise, the results may be biased.Citation30
In some cases, the list of potential confounders makes it clear that some of the important confounding factors in the study are not measurable not even by combining a large number of proxies. In such cases, other types of study designs or analysis are needed to address confounding.
Self-controlled designs
Since the early 1990s, several designs, such as the case–crossover designCitation31 and the self-controlled case series,Citation32 have been introduced, where the comparison is not between exposed and unexposed persons but between time spent under exposed and unexposed conditions, which are compared within the same subjects.Citation33 These designs, which are largely similar with subtle differences, include only cases of the outcome of interest and compare their exposure status in a relevant period for potentially causing the outcome with the exposure in a different period.Citation31 Since the same subjects are contributing time as both exposed and unexposed, confounding by permanent personal traits is absent. A major limitation of self-controlled designs is, however, that they are applicable in a narrow set of situation in which the effect of exposure is transient and the onset of the outcome is acute.Citation31,Citation34 If exposure prevalence and potential confounding factors vary over time, this time variability has to be taken into account in the study design to avoid spurious associations. This can be done by including an additional control group consisting of persons without the outcome and comparing their exposure in two different time periods by using a case–time–control design.Citation35
As an example, Lund et alCitation36 conducted a cohort study examining incidence and risk factors for venous thromboembolism (VTE) among lymphoma patients. Previous studies had suggested that chemotherapy and the use of central venous catheter increase VTE risk in high-grade lymphoma patients, yet these studies failed to adequately account for the time-dependent nature of cancer treatments. To examine whether the lymphoma treatment had transient impact on VTE risk, Lund et al included a self-controlled design in which the period of relevance for being able to cause the outcome (the primary hazard period) was defined as the 30 days prior to the VTE diagnosis date. The comparison period was the 30-day period from 90 to 61 days prior to the start of the hazard period. This approach demonstrated that the risk of VTE transiently increased almost sevenfold after the placement of a central venous catheter and almost fourfold after radiation therapy.Citation36
Active comparator
If a self-controlled design is not possible, another way of addressing unmeasurable confounding by indication or by severity in pharmacoepidemiological studies could be to include an active comparator.Citation22 As mentioned earlier, an untreated group of patients with a certain disease may have different characteristics than a treated group and the untreated group may, therefore, not at all represent a fair comparison group. If another drug is used for the disease of interest, then we can expect similarity in disease severity if these drugs are exchangeable. Accordingly, we can compare the effect between patients exposed to the drug of interest and the patients exposed to the active comparator. Although the use of active comparators will not control confounding related to the comparison between users and nonusers of a given treatment among patients with a given disease (which may be of interest), it will assist in the assessment of the potential magnitude of confounding by indication. The method of looking for an active comparator can additionally be combined with other methods, such as restriction of types of patients and propensity score adjustment.Citation37
As an example, Thomsen et alCitation38 examined the risk of acute pancreatitis in patients treated with incretin-based drugs. Incretin-based therapies are oral antihyperglycemic drugs used for type 2 diabetes. They exert their effect by augmenting glucose-stimulated insulin secretion from the pancreas, and this stimulation of the pancreas may increase the risk of acute pancreatitis. Because the underlying diabetes and associated risk factors are also associated with acute pancreatitis, the authors suspected that previous findings of an elevated risk could at least partly be due to incomplete control of confounding. Therefore, they examined the risk of acute pancreatitis in diabetic patients using incretin-based therapies compared to the risk in users of other antihyperglycemic therapies (the active comparator). The adjusted odds ratio of acute pancreatitis in incretin-based therapy compared with other antihyperglycemic therapies while adjusting for diabetes duration and complications was 0.97 (95% CI, 0.76–1.23), suggesting that the use of incretin-based drugs does not increase the risk of acute pancreatitis.Citation38
Pseudorandomization
Under certain conditions, the research question allows us to use a design that mimics randomization. Below, we will describe the use of instrumental variables, Mendelian randomization, and regression discontinuity design, which are methods that, in some instances, can be used to control unmeasured confounding.
Instrumental variable
Instrumental variables to control confounding have been used in econometrics for decades but may also be useful in epidemiological studies to control confounding.Citation39 An instrumental variable is a factor that is associated with the exposure of interest (often a determinant of the exposure of interest), so that if we categorize the study population by different levels of the instrumental variable, then these categories will have different levels of the exposure of interest. However, a major condition is that the instrumental variable must not be directly associated with the outcome or be indirectly associated with the outcome through other variables than the exposure of interest.Citation39,Citation40 If these requirements are met and the risk of the study outcome varies between groups with different levels of the instrumental variable, then this variation can only be explained either by the difference in levels of the exposure of interest between groups or by chance. Since the instrumental variable is not related to the outcome, except through the exposure, even unknown confounding is removed, as is the case under randomization.Citation40 In randomized trials, random treatment assignment is the instrumental variable in the intention-to-treat analysis.
The challenge is, however, to find an instrumental variable that has all the qualities described earlier. presents some examples of instrumental variables, which have been used in recently published studies. In pharmacoepidemiological studies, a potential instrumental variable may be preference in drug choice by the treating physician or hospital. Differences in drugs that physicians prefer are ubiquitous, and physician preference, therefore, results in natural variation in treatment patterns. In addition, as the preference is measured based on previously treated patients, in theory, it should not be related to the outcome of the patient in the study. Still, differences in prescribing behavior may also reflect differences in case mix, although this seems to explain only a minor part of the variation in preference.Citation41 Also, a physician with preference for prescribing the drug of interest may also have preference for prescribing other drugs that may affect the outcome.Citation40 Even though the instrumental variable method intuitively seems promising, there has been some disillusion partly because of the difficulties in finding valid instrumental variables. Also, the variance in these studies is bigger than in conventional analyses and even large datasets may yield low-precision estimates.Citation42 Nevertheless, instrumental variable analyses may be used to complement conventional analyses if confounding in the conventional analysis cannot be ruled out.Citation42
Table 2 Examples of instrumental variables recently used in published studies
Mendelian randomization
Since the alleles at the time of gamete formation are assorted by a mechanism that can be seen as “random”, the distribution of genetic variants in a population is generally independent of environmental or behavioral factors later in life.Citation43 These properties define an instrumental variable and can, in some instances, be used to provide a study design akin to a randomized design.
Several studies in Buckley et al have shown an association between elevated C-reactive protein and the risk of cardiovascular events with an estimated 60% increased risk for incident cardiovascular disease for C-reactive protein levels >3.0 mg/L compared to levels <1.0 mg/L.Citation44 To examine whether C-reactive protein is merely a marker of severity of cardiovascular disease or actually is involved in its pathogenesis, Zacho et alCitation45 used four independent cohorts of Caucasians of Danish descent and examined whether C-reactive protein polymorphisms were associated with the risk of ischemic heart disease and ischemic cerebrovascular disease. Polymorphisms in the C-reactive protein gene were associated with marked increases in C-reactive protein levels and thus with a theoretically predicted increase in the risk of ischemic vascular disease. However, these polymorphisms were not in themselves associated with an increased risk of ischemic vascular disease. Their finding suggested that the increased risk of ischemic vascular disease associated with higher plasma C-reactive protein levels observed in epidemiological studies probably does not represent a causal relation.Citation45
Regression discontinuity design
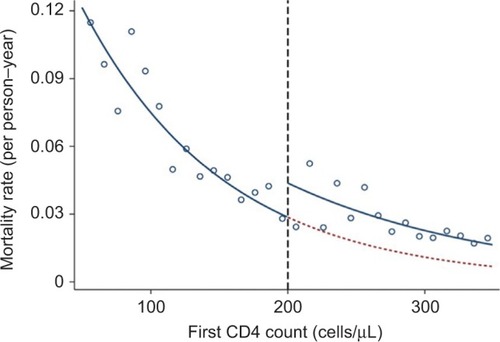
This design may be used in any care setting where rules exist or new interventions are introduced that apply to people above or below a particular threshold of a continuously measured biomarker or other continuous health-related characteristics.Citation46 The design is based on the assumption that a patient is assigned a specific treatment because the patient is above the defined threshold. However, since the measurement of biomarkers or other health-related characteristics is subject to random variation due to measurement error, sampling variability, and chance,Citation46 patients just below the threshold and patients just above the threshold will be similar with respect to both observed and unobserved pretreatment characteristics. If the probability of the outcome is plotted against the level of the assignment variable, any effect of the intervention will present as a discontinuity of the outcome at the threshold level.Citation47
In HIV patients, the decision to start life-prolonging anti-retroviral therapy (ART) depends on the patients’ CD4 cell counts. In rural South Africa, in 2007–2011, patients were eligible for ART if their CD4 count was <200 cells/μL.Citation46 By plotting the mortality rate by the CD4 count (), Bor et al found a discontinuity at 200 cells/μL so that patients with CD4 counts just >200 cells/μL had higher mortality than patients with counts just <200 cells/μL. This strongly suggested that there may be a treatment benefit, which cannot be due to confounding, as patients just below and just above the treatment threshold are expected to have similar baseline variables.Citation46
Figure 1 First CD4 count and mortality hazard rate in an HIV-positive population.
The regression discontinuity design is relatively simple, is limited to situations with a threshold rule for intervention, and only measures local effects around the threshold for the intervention.Citation48
Use of negative controls
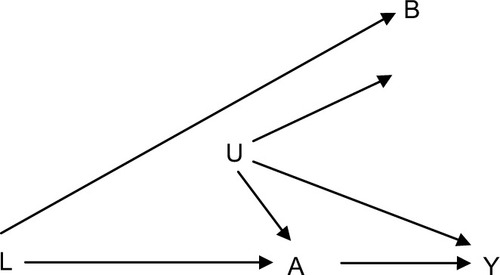
If concerns regarding uncontrolled confounding in a specific study persist and none of the pseudorandomized designs are applicable, one could consider including an additional exposure group in which the exposure is not expected to be related to the outcome or an additional outcome that is not expected to be the effect of the exposure of interest.Citation49 Using negative exposure, or outcome controls, does not control confounding, but it is a way to at least address the potential magnitude of uncontrolled confounding. The general problem is that we want to examine how an exposure A affects an outcome (Y), but in the analyses, we suspect residual confounding caused by a set of uncontrolled confounders (U). A negative control exposure (B) should be an exposure in which the distribution of U (the set of factors causing residual confounding) in those exposed to B is comparable to or at least have some overlap with the distribution in those exposed to A (the exposure of interest, ). Alternatively, we can use a negative control outcome that we do not expect to be related to the exposure A but is affected by a set of confounders comparable to those affecting the association between the exposure of interest A and the outcome Y.Citation49
Figure 2 Causal diagram showing an ideal negative control exposure B for use in evaluating studies of the causal relationship between exposure A and outcome Y.
As an example of a negative control situation, Jackson et al compared mortality in influenza-vaccinated persons with unvaccinated persons and used a negative control period to assess potential confounding. In their study, they found relative risks of death of 0.39 (95% CI, 0.33–0.47) before the influenza season, 0.56 (95% CI, 0.52–0.61) during the influenza season, and 0.74 (95% CI, 0.67–0.80) after the influenza season.Citation50 Since we do not expect influenza vaccination to have any effect before the influenza season, the lower risk of death before influenza season strongly indicated that persons who had an influenza vaccine were healthier than the background population. Actually, this difference could explain a substantial part of the observed effect of the vaccine during the influenza season.
As a second example, in pharmacoepidemiological studies, former users of medicine may constitute a negative control exposure group. Johannesdottir et alCitation51 examined the association between the use of glucocorticoids and the risk of VTE and found that current use of glucocorticoid was associated with a more than twofold increased incidence of VTE compared with nonusers. The study also included former use of glucocorticoids, and the fact that this group did not have an increased incidence of VTE strengthened the conclusion that the observed association was caused by a biological effect rather than uncontrolled confounding.
The use of “negative controls” is an example of the general idea of “triangulation” of research findings on which a recent review was written by Lawlor et al.Citation52
Conclusion
Observational studies do not have the benefit of random treatment assignment, and therefore, uncontrolled confounding constitutes a potential serious validity concern. Such concern should not, however, discourage the use of observational studies. Measured confounders can be addressed in several ways through the design or analysis of the data, while unmeasured confounders can be addressed by proxy measures, external adjustment, or design measures. Problem of unmeasured confounders or unknown confounders can, in some instances, also be solved by pseudorandomized designs, such as instrumental variable, Mendelian randomization, and regression discontinuity designs.
Acknowledgments
This study was funded by the Program for Clinical Research Infrastructure (PROCRIN) established by the Lundbeck Foundation and the Novo Nordisk Foundation and administered by the Danish Regions.
Disclosure
The authors report no conflicts of interest in this work.
References
- RothmanKJModern Epidemiology1st edBoston, MALittle, Brown and Company1986
- SennSSeven myths of randomisation in clinical trialsStat Med20133291439145023255195
- BrittonAMcKeeMBlackNMcPhersonKSandersonCBainCThreats to applicability of randomised trials: exclusions and selective participationJ Health Serv Res Policy19994211212110387403
- BoothCMTannockIFRandomised controlled trials and population-based observational research: partners in the evolution of medical evidenceBr J Cancer2014110355155524495873
- ReyesCPottegardASchwarzPReal-life and RCT participants: alendronate users versus FITs’ trial eligibility criterionCalcif Tissue Int201699324324927099132
- FrankLEpidemiology. When an entire country is a cohortScience200028754622398239910766613
- HulleySBCummingsSRBrownerWSGradyDHearstNNewmanTBDesigning Clinical Research2nd edPhiladelphiaLippincott Williams & Wilkins2001
- VanderWeeleTJHernanMARobinsJMCausal directed acyclic graphs and the direction of unmeasured confounding biasEpidemiology200819572072818633331
- FleischerNLDiez RouxAVUsing directed acyclic graphs to guide analyses of neighbourhood health effects: an introductionJ Epidemiol Community Health200862984284618701738
- SchmidtMJacobsenJBLashTLBotkerHESorensenHT25 year trends in first time hospitalisation for acute myocardial infarction, subsequent short and long term mortality, and the prognostic impact of sex and comorbidity: a Danish nationwide cohort studyBMJ2012344e35622279115
- GaistDAndersenLHallasJSorensenHTSchroderHDFriisSUse of statins and risk of glioma: a nationwide case-control study in DenmarkBr J Cancer2013108371572023322196
- SchmidtMSchmidtSASandegaardJLEhrensteinVPedersenLSorensenHTThe Danish National Patient Registry: a review of content, data quality, and research potentialClin Epidemiol2015744949026604824
- SogaardMHeide-JorgensenUNorgaardMJohnsenSPThomsenRWEvidence for the low recording of weight status and lifestyle risk factors in the Danish National Registry of Patients, 1999-2012BMC Public Health201515132026715157
- TottenborgSSThomsenRWNielsenHJohnsenSPFrausingHELangePImproving quality of care among COPD outpatients in Denmark 2008-2011Clin Respir J20137431932723163961
- SturmerTGlynnRJRothmanKJAvornJSchneeweissSAdjustments for unmeasured confounders in pharmacoepidemiologic database studies using external informationMed Care20074510 Supl 2S158S16517909375
- SvenssonEHorvath-PuhoEThomsenRWVagotomy and subsequent risk of Parkinson’s diseaseAnn Neurol201578452252926031848
- BrennerHRothenbacherDBodeGAdlerGRelation of smoking and alcohol and coffee consumption to active Helicobacter pylori infection: cross sectional studyBMJ19973157121148914929420488
- HernanMATakkoucheBCaamano-IsornaFGestal-OteroJJA meta-analysis of coffee drinking, cigarette smoking, and the risk of Parkinson’s diseaseAnn Neurol200252327628412205639
- LashTLFoxMPFinkAKSensitivity Analysis for Unmeasured Confounding Applying Quantitative Bias Analysis to Epidemiological DataOxford, UKSpringer Verlag2009
- PowersKMKayDMFactorSACombined effects of smoking, coffee, and NSAIDs on Parkinson’s disease riskMov Disord2008231889517987647
- KjøllerMJKKamper-JørgensenFThe Public Health Report, Denmark 2007Copenhagen2007 Available from: http://www.si-folkesundhed.dk/Udgivelser/B%C3%B8ger%20og%20rapporter/2008/2897%20Folke-sundhedsrapporten%202007.aspx?lang=enAccessed February 15, 2017
- YoshidaKSolomonDHKimSCActive-comparator design and new-user design in observational studiesNat Rev Rheumatol201511743744125800216
- SchneeweissSRassenJAGlynnRJAvornJMogunHBrookhartMAHigh-dimensional propensity score adjustment in studies of treatment effects using health care claims dataEpidemiology200920451252219487948
- BoscoJLSillimanRAThwinSSA most stubborn bias: no adjustment method fully resolves confounding by indication in observational studiesJ Clin Epidemiol2010631647419457638
- FreemantleNMarstonLWaltersKWoodJReynoldsMRPetersenIMaking inferences on treatment effects from real world data: propensity scores, confounding by indication, and other perils for the unwary in observational researchBMJ2013347f640924217206
- TohSGarcia RodriguezLAHernanMAConfounding adjustment via a semi-automated high-dimensional propensity score algorithm: an application to electronic medical recordsPharmacoepidemiol Drug Saf201120884985721717528
- HallasJPottegardAPerformance of the high-dimensional propensity score in a Nordic healthcare modelBasic Clin Pharmacol Toxicol2017120331231727889951
- GarbeEKlossSSulingMPigeotISchneeweissSHigh-dimensional versus conventional propensity scores in a comparative effectiveness study of coxibs and reduced upper gastrointestinal complicationsEur J Clin Pharmacol201369354955722763756
- WilliamsonEMorleyRLucasACarpenterJPropensity scores: from naive enthusiasm to intuitive understandingStat Methods Med Res201221327329321262780
- PatornoEGlynnRJHernandez-DiazSLiuJSchneeweissSStudies with many covariates and few outcomes: selecting covariates and implementing propensity-score-based confounding adjustmentsEpidemiology201425226827824487209
- MaclureMThe case-crossover design: a method for studying transient effects on the risk of acute eventsAm J Epidemiol199113321441531985444
- FarringtonCPRelative incidence estimation from case series for vaccine safety evaluationBiometrics19955112282357766778
- PetersenIDouglasIWhitakerHSelf controlled case series methods: an alternative to standard epidemiological study designsBMJ2016354i451527618829
- WhitakerHJFarringtonCPSpiessensBMusondaPTutorial in biostatistics: the self-controlled case series methodStat Med200625101768179716220518
- SuissaSThe case-time-control designEpidemiology1995632482537619931
- LundJLOstgardLSPrandoniPSorensenHTde NullyBPIncidence, determinants and the transient impact of cancer treatments on venous thromboembolism risk among lymphoma patients in DenmarkThromb Res2015136591792326371409
- SchneeweissSPatrickARSturmerTIncreasing levels of restriction in pharmacoepidemiologic database studies of elderly and comparison with randomized trial resultsMed Care20074510 Supl 2S131S14217909372
- ThomsenRWPedersenLMollerNKahlertJBeck-NielsenHSorensenHTIncretin-based therapy and risk of acute pancreatitis: a nationwide population-based case-control studyDiabetes Care20153861089109825633664
- GreenlandSAn introduction to instrumental variables for epidemiologistsInt J Epidemiol200029472272910922351
- BrookhartMARassenJASchneeweissSInstrumental variable methods in comparative safety and effectiveness researchPharmacoepidemiol Drug Saf201019653755420354968
- BoefAGle CessieSDekkersOMPhysician’s prescribing preference as an instrumental variable: exploring assumptions using survey dataEpidemiology201627227628326605813
- BoefAGvanPJArbousMSPhysician’s preference-based instrumental variable analysis: is it valid and useful in a moderate-sized study?Epidemiology201425692392725051311
- SmithGDEbrahimSMendelian randomization: prospects, potentials, and limitationsInt J Epidemiol2004331304215075143
- BuckleyDIFuRFreemanMRogersKHelfandMC-reactive protein as a risk factor for coronary heart disease: a systematic review and meta-analyses for the U.S. Preventive Services Task ForceAnn Intern Med2009151748349519805771
- ZachoJTybjaerg-HansenAJensenJSGrandePSillesenHNordestgaardBGGenetically elevated C-reactive protein and ischemic vascular diseaseN Engl J Med2008359181897190818971492
- BorJMoscoeEMutevedziPNewellMLBarnighausenTRegression discontinuity designs in epidemiology: causal inference without randomized trialsEpidemiology201425572973725061922
- O’KeeffeAGGenelettiSBaioGSharplesLDNazarethIPetersenIRegression discontinuity designs: an approach to the evaluation of treatment efficacy in primary care using observational dataBMJ2014349g529325199521
- VandenbrouckeJPle CessieSCommentary: regression discontinuity design: let’s give it a try to evaluate medical and public health interventionsEpidemiology201425573874125076150
- LipsitchMTchetgenTECohenTNegative controls: a tool for detecting confounding and bias in observational studiesEpidemiology201021338338820335814
- JacksonLAJacksonMLNelsonJCNeuzilKMWeissNSEvidence of bias in estimates of influenza vaccine effectiveness in seniorsInt J Epidemiol200635233734416368725
- JohannesdottirSAHorvath-PuhoEDekkersOMUse of gluco-corticoids and risk of venous thromboembolism: a nationwide population-based case-control studyJAMA Intern Med2013173974375223546607
- LawlorDATillingKDavey SmithGTriangulation in aetiological epidemiologyInt J Epidemiol Epub2017120
- SlaughterJLReaganPBNewmanTBKlebanoffMAComparative effectiveness of nonsteroidal anti-inflammatory drug treatment vs no treatment for patent ductus arteriosus in preterm infantsJAMA Pediatr Epub201713
- IsongIARichmondTKawachiIAvendanoMChildcare attendance and obesity riskPediatrics20161385e2016153927940780
- ValleyTSWalkeyAJLindenauerPKWienerRSCookeCRAssociation between noninvasive ventilation and mortality among older patients with pneumoniaCrit Care Med Epub2016105
- CarrollRMetcalfeCSteegSPsychosocial assessment of self-harm patients and risk of repeat presentation: an instrumental variable analysis using time of hospital presentationPLoS One2016112e014971326918579
- BoefAGSouvereinPCVandenbrouckeJPInstrumental variable analysis as a complementary analysis in studies of adverse effects: venous thromboembolism and second-generation versus third-generation oral contraceptivesPharmacoepidemiol Drug Saf201625331732426749045
- BrookeBSGoodneyPPKraissLWGottliebDJSamoreMHFinlaysonSRReadmission destination and risk of mortality after major surgery: an observational cohort studyLancet2015386999688489526093917