
Abstract
Purpose
This study compared the Charlson comorbidity index (CCI) information derived from chart review and administrative systems to assess the completeness and agreement between scores, evaluate the capacity to predict 30-day and 1-year mortality in intensive care unit (ICU) patients, and compare the predictive capacity with that of the Simplified Acute Physiology Score (SAPS) II model.
Patients and methods
Using data from 959 patients admitted to a general ICU in a Norwegian university hospital from 2007 to 2009, we compared the CCI score derived from chart review and administrative systems. Agreement was assessed using % agreement, kappa, and weighted kappa. The capacity to predict 30-day and 1-year mortality was assessed using logistic regression, model discrimination with the c-statistic, and calibration with a goodness-of-fit statistic.
Results
The CCI was complete (n=959) when calculated from chart review, but less complete from administrative data (n=839). Agreement was good, with a weighted kappa of 0.667 (95% confidence interval: 0.596–0.714). The c-statistics for categorized CCI scores from charts and administrative data were similar in the model that included age, sex, and type of admission: 0.755 and 0.743 for 30-day mortality, respectively, and 0.783 and 0.775, respectively, for 1-year mortality. Goodness-of-fit statistics supported the model fit.
Conclusion
The CCI scores from chart review and administrative data showed good agreement and predicted 30-day and 1-year mortality in ICU patients. CCI combined with age, sex, and type of admission predicted mortality almost as well as the physiology-based SAPS II.
Introduction
Administrative data are often used for risk adjustment in observational studies of variations in utilization, expenditure, and mortality rates, for example in selected diseases, across hospitals, regions, or countries. In such observational studies, it is essential to properly adjust for differences in case mix, eg, through the use of measures of disease severity or comorbidity. In intensive care patients, physiology-based severity-of-illness scores can be used to adjust for patient demographics, comorbidities, and illness severity.Citation1,Citation2 These measures, however, require additional prospective data collection, are complex, are not readily available in administrative databases, and are intended for prediction of in-hospital mortality after admission to an intensive care unit (ICU). Comorbidity is also an important determinant of the outcome of an ICU stay and may improve prognostic predictions for critically ill patients.Citation3 The measurement of comorbidity has received increasing attention in the literature, though no consensus regarding the definition of comorbidity currently exists.Citation4
The Charlson comorbidity index (CCI) is among the best-known and widely used indexes of comorbidity.Citation4–Citation8 Data for the CCI can be obtained from chart reviewCitation5 or derived from administrative data with ICD-9CM or ICD-10 codes.Citation9–Citation11 Chart review gives a higher prevalence of comorbidities than administrative data,Citation12,Citation13 though agreement between data sources varies according to patient population. However, this finding is not universal, and another study reported higher CCI scores and better discriminative capacity of CCI when using administrative data than when using single-day chart review in hospitalized patients.Citation14 Furthermore, chart review can be very time consuming, whereas administrative databases can yield data from large patient groups.Citation4
Several studies have documented the validity of using the CCI scores obtained from chart dataCitation3 and administrative dataCitation15–Citation18 to predict mortality in ICU patients. Moreover, critical care populations vary considerably between studies; hence, there is a need to validate the use of the CCI in a variety of populations. Few studies have compared CCI scores from different sources and validated their respective predictive capacities.Citation19 Furthermore, CCI scores derived from ICD-9CM codes and ICD-10 codes are not necessarily equivalent, and coding practices may differ both locally and between countries.
The objectives of this study of 959 intensive care patients from a general ICU were to compare the following: 1) the completeness and agreement between CCI scores derived from chart review and administrative data for prior hospital contacts (using ICD-10 codes); 2) the capacity of the derived CCI scores to predict 30-day and 1-year mortality; and 3) the predictive capacity with that of the Simplified Acute Physiology Score II (SAPS II)Citation1 model.
Patients and methods
Patient population and study design
The study was an observational study of ICU patients from Akershus University Hospital, a 615-bed general hospital that covers all medical and surgical specialties except neurosurgery, multitrauma care, cardiac surgery, eye diseases, and rheumatology. It is affiliated with the University of Oslo. All patients with acute conditions in the catchment area are treated in the hospital, although for elective conditions, every patient – by law – has the opportunity to choose the hospital for treatment. However, few patients in practice take advantage of this legal right. For specialties that are not covered, the hospital refers patients to other tertiary care hospitals in the area.
At the time of the study, the hospital had a catchment population of ~320,000 people in Oslo and Akershus. The hospital had a 9-bed general ICU and had treated patients from the medical, surgical, and neurological departments. From January 1, 2007 to December 31, 2009, this ICU had 1,287 patient admissions. After excluding 328 patients with age <18 years, ICU stay <24 hours, or readmission to the ICU, we included 959 patients with first admission to the ICU (termed “index admission”) during this 3-year period.Citation20
The study was presented to the Regional Committee for Medical Health Research Ethics and was determined to be a quality assurance study (ref: 2011/950). It was approved by the local privacy ombudsman for research at Akershus University Hospital. Patient consent was not required to access and review the data.
Data sources and data collection
Chart review
The electronic medical charts of all patients were reviewed by one of the authors (HH or SAS), who recorded the patient’s comorbidity score according to CCI.Citation5 The reviewer used all available information in the medical record until admission to the ICU, including running text in admission reports, case notes, discharge summaries, and laboratory data back to 2004, and – when available – scanned versions of earlier paper-based medical records or scanned discharge summaries or case notes from other hospitals. The presence of the medical conditions of the CCI was marked on a registration form.
Patient administrative data
Date and time of the index hospital admission, ICU admission, and ICU discharge were extracted from the hospital’s patient administration system to estimate the length of the hospital stay prior to ICU admission.
For the purpose of scoring CCI from administrative data, we extracted each patient’s ICD-10 codes from all previous inpatient admissions and hospital outpatient visits between January 1, 1999, when ICD-10 coding was introduced, and the index admission. In Norway, for reimbursement purposes, 1 primary diagnosis, a maximum of 7 secondary diagnoses, and 10 procedure codes are allowed for each admission or outpatient visit. However, most outpatient visits are coded with only 1–2 diagnoses. We defined comorbidity as conditions present upon admission. Hence, we only selected inpatient admissions and ambulatory visits occurring prior to the index admission, as in a previous study.Citation12
CCI scoring
The CCI was originally developed to predict 1-year mortality in a mixed population of internal medicine patients using comorbidity derived from chart review.Citation5 The CCI consists of 19 selected conditions that are weighted and summed to an index on a 0–33 scale. Its reliability and validity have been assessed in various ways and in different populations, and in general, its test–retest and interrater reliability is moderate to good.Citation4,Citation21 More recently, this index has been adapted for use with diagnoses from administrative databases, and revised weights have been suggested or adapted for specific populations.Citation9,Citation22,Citation23 The CCI is typically used to describe populations, predict outcomes, adjust for case mix to reduce confounding in observational studies in conjunction with a variety of different outcomes, such as mortality, disability, readmissions, and length of stay.
For the CCI scores obtained from the electronic charts, we used the weights from the original CCI, producing a score using a 0–33 scale.Citation5 For the CCI scores obtained from the administrative data, CCI scores were derived using a previously validated algorithm that is based on ICD-10 data; it scores the CCI on a 0–29 scale.Citation10,Citation23 When no ICD-10 code was available from a previous hospital contact (ie, a missing value), the CCI was scored as 0.
Physiology-based severity score
During the first 24 hours of their ICU stay, patients were prospectively scored according to the SAPS II.Citation2 The SAPS II is a severity score for ICU patients and is based on the worst values measured on 17 variables during the initial 24 hours of their ICU stay. It is scored on a 0- to 163-point scale, with higher score indicating more severe illness. In addition, a mathematical formula is provided for predicting hospital mortality.
The SAPS II scores were stored in a local database, together with information on age, sex, type of admission, outcome of stay, time on mechanical ventilation, and if treatment was withheld or withdrawn. We defined “type of admission” as defined according to SAPS IICitation2: medical (ie, patients with no surgery in the last 7 days before ICU admission), scheduled surgical (ie, patients whose surgery was scheduled at least 24 hours in advance), or unscheduled surgical (ie, patients added to operating room schedule within 24 hours of their operation).
Other data and mortality
Patients were also prospectively grouped into 8 principal disease categories that were based on the major disease categories in the Acute Physiology and Chronic Health Evaluation III (APACHE III) prognostic system: respiratory, cardiovascular/vascular, gastrointestinal, neurological, sepsis- related, trauma-related, metabolic, and other diseases.Citation24 We used this classification for descriptive purposes only.
We identified mortality cases during the study period through linkage to the registers of Statistics Norway until June 21, 2013, using the patients’ unique national 11-digit person identification number.
Statistical analysis
We present descriptive statistics using the mean (standard deviation [SD]), the median (25th–75th percentiles), or count (%). Groups were compared using the independent samples t-test for normally distributed data or the Mann–Whitney U-test for nonnormally distributed data. Categorical data were compared using the chi-square test or Fisher’s exact test, as appropriate.
Further analyses were conducted in the total study sample. CCI scores were categorized as 0, 1, and ≥2. The CCI score distributions obtained with the 2 calculation methods were compared using McNemar’s test. Agreement between CCI from chart review and patient administration data was assessed using 1) Spearman’s rank correlation between the scores, 2) the proportion of agreement between the categorized scores, and 3) weighted kappa with 95% confidence intervals (CIs) between categorized CCI scores from the 2 sources, using quadratic disagreement weights.
The individual items of the Charlson score were compared between the 2 data sources using 1) the proportion of agreement, 2) simple kappa with 95% CIs, and 3) positive predictive value (PPV) of the categorized CCI scores from administrative data, using the scores from the chart review as the reference. The kappa values were interpreted as follows: poor agreement (<0.20), fair agreement (0.21–0.40), moderate agreement (0.41–0.60), good agreement (0.61–0.80), and very good agreement (0.81–1.00).Citation25
The predictive validity of the derived CCI scores was assessed using multivariate logistic regression analysis, with 30-day and 1-year mortality as the outcome measure. We assessed the discrimination of the models using the c-statistic, which represents the area under the receiver-operator characteristic curve. Model calibration was assessed using the Hosmer–Lemeshow goodness-of-fit statistic,Citation26 whereby we considered a value of p<0.05 to indicate that the model had a poor fit.
We assessed the impact of several combinations of covariates that were expected to be associated with mortality: age, sex, and type of admission (ie, medical, unscheduled surgical, and scheduled surgical). We were also interested in determining whether the CCI score provided additive prognostic value to the SAPS II score in estimating mortality. In the regression models, we included only those variables that were available after the first 24 hours of ICU stay, without later updating of variables.
To check for multicollinearity issues, we assessed Spearman’s rank correlation between the independent variables in the multivariable model and found that all pairwise correlations had values <0.45.
We used Stata version 14.1 for all analyses (Stata Inc, College Station, TX, USA). We chose a 5% significance level, using 2-sided tests.
Results
Of the 959 patients admitted to the ICU in the study period, 839 had information on previous admissions or visits that was available in the hospital’s patient administration system. The 120 patients without information on previous admissions or visits were younger, had lower CCI scores based on chart review, and experienced a shorter time between the hospital admission and transfer to the ICU than the 839 with available information; all other patient characteristics did not differ between the 2 groups ().
Table 1 Characteristics of intensive care patients included in the study (n=959) according to complete or incomplete scores
A scatter plot of the CCI scores showed that many of the patients were located away from the diagonal, suggesting a difference in the CCI scores derived from the 2 sources (). The correlation between CCI scores derived from chart review and administrative data was 0.662 for scales categorized as 0, 1, and ≥2 and 0.692 for CCI scores on the continuous scales that were scored from 0 to 29 (n=33) ().
Figure 1 Scatter plot of CCI scores according to source of deriving the score, either from register or chart review.
Abbreviation: CCI, Charlson comorbidity index.
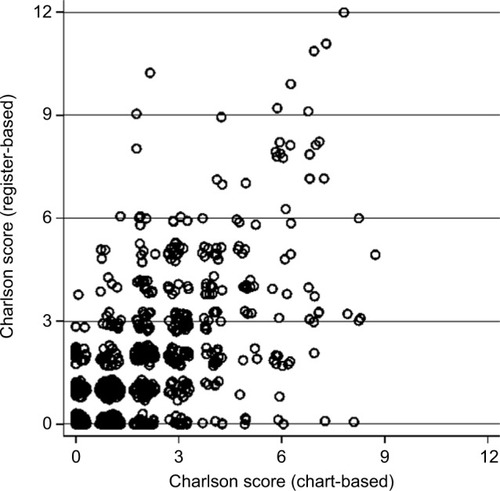
Table 2 Spearman’s rank correlations between different variations of Charlson comorbidity scores (n=959)
The agreement between CCI scores according to source, as assessed with weighted kappa with 95% CI (n=959), was 0.667 (0.596–0.714) for CCI administrative data vs CCI chart review (continuous); and 0.652 (0.613–0.697) for CCI administrative data vs CCI chart review (3 categories: 0, 1, and ≥2). The proportion of agreement between the categorized CCI scores from the 2 sources was 69% (657/959) (). The distributions of categorized CCI differed (p<0.001), with a larger proportion of patients with an index of 1 or ≥2 from chart review than from administrative data.
Table 3 Cross-tabulation of categorized Charlson index from the 2 sources
The agreement between CCI scores for individual comorbidities derived from the 2 data sources ranged from 88.8% to 99.6%, and kappa ranged from 0.26 to 0.66. PPVs, ie, the proportion of cases with a condition present in the chart review, given that the presence of the same condition based on the codes in the administrative data, ranged from 33.3% to 81.3% ().
Table 4 Prevalence, agreement, and positive predictive value for Charlson score from administrative and chart data (n=959)
In total, 249 (26%) patients died within 30 days and 341 (36%) patients died within 1 year. In the assessment of discrimination in logistic regression models for 30-day mortality, the c-statistic for the CCI score from chart review was 0.656 (95% CI: 0.621–0.692), which was somewhat higher than that of the administrative system-based score of 0.607 (95% CI: 0.570–0.644). The addition of age, sex, type of admission, and ventilator status increased the c-statistic for models with the CCI from both sources, and the c-statistic values appeared to converge when adding additional variables into the models (). SAPS II scores had a higher c-statistic than the 2 CCI scores from different sources, and the numerical value was also higher than for the models with CCI score, age, sex, and type of admission. Furthermore, adding the CCI score to a model with the SAPS II score only marginally improved the discrimination of the model.
Table 5 Discrimination for the risk-adjustment models according to included variables, using c-statistics (area under the ROC curve) with 95% CI for 30-day and 1-year mortality
In models of 1-year mortality, the pattern of capacity to discriminate between patients was similar to that of the models of 30-day mortality. The CCI-based models performed somewhat better and the physiology-based models somewhat worse for 1-year mortality than for 30-day mortality ().
Model calibration showed satisfactory calibration (p>0.05) for most models, with the exception of SAPS II+CCI chart review for 30-day mortality ().
Table 6 Model calibration for various combinations of covariates
Discussion
In this study, the CCI score from chart review resulted in a higher CCI score than that derived from administrative systems, although the agreement between CCI scores derived from the 2 data sources was good and varied for the individual comorbidities. When 30-day mortality and 1-year mortality were set as outcome variables, the discrimination of the CCI combined with age, sex, and type of admission was likewise good, and model calibration was acceptable. In this ICU population, however, the physiology-based SAPS II score had better predictive properties, and there was little additional value obtained from combining the CCI with SAPS II in the prediction models.
The current study found that more patients had a CCI score >0 when the score was derived from chart review than from the administrative database, which aligns with the findings of previous studies.Citation12,Citation27 The weighted kappa statistic for agreement between administrative data and chart review for the CCI scores in the current study ranged from 0.65 to 0.67. Previous studies have compared individual comorbidities between administrative data and charts and have reported simple kappa values of 0.52–0.83Citation28 and 0.30–0.82,Citation29 which are comparable with the findings for individual comorbidities in the current study.
The predictive capacity of the CCI from chart review in this study was somewhat better than that of the CCI derived from administrative data, in line with previous studies. For example, comorbidity data from a clinical database of cardiac surgery patients were better at predicting hospital mortality than the data from an administrative database,Citation30 and the CCI extracted from medical records was better than the CCI derived from administrative billing data for predicting hospital mortality for Medicare beneficiaries undergoing carotid endarterectomy.Citation27
SAPS II scores better predicted 30-day and 1-year mortality than the CCI, which supports previous studies of critical care populations, eg, that physiology-based scores (APACHE II, APACHE III, and SAPS II) have better capacity for predicting hospital mortalityCitation3,Citation16,Citation31 as well as 30-day to 1-year mortalityCitation17 than the CCI. However, models using independently weighted Elixhauser comorbidities discriminated better than an APACHE-weighted score in ICU patients.Citation32 The finding that the CCI combined with other readily available variables performed almost as well as physiology-based scores is in concert with previous findings.Citation17 Moreover, the CCI can be calculated at the time of admission to the ICU, in contrast to physiology-based scores that are dependent on laboratory and bedside clinical data.Citation18 The c-statistic for the CCI was higher for 1-year than for 30-day mortality, as was shown previously in ICU patients.Citation18
In the current study, adding comorbidity to SAPS II only marginally improved the ability to predict mortality, supporting previous research indicating that the CCI did not significantly improve the discrimination of the APACHE II weighted score, when it replaced the more rudimentary comorbidity component of the APACHE II score.Citation15
There are, however, several notable differences between this study and the studies of comorbidity indexes. Most previous studies are from the US and thus these scored comorbidity based on ICD-9-CM codes, whereas the current study was based on ICD-10 codes, as in Australian and Swiss studies.Citation11,Citation14 Some studies included diagnosis codes from the index hospital stay or devised algorithms to exclude the main diagnosis or complications.Citation11–Citation13 This approach is common in studies that use the Elixhauser comorbidity index.Citation33
In contrast, the current study only included diagnosis from prior hospital stays or consultations, which is common practice with the CCI; though this is not always clear from the studies. When only using data from prior hospitalizations in 5 selected patient populations, there was little difference in discrimination between the Elixhauser and Charlson/Deyo methods.Citation34
Moreover, some studies included patients over long time periods, eg, those admitted to an ICU for >16 years, during which the average age, severity of illness, and comorbidity at the time of admission increased significantly.Citation35 In contrast, the subjects in the current study were admitted during a 3-year period.
This study was retrospective, as it used chart review and administrative databases, and thus it has inherent limitations with regard to the completeness and quality of the data. Only 1 rater abstracted the presence of the medical conditions from each medical chart, and we did not assess the interrater reliability of the scores abstracted.Citation21 Medical charts typically include cumulative information on previous diseases and comorbidity; however, in the current study, there is still a possibility that this reference standard was not complete, as we only reviewed charts from 1 hospital. In the Norwegian National Health Service, acute care patients are admitted to a hospital based on their home address, and mobility is fairly low. Moreover, we had administrative data on hospital admissions that went back to 1999, which may explain why the proportion of patients with previously recorded disease episodes was fairly high. In the current study, the Charlson score from the charts was scored on a 0–33 scale, in contrast to a 0–29 scale used in the algorithm for administrative data. This difference in maximum score of 4 is entirely caused by solid tumor, leukemia, and lymphomas having separate scores of 2 (ie, a maximum of 6 points with all 3 types of malignancy) in the original Charlson model, while in the Deyo/Quan model, these conditions are combined into 1 category for malignancy, which is assigned a weight of 2. In the current study, only 1 patient had 2 of these malignancies (in addition to another comorbidity) and would have been classified as Charlson ≥2 of the categorized Charlson index with both scoring models. Hence, this did not influence the results.
Secondary codes from administrative data do not indicate whether the conditions were preexisting or appeared after an admission; hence, conditions based on laboratory tests may have a higher prevalence in administrative data than in medical charts.Citation13
An advantage of using administrative health data for estimating CCI is that it can easily be collected for a large number of subjects, in contrast to more resource-consuming chart reviews. It also enables researchers to conduct and improve risk adjustment in studies where administrative data are available in a register or through linkage with such data, even if access to medical charts is not possible.
The CCI may be incorporated in different ways in statistical analyses. It is most often used as a grouped score, although some authors see this as a limitation and recommend using the continuous score in prediction models,Citation36 or using the individual comorbidities as dummy variables.Citation23 Some authors have suggested revising the selection of conditions or the weights in order to improve the predictive capacity of the CCI.Citation37
As previously noted, in general, administrative data are accurately coded for severe or life-threatening conditions, but coding may be less accurate for nonspecific or symptomatic conditions.Citation23 Therefore, results from ICU populations may not be generalizable to other patient populations. Physiology data and physiology-based models are available to a lesser extent for such non-ICU populations, and hence the CCI score may be more useful for prognostic models in these populations.
Conclusion
This study showed that the CCI from chart review resulted in a higher CCI score than that derived from administrative records, although the agreement between the indexes was good. The CCI from both sources predicted 30-day and 1-year mortality in ICU patients. For CCI combined with age, sex, and type of admission, the capacity to predict 30-day and 1-year mortality approached the level of the physiology-based SAPS II score. The use of the CCI combined with easily collectible variables, such as age, sex, and type of admission, gives useful prognostic information and may complement or replace a physiology-based score in some settings. There seems to be little additional value from combining the CCI with SAPS II in models predicting 30-day or 1-year mortality in ICU patients.
Author contributions
KS made substantial contributions to the conception and design of the study, conducted the analysis and interpreted the data, drafted the paper, and critically revised the manuscript. SAS and HH made substantial contributions to the conception and design of the study, the acquisition of data, and critically commented on the manuscript for important intellectual content. RH made substantial contributions to the study design and data collection and critically commented on the manuscript for scientific content. All authors contributed toward data analysis, drafting and critically revising the paper and agree to be accountable for all aspects of the work.
Disclosure
The authors report no conflicts of interest in this work.
References
- KnausWWagnerDDraperEAPACHE III study design: analytic plan for evaluation of severity and outcome in intensive care unit patients. ImplicationsCrit Care Med19891712 pt 2S219S2212591247
- Le GallJRLemeshowSSaulnierFA new simplified acute physiology score (SAPS II) based on a European/North American multicenter studyJAMA199327024295729638254858
- PosesRMMcClishDKSmithWRBekesCScottWEPrediction of survival of critically ill patients by admission comorbidityJ Clin Epidemiol19964977437478691223
- de GrootVBeckermanHLankhorstGJBouterLMHow to measure comorbidity: a critical review of available methodsJ Clin Epidemiol200356322122912725876
- CharlsonMEPompeiPAlesKLMacKenzieCRA new method of classifying prognostic comorbidity in longitudinal studies: development and validationJ Chronic Dis19874053733833558716
- SouthernDAQuanHGhaliWAComparison of the Elixhauser and Charlson/Deyo methods of comorbidity measurement in administrative dataMed Care200442435536015076812
- SharabianiMTAylinPBottleASystematic review of comorbidity indices for administrative dataMed Care201250121109111822929993
- AustinSRWongYNUzzoRGBeckJREglestonBLWhy summary comorbidity measures such as the Charlson comorbidity index and Elixhauser score workMed Care2015539e65e7223703645
- DeyoRACherkinDCCiolMAAdapting a clinical comorbidity index for use with ICD-9-CM administrative databasesJ Clin Epidemiol19924566136191607900
- QuanHSundararajanVHalfonPCoding algorithms for defining comorbidities in ICD-9-CM and ICD-10 administrative dataMed Care200543111130113916224307
- SundararajanVHendersonTPerryCMuggivanAQuanHGhaliWANew ICD-10 version of the Charlson comorbidity index predicted in-hospital mortalityJ Clin Epidemiol200457121288129415617955
- LeeDSDonovanLAustinPCComparison of coding of heart failure and comorbidities in administrative and clinical data for use in outcomes researchMed Care200543218218815655432
- ChongWFDingYYHengBHA comparison of comorbidities obtained from hospital administrative data and medical charts in older patients with pneumoniaBMC Health Serv Res20111110521586172
- LuthiJCTroilletNEisenringMCAdministrative data outperformed single-day chart review for comorbidity measureInt J Qual Health Care200719422523117599922
- HoKMFinnJKnuimanMWebbSACombining multiple comorbidities with Acute Physiology Score to predict hospital mortality of critically ill patients: a linked data cohort studyAnaesthesia200762111095110017924888
- QuachSHennessyDAFarisPFongAQuanHDoigCA comparison between the APACHE II and Charlson Index Score for predicting hospital mortality in critically ill patientsBMC Health Serv Res2009912919643010
- ChristensenSJohansenMBChristiansenCFJensenRLemeshowSComparison of Charlson comorbidity index with SAPS and APACHE scores for prediction of mortality following intensive careClin Epidemiol2011320321121750629
- LadhaKSZhaoKQuraishiSAThe Deyo-Charlson and Elixhauservan Walraven Comorbidity Indices as predictors of mortality in critically ill patientsBMJ Open201559e008990
- NeedhamDMScalesDCLaupacisAPronovostPJA systematic review of the Charlson comorbidity index using Canadian administrative databases: a perspective on risk adjustment in critical care researchJ Crit Care2005201121916015512
- HoelHSkjakerSAHaagensenRStavemKDecisions to withhold or withdraw life-sustaining treatment in a Norwegian intensive care unitActa Anaesthesiol Scand201458332933624405518
- HallSFGroomePAStreinerDLRochonPAInterrater reliability of measurements of comorbid illness should be reportedJ Clin Epidemiol200659992693316895815
- GhaliWAHallRERosenAKAshASMoskowitzMASearching for an improved clinical comorbidity index for use with ICD-9-CM administrative dataJ Clin Epidemiol19964932732788676173
- QuanHLiBCourisCMUpdating and validating the Charlson comorbidity index and score for risk adjustment in hospital discharge abstracts using data from 6 countriesAm J Epidemiol2011173667668221330339
- KnausWAWagnerDPDraperEAThe APACHE III prognostic system. Risk prediction of hospital mortality for critically ill hospitalized adultsChest19911006161916361959406
- AltmanDGPractical Statistics for Medical Research1st edLondonChapman & Hall1991
- HosmerDWJrLemeshowSApplied Logistic RegressionNew York, NYJohn Wiley & Sons, Inc1989
- KieszakSMFlandersWDKosinskiASShippCCKarpHA comparison of the Charlson comorbidity index derived from medical record data and administrative billing dataJ Clin Epidemiol199952213714210201654
- QuanHLiBSaundersLDAssessing validity of ICD-9-CM and ICD-10 administrative data in recording clinical conditions in a unique dually coded databaseHealth Serv Res20084341424144118756617
- HumphriesKHRankinJMCarereRGBullerCEKielyFMSpinelliJJCo-morbidity data in outcomes research: are clinical data derived from administrative databases a reliable alternative to chart review?J Clin Epidemiol200053434334910785564
- HannanELKilburnHJrLindseyMLLewisRClinical versus administrative data bases for CABG surgery. Does it matter?Med Care199230108929071405795
- NorenaMWongHThompsonWDKeenanSPDodekPMAdjustment of intensive care unit outcomes for severity of illness and comorbidity scoresJ Crit Care200621214215016769457
- JohnstonJAWagnerDPTimmonsSWelshDTsevatJRenderMLImpact of different measures of comorbid disease on predicted mortality of intensive care unit patientsMed Care2002401092994012395026
- ElixhauserASteinerCHarrisDRCoffeyRMComorbidity measures for use with administrative dataMed Care19983618279431328
- StukenborgGJWagnerDPConnorsAFJrComparison of the performance of two comorbidity measures, with and without information from prior hospitalizationsMed Care200139772773911458137
- WilliamsTAHoKMDobbGJFinnJCKnuimanMWWebbSAChanges in case-mix and outcomes of critically ill patients in an Australian tertiary intensive care unitAnaesth Intensive Care201038470370920715735
- HallWHRamachandranRNarayanSJaniABVijayakumarSAn electronic application for rapidly calculating Charlson comorbidity scoreBMC Cancer200449415610554
- MartinsMBlaisREvaluation of comorbidity indices for inpatient mortality prediction modelsJ Clin Epidemiol200659766566916765268