
Abstract
Background
Agreement between questionnaires and accelerometers to measure physical activity (PA) differs between studies and might be related to demographic, lifestyle, and health characteristics, including disability and depressive symptoms.
Methods
We included 1,410 individuals aged 51–94 years from the population-based Rotterdam Study. Participants completed the LASA Physical Activity Questionnaire and wore a wrist-worn accelerometer on the nondominant wrist for 1 week thereafter. We compared the Spearman correlation and disagreement (level and direction) for total PA across levels of demographic, lifestyle, and health variables. The level of disagreement was defined as the absolute difference between questionnaire- and accelerometer-derived PA, whereas the direction of disagreement was defined as questionnaire PA minus accelerometer PA. We used linear regression analyses with the level and direction of disagreement as outcome, including all demographic, lifestyle, and health variables in the model.
Results
We observed a Spearman correlation of 0.30 between questionnaire- and accelerometer-derived PA in the total population. The level of disagreement (ie, absolute difference) was 941.9 (standard deviation [SD] 747.0) minutes/week, and the PA reported by questionnaire was on average 529.4 (SD 1,079.5) minutes/week lower than PA obtained by the accelerometer. The level of disagreement decreased with higher educational levels. Additionally, participants with obesity, higher disability scores, and more depressive symptoms underestimated their self-reported PA more than their healthier counterparts.
Conclusion
We observed large differences in PA time derived from the LASA Physical Activity Questionnaire and the wrist-worn accelerometer. Differences between the methods were related to body-mass index, level of disability, and presence of depressive symptoms. Future studies using questionnaires and/or accelerometers should account for these differences.
Introduction
Physical activity (PA) is an important modifiable risk factor in the prevention of diseases, including cardiovascular disease, diabetes mellitus, and several types of cancer.Citation1 For practical reasons, PA is often measured subjectively by questionnaire.Citation2 However, self-reported PA can suffer from reporting bias, partially attributable to the cognitive challenge of estimating the frequency, intensity, and duration of PA.Citation3 Moreover, activities of light intensity are hard to recall and might not be reported.Citation4,Citation5 Objective methods, including accelerometers, offer a solution to these problems and can give objective estimates on duration and intensity of PA. Therefore, accelerometers are increasingly being used in current research.Citation2,Citation6 However, when comparing questionnaire data with objective methods applied in large populations, major discrepancies emerge.Citation7,Citation8 The inconsistency might be related to recall bias, which can be influenced by population characteristics, such as age, sex, and health status.Citation2,Citation9 In addition, the inconsistency might stem from the fact that accelerometers cannot measure all PA accurately.Citation10,Citation11 For example, weightlifting and cycling are generally underestimated by accelerometers worn on the upper body.Citation12 Considering the increased use of accelerometers in current research,Citation2,Citation6 it is important to understand and quantify how PA assessed with questionnaires and accelerometers differs and how these differences relate to population characteristics.Citation13
Previous studies have shown that the correlation between self-reported and objectively measured PA differs by age, sex, ethnicity, socioeconomic status, and level of PA.Citation8,Citation9 However, results presented referred to correlation coefficients, which are a measure of the extent to which two variables are linearly related, but do not take into account their measurement scales. As such, these studies did not provide information regarding the level of agreement and direction of disagreement of the two methods.Citation14 A study that accounted for the direction of disagreement between objective and subjective measured PA in young adults suggested that overweight adults had a tendency to overestimate the time spent in vigorous PA more than normal-weight individuals.Citation15 Information from older adults, a population with different PA patterns than younger adults,Citation16 is currently lacking. Moreover, the effect of socioeconomic status and mental and physical health on the agreement between accelerometer and questionnaire remains unclear. Therefore, we aimed to quantify the level and direction of disagreement between questionnaire-assessed PA and accelerometer-assessed PA and to investigate if differences in agreement are explained by sociodemographic, lifestyle, and health factors.
Subjects and methods
Study population
This paper utilizes data from the Rotterdam Study, a population-based cohort designed to examine the onset and risk factors of diseases in older adults.Citation17 The Rotterdam Study was approved by the medical ethics committee (The Ministry of Health, Welfare and Sport of the Netherlands) according to the Wet Bevolkingsonderzoek ERGO (Population Study Act, Rotterdam Study), executed by the Ministry of Health, Welfare and Sport of the Netherlands. Trained research assistants interviewed the participants at home to collect the baseline information and individuals visited the research center twice, where clinical measurements were obtained.
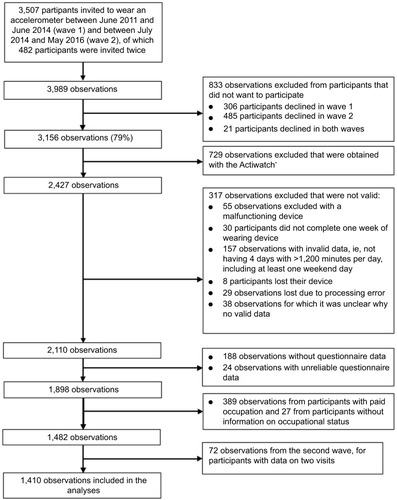
Participants were invited to wear an accelerometer and fill out a PA questionnaire between June 2011 and June 2014 (wave 1) and between July 2014 and May 2016 (wave 2). Participants were included in the analysis if they had valid accelerometer data (>1,200 min/day) for at least 4 days, including one weekend day. A total of 24 cases were excluded because of unreliably high (ie, higher than the mean + three times the standard deviation) levels of data on self-reported PA (). Since the PA questionnaire used in the Rotterdam Study did not cover occupational activity, we also excluded participants with paid occupation (n=389) or without information on occupational status (n=27). Additionally, because 72 participants participated in both waves, we excluded observations from the second wave of these participants to avoid clustering of data. In the current analyses, we included 1,410 adults aged 50+ years with data on both objective and subjective PA. All subjects gave written informed consent.
Figure 1 Flowchart of participant inclusion in the Rotterdam Study.
Questionnaire-assessed physical activity
After the home interview, participants received the PA questionnaire and were requested to hand in their questionnaire during their first research-center visit. Questionnaire PA was assessed with the self-administered LASA Physical Activity Questionnaire (LAPAQ), a validated questionnaire with reasonably good test–retest reliability (0.65–0.75).Citation18 Correlations with a pedometer and 7-day diary were 0.56 and 0.68, respectively.Citation18 The LAPAQ includes questions on the frequency and duration of walking, cycling, sports (including two open-ended questions in which participants could report “other sports” they participated in), gardening, and housework. Participants reported how many hours/week they had spent in each activity in the previous 2 weeks. Detailed information on the assessment of questionnaire-derived PA can be found elsewhere.Citation19 We used metabolic equivalent of task (MET) to quantify activity intensity. MET values were assigned to all activities in the questionnaire, using a compendium of activity energy costs.Citation20 Of all other activities, 18 (3.2%) were not sports and 28 (5.1%) were not in the compendium (eg, physiotherapy training, indoor sports, revalidation). No MET values were assigned to these activities, and they were not included in the analyses. Duration in total PA was computed by summing time spent in all activities mentioned in the questionnaire.
To be able to evaluate whether differences in total PA were driven by a particular intensity category (ie, light, moderate, or vigorous PA), we categorized activities into three groups. Activities with MET values lower than 3 were coded as light-intensity PA, 3–6 MET was coded as moderate-intensity PA, and ≥6 MET was coded as vigorous-intensity PA.Citation21
Accelerometer-assessed physical activity
At the first center visit, participants were requested to wear a triaxial accelerometer (GeneActiv; ActivinsightsLtd, Kimbolton, UK) on the nondominant wrist for 7 consecutive days and nights. Since the GeneActiv device is waterproof, the device can also be worn while bathing and swimming. The accelerometer was sampled at 50 Hz and acceleration was expressed relative to gravity (1 g = 9.81 m/secondCitation2).Citation9,Citation22,Citation23 Data were extracted from the first wearing day up to 7 days later, and all days with ≥1,200 minutes of data were included.
To quantify the acceleration related to registered movement, we calculated the high-pass filtered vector magnitude. This approach applies a high-pass filter with a cutoff frequency of 0.2 Hz to the acceleration signal, treating gravity as a low-frequency component that is filtered out.Citation24 Accelerometer data were processed in Python (2.6.6) with the open-access Pampro software, a program for the systematic analysis of PA data collected in epidemiological studies.Citation25 Nonwear time was defined as all time periods where the standard deviation of acceleration in each of the three axes fell below 13 mg for over 1 hour.Citation24 Any nonwear period was excluded from analyses. The pattern of nonwear time was accounted for by balancing the weighting of the data according to the diurnal profile.Citation26
Activity was categorized into sedentary (<48 mg), light (48–154 mg), moderate (154–389 mg), and vigorous activity (>389 mg), based on a recent validation study in 1,695 middle-aged adults (mean age 50 years).Citation24 Because not all participants wore the watch for 7 days, data were recoded such that our measures reflected PA over a 1-week course to match the questionnaire data. Average duration in light, moderate, and vigorous PA was calculated for weekdays and weekend days. Consequently, the weekly accelerometer-assessed total PA was calculated as ([5× mean daily duration in total PA on weekdays] + [2× mean daily duration in total PA on weekend days]).
Assessment of factors
Self-reported alcohol use was obtained with a food-frequency questionnaire, expressed in grams/day, and categorized in tertiles. Socioeconomic status was evaluated by education, assessed in consonance with the international standard classification of education and categorized as primary, lower, intermediate, and higher education.Citation27 Smoking was categorized in three categories: current, former, and never. Body-mass index (BMI) was calculated using height and weight and defined as normal weight (<25 kg/m2), overweight (25–30 kg/m2), and obese (≥30 kg/m2). Marital status was defined as living with a partner or not. Disability was assessed by activities of daily living, from the Stanford Health Assessment Questionnaire Disability Index.Citation28 For descriptive purposes, disability was defined as a disability score value >0.5 and severe disability as a disability score value >1.Citation29 The presence of coronary heart disease, diabetes, stroke, and cancer were determined using medical records up to the year 2012 to define the number of comorbidities. Depressive symptoms were assessed with the Center for Epidemiologic Studies Depression (CESD) scale,Citation30 a self-report scale with 20 items and a maximum score of 60. A score of 16 or greater is traditionally accepted as the cutoff to define clinical depression,Citation31 and was used for descriptive purposes. Cognitive function was assessed with the Mini-Mental State Examination (MMSE).Citation32 MMSE scores range from 0 to 30, with a higher score indicating better cognitive performance. We used a cutoff of 26 to categorize participants as having a cognitive impairment in our descriptive analysis.Citation33
Statistical analyses
Descriptive statistics were used to characterize the sample. The difference in time spent in PA according to questionnaire and accelerometer was examined using a paired-samples t-test, and the Bland–Altman method was used to visualize the level of (dis)agreement between questionnaire- and accelerometer-derived PA levels. We assessed the Spearman correlation between questionnaire- and accelerometer-derived PA in the total population and separately for the following categories: age-group (ie, 50–60 years, 60–70 years, 70–80 years, >80 years), sex, education, marital status, smoking status, BMI category, alcohol consumption, disability, prevalent chronic disease, cognitive function, and prevalent depression. Since the Spearman correlation coefficient is equal to the slope of the regression between the ranked values of the questionnaire and accelerometer, we used linear regression models to obtain correlation coefficients and corresponding 95% confidence intervals using accelerometer-derived PA as the dependent variable.
For our main analyses, we devised two measures of disagreement, in resemblance with previous research.Citation34 First, we computed the level of disagreement, expressed as the absolute time difference between questionnaire- and accelerometer-assessed PA. Second, we computed the direction of disagreement, indicating whether an individual had the tendency to overestimate or underestimate PA, by subtracting accelerometer-assessed PA from questionnaire-derived PA levels. To assess the association between assessed factors and the level and direction of disagreement, we used linear regression analyses with the level and direction of disagreement as outcome variables, including all demographic, lifestyle, and health variables, total PA measured by the accelerometer, time between interview date and the first accelerometer-wear date, cohort, and wave. Age, CESD score, disability index, MMSE score, and number of comorbidities were used as continuous variables in these analyses. To quantify if the association was dependent on the level of PA, β-values (95% CI) for the association of accelerometer-derived PA, expressed in hours/week, with the level and direction of disagreement were also obtained from these analyses.
We performed several sensitivity analyses. We compared baseline characteristics for those agreeing to wear an accelerometer versus those who rejected, and in those with paid occupation versus those without paid occupation. Next, we examined the level and direction of disagreement in each intensity category of PA (light, moderate, and vigorous). Additionally, we repeated the analyses in a population also including participants with paid occupation. In these analyses, we additionally included occupational status as a covariate. Moreover, because accelerometers do not measure cycling accurately, we repeated the analyses in those that did not report any cycling.
Our figures contained 49.1% missing data on alcohol use. Other covariates had <2% missing data. We imputed missing data using Markov chain Monte Carlo multiple imputation (n=20 imputations). All analyses were performed using IBM SPSS Statistics for Windows (IBM, Armonk, NY, USA) and R version 3.2.1 (R Foundation for Statistical Computing, Vienna, Austria). Statistical significance was set at P<0.05.
Results
Participants who agreed to wear an accelerometer were slightly younger, more often men, and showed a better health profile with regard to MMSE score, CESD score, and disability score than those who did not agree to wear an accelerometer (). The participants included in our study had a mean age of 73.8 (SD 7.6) years, and 742 (52.6%) were female (). The mean (SD) daily wearing time of the accelerometer was 23.8 (0.3 hours), and the median time difference between the interview and the first accelerometer-wear date was 8.7 weeks (interquartile range: 5.1–13.7). The mean (SD) weekly time spent in PA was 1,579.3 (386.1) minutes according to the accelerometer and 1,049.9 (1,108.3) minutes according to the questionnaire (P<0.001), indicating that overall, total PA was underestimated in the questionnaire. This is also visualized in the Bland–Altman plot in . The Spearman correlation was 0.30 (95% CI 0.25–0.34) in the total sample, and differed as a function of education, disability, smoking status, depressive symptoms, and cognitive function ().
Table 1 Characteristics of the study population (n=1,410)
Table 2 Spearman correlation between questionnaire-assessed total physical activity and accelerometer-assessed total physical activity, according to characteristics of the study population
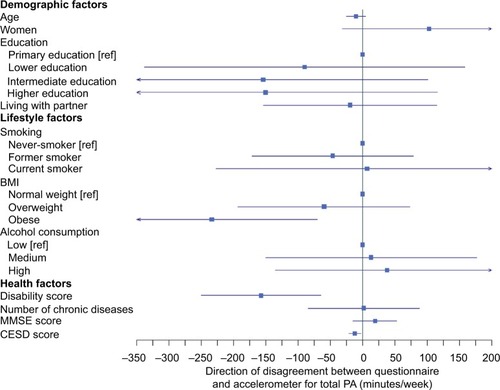
For every 1 hour/week more accelerometer-derived PA, the level of disagreement was 30.2 minutes/week more (95% CI 23.6–36.7, P<0.001). Independently of PA volume, those with intermediate and higher education showed smaller differences between the questionnaire PA and accelerometer PA than those with primary education (). No other determinants were associated with the level of disagreement.
Figure 2 Factors associated with level of disagreement (ie, absolute difference) between accelerometer and questionnaire physical activity.
Abbreviations: BMI, body-mass index; CESD, Center for Epidemiologic Studies Depression; MMSE, Mini-Mental State Examination; PA: physical activity; ref, reference.
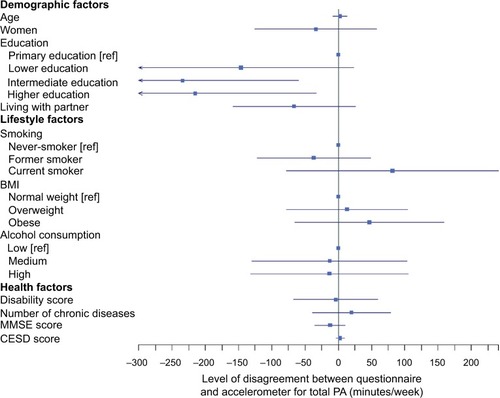
For every 1 hour/week more accelerometer-derived PA, questionnaire PA was underestimated more by 29.1 minutes (95% CI −38.6 to −19.6, P<0.001). Results of regression analyses with direction of disagreement are presented in . Independently of PA volume, obese participants underestimated their self-reported PA levels more than normal-weight participants (β=−234.3 minutes/week, 95% CI −398.2 to −70.5; P=0.002). Additionally, the underestimation of self-reported PA in the questionnaire was larger for participants with higher disability and CESD scores ().
Figure 3 Factors associated with the direction of disagreement between accelerometer and questionnaire physical activity.
Abbreviations: BMI, body-mass index; CESD, Center for Epidemiologic Studies Depression; MMSE, Mini-Mental State Examination; PA, physical activity.
Sensitivity analyses showed that light and vigorous PA were underestimated by the questionnaire (mean [SD] 708.4 [484.3] minutes/week and 25.6 [338.1] minutes/week, respectively), whereas the level of moderate PA was on average overestimated by 204.6 minutes/week (SD 780.8) (). In analyses with light, moderate, and vigorous PA, factors associated with the level and direction of disagreement were similar to the main analyses ( and ). When comparing those with and without paid occupation, we observed that those with paid occupation were younger, more highly educated, and showed a better health profile regarding CESD score, MMSE score, and disability score (). In sensitivity analyses on those with paid occupation (n=1,823), the level and direction of disagreement were larger compared to the main analyses (mean [SD] 971.8 [788] minutes/week and −589 [1,104] minutes/week, respectively). Factors associated with the disagreement were similar to the sample included in the main analyses (). In those not reporting cycling (n=692), factors associated with the direction of disagreement were equal compared to the sample included in the study (), although some associations were no longer significant.
Discussion
The aim of the current study was to quantify the level and direction of disagreement between questionnaire- and accelerometer-assessed PA and to investigate if sociodemographic, lifestyle, and health factors could explain differences in agreement. We found that the overall agreement between the LAPAQ and a wrist-worn accelerometer was low and that it differed across lifestyle and health variables. The level of disagreement was higher in less educated individuals. In addition, obese individuals, those with a higher disability score, and those with more depressive symptoms underreported PA more in the questionnaire compared to the reference group. Moreover, with higher levels of accelerometer-derived PA, the underestimation of PA in the questionnaire was more obvious.
The low correlation between accelerometer- and questionnaire-derived PA observed in the current study (r=0.30) was similar to results reported in previous studies in older adults,Citation2,Citation9 but lower than another study using the LAPAQ in 439 adults aged 69–92 years (r=0.56).Citation18 This difference might be related to study design, as participants in Stel et al wore a pedometer directly after filling out the LAPAQ,Citation18 whereas in the current study the time between questionnaire- and accelerometer-assessment had a median value of 8.7 weeks. Moreover, in Stel et al,Citation18 participants additionally completed a 7-day diary while wearing the pedometer, which might have altered their PA patterns, due to increased awareness. Furthermore, in contrast to most studies, but similar to the study of Sabia et al,Citation9 our participants wore the accelerometer around the wrist. There is general consensus that a wrist-worn accelerometer is worse in estimating activity during large-muscle, dynamic activities like cycling than a hip-worn device.Citation35 This could lead to an underestimation of PA performed solely by the legs.Citation10,Citation11 Moreover, when the wrist is constrained during PA, eg, when carrying a briefcase or groceries, the PA level will likely be underestimated.Citation35 Considering the fact that these activities are usually of light–moderate activity, the agreement between questionnaire and accelerometer might be different for hip-worn accelerometers for these intensity domains.
However, an advantage of the wrist-worn accelerometer is that it allows for 24 hours of data collection per day, including during water-based activities, leading to a comprehensive overview of daily PA. This is in contrast to hip-worn devices that have to be removed during the night and are usually not waterproof. However, since the correlation between PA derived from questionnaires and accelerometers observed in the current study was similar to correlations in studies using hip-worn devices,Citation2,Citation9 the high compliance of the wrist-worn accelerometers is unlikely to enhance the comparability between questionnaire and accelerometer.
In the total population, we found that compared to the accelerometer, the questionnaire on average underestimated PA levels by 529 minutes/week, equivalent to 76 minutes/day. This difference could be explained by missing items on the questionnaire that are measured by the accelerometer, including climbing stairs, walking within shops, playing with domestic animals, and dressing and cleaning oneself. These kinds of activities could add up to over 1 hour per day. An additional explanation for the underestimation of PA in the questionnaire could be that some activities are of very short duration (<1 minute), and thus might not be recalled by the participants when filling in the questionnaire, whereas the accelerometer accumulates all these small bouts of activity. These two explanations might be especially important for light activity, for which we found that in the total population, weekly light PA was 708 minutes/week (corresponding to 1.75 hours per day) lower according to questionnaires compared to accelerometers (), which is in line with previous evidence.Citation36,Citation37
To our knowledge, we are the first to report that more depressive symptoms and disability are associated with larger underestimation in the questionnaire compared to the accelerometer. An explanation could be that those with depressive symptoms or disability have a more pessimistic estimate of their PA levels than their counterparts. In other research domains, depressive symptoms have also been associated with reporting bias,Citation38 and it has been suggested that individuals suffering from depression process information about the self in a maladaptive fashion compared to their healthier counterparts.Citation39 For example, in a study on the agreement between self-reported and actigraphy-assessed sleep, participants with more depressive symptoms reported lower sleep duration than was measured using actigraphy.Citation34 In the same study, higher levels of functional disability were associated with larger absolute differences between self-reported and actigraphic sleep, indicating that being disabled might affect self-reported levels in domains other than PA as well.
Furthermore, our findings showed that the absolute difference between questionnaire and accelerometer was highest in those with primary education, although there was no difference between educational groups regarding the direction of this disagreement. This indicates that the degree of underreporting differs for participants with a low education, which is canceled out in the absolute difference between questionnaire and accelerometer. Finally, obese individuals underreported their total PA more than normal-weight participants, which is contradictory to previous research showing overreporting of PA in questionnaires.Citation15,Citation40 However, in line with our observation, a study among 365 young and middle-aged adults found that participants who underestimated their PA levels were more likely to have a higher BMI.Citation41 In this regard, it is possible that those with obesity perceive their PA levels as inadequate, because of the belief that they could not have been obese with adequate PA levels.Citation41,Citation42
The results of our study may have implications for current and future practice on PA measurements. Considering the increase in the use of accelerometers in current research, researchers need to be aware that results between studies using either questionnaires or accelerometers should be compared with caution. Importantly, the disagreement increased with higher levels of accelerometer-derived PA. More detailed instructions in the questionnaire may be needed,Citation43 and questionnaires might need to be improved to capture the overall PA pattern of older adults better. To this aim, future studies should focus on enhancing the agreement between questionnaire- and accelerometer-derived PA levels. Moreover, individuals working in clinical practice should be aware that especially those with worse perceived health might not have a realistic view of their PA levels. Asking more thoroughly about their activities could provide more information than a simple question on whether they perceive their PA as sufficient or not. Furthermore, the large discrepancy between accelerometer- and questionnaire-derived PA in those with paid occupations found in our sensitivity analysis implies that studies using questionnaires in working populations should always include occupational PA.
The use of accelerometers could also be improved in future studies to measure activities performed solely with the lower extremities more accurately. The bias between questionnaire and accelerometer might be reduced by future efforts to develop specified algorithms that can identify these activities, taking into account their specific rhythm when wearing an accelerometer. Moreover, our findings that (perceived) health and educational status can influence reported PA stresses the importance of taking into account these factors in future studies and analyses. Finally, regardless of the (dis)agreement between questionnaires and accelerometers, both methods should be used simultaneously in research to gain the most information. Whereas accelerometers provide an accurate distribution of intensity and duration, questionnaires might more accurately reflect perceived PA. In order to be able to influence the PA levels of individuals, both sources of information are important. We would thus recommend that for all individuals, including those with higher BMI, more depressive symptoms, and more disability, PA be measured using both methods whenever possible.
Our study contains several strengths. We are one of the first to examine both the correlation and disagreement between PA as derived from questionnaire and a wrist-worn accelerometer in a large community-based cohort of older adults, using a wide variety of determinants. Moreover, the use of a waterproof wrist-worn accelerometer ensured high compliance. Consequently, this ensured low nonwear periods in which assumptions would have to be made on whether this time was spent actively or sedentarily.Citation44,Citation45 As a result, PA is generally assessed more precisely.Citation45
However, some limitations also have to be acknowledged. First, the PA estimates derived from the accelerometer and questionnaire were not obtained in the same week. This might have contributed to the low agreement in the current study. However, addressing questionnaires and accelerometers simultaneously might make participants more aware of their behavior and result in larger agreement than otherwise obtained.Citation43 Second, we did not have up-to-date information on cancer, cardiovascular disease, or diabetes. Consequently, some residual confounding might have been present, which can result in bias towards the null. Third, our results are based on the difference between the LAPAQ and the wrist-worn GeneActiv accelerometer. As such, our findings might not be generalizable to other questionnaires or hip-worn accelerometers. Fourth, using accelerometers providing raw output in milligravity is relatively new, and thus the cutoff points to define activity intensity have not been firmly established. Therefore, the use of different cutoffs might shift the distribution of time spent in light, moderate, and vigorous PA according to the accelerometer. Furthermore, we measured PA during 1 week, which might not represent overall engagement in PA. Additionally, participants that agreed to wear an accelerometer were more often men and showed a better health profile regarding MMSE score, CESD score, and disability score. This might affect generalizability toward the total population of older adults. Finally, the current participants were from a Dutch population, with relatively high levels of PA compared to other Western countries.Citation46 Considering the fact that the disagreement in the current study was higher for higher levels of accelerometer-derived PA, the disagreement between questionnaire- and accelerometer-derived PA might be lower in countries with generally lower PA levels.
In conclusion, we observed that correspondence between questionnaire- and accelerometer-derived PA is low. In the total population, the number of minutes per week spent in PA was in general underestimated in the questionnaire. This was a consequence of underreporting light PA, whereas moderate PA was overreported in the questionnaire. These differences were partly explained by BMI, disability, and depressive symptoms, as participants with higher BMI and more disability and depressive symptoms underestimated their self-reported PA more than their healthier counterparts. Moreover, the underestimation was larger with higher levels of accelerometer-derived PA. Future studies using questionnaires and/or accelerometers to measure PA should be aware of these differences.
Data sharing statement
Data can be obtained upon request. Requests should be directed to the management team of the Rotterdam Study ([email protected]), which has a protocol for approving data requests. Because of restrictions based on privacy regulations and informed consent of the participants, data cannot be made freely available in a public repository.
Author contributions
CMK, JDS, and OHF had the original idea for the study. CMK participated in analyses and interpretation of the data and drafted the article. All authors contributed toward data analysis, drafting and critically revising the manuscript for important intellectual content, gave final approval of the version to be published, and agree to be accountable for all aspects of the work.
Acknowledgments
This work was supported by a Netherlands Organization for Scientific Research grant (017.106.370) awarded to HT. The Rotterdam Study is funded by the Erasmus Medical Center and Erasmus University Rotterdam, the Netherlands Organization for the Health Research and Development, the Research Institute for Diseases in the Elderly, the Ministry of Education, Culture, and Science, the Ministry for Health, Welfare, and Sports, and the European Commission. We thank the staff of the Rotterdam Study and the participating general practitioners and pharmacists.
Supplementary materials
Figure S1 Bland–Altman plot for total physical activity.
Abbreviations: PA, physical activity; SD, standard deviation.
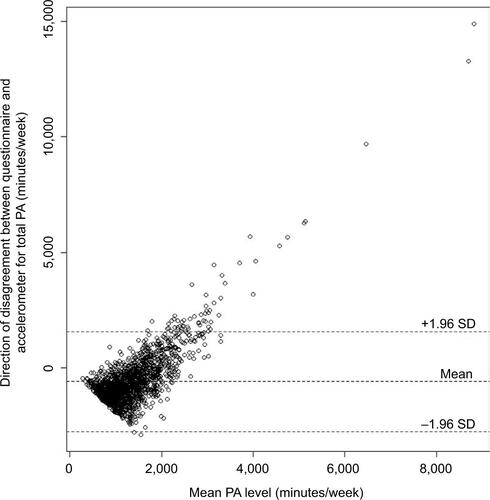
Table S1 Characteristics of those who agreed to participate (N=3,156) and those who did not agree to participate (N=833)
Table S2 Characteristics of light, moderate, and vigorous PA in the total population
Table S3 Factors associated with the level of disagreement between accelerometer and questionnaire PA, according to intensity of PA
Table S4 Factors associated with the direction of disagreement between accelerometer and questionnaire PA according to intensity of PA
Table S5 Characteristics of the study population, stratified by occupational status
Table S6 Factors associated with level and direction of disagreement between accelerometer and questionnaire PA, including participants with paid occupation (n=1,823)
Table S7 Factors associated with the level and direction of disagreement between accelerometer and questionnaire PA in those not reporting cycling (n=692)
Disclosure
CMK, JDS, OHF and MC work in ErasmusAGE, a center within the Erasmus Medical Center for aging research across the life course funded by Nestlé Nutrition (Nestec Ltd.), Metagenics Inc., and AXA. The authors report no conflicts of interest in this work.
References
- World Health OrganizationGlobal Status Report on Noncommunicable Diseases 2010GenevaWHO2010
- SkenderSOseJChang-ClaudeJAccelerometry and physical activity questionnaires: a systematic reviewBMC Public Health20161651527306667
- SallisJFSaelensBEAssessment of physical activity by self-report: status, limitations, and future directionsRes Q Exerc Sport200071Suppl 2114
- SchmidDRicciCLeitzmannMFAssociations of objectively assessed physical activity and sedentary time with all-cause mortality in US adults: the NHANES studyPLoS One2015103e011959125768112
- EnsrudKEBlackwellTLCauleyJAObjective measures of activity level and mortality in older menJ Am Geriatr Soc201462112079208725367147
- WesterterpKRPhysical activity assessment with accelerometersInt J Obes Relat Metab Disord199923Suppl 3S45S4910368002
- ScheersTPhilippaertsRLefevreJAssessment of physical activity and inactivity in multiple domains of daily life: a comparison between a computerized questionnaire and the SenseWear armband complemented with an electronic diaryInt J Behav Nutr Phys Act201297122691823
- PrinceSAAdamoKBHamelMEHardtJGorberSCTremblayMA comparison of direct versus self-report measures for assessing physical activity in adults: a systematic reviewInt J Behav Nutr Phys Act200855618990237
- SabiaSvan HeesVTShipleyMJAssociation between questionnaire- and accelerometer-assessed physical activity: the role of sociodemographic factorsAm J Epidemiol2014179678179024500862
- RosenbergerMEHaskellWLAlbinaliFMotaSNawynJIntilleSEstimating activity and sedentary behavior from an accelerometer on the hip or wristMed Sci Sports Exerc201345596497523247702
- SwartzAMStrathSJBassettDRJrO’BrienWLKingGAAinsworthBEEstimation of energy expenditure using CSA accelerometers at hip and wrist sitesMed Sci Sports Exerc2000329 SupplS450S45610993414
- ChenKYBassettDRJrThe technology of accelerometry-based activity monitors: current and futureMed Sci Sports Exerc20053711 SupplS49050016294112
- ShiromaEJCookNRMansonJEBuringJERimmEBLeeIMComparison of self-reported and accelerometer-assessed physical activity in older womenPLoS One20151012e014595026713857
- MilesJShevlinMApplying Regression and Correlation. A Guide for Students and ResearchersLondonSage2001
- SlootmakerSMSchuitAJChinapawMJSeidellJCvan MechelenWDisagreement in physical activity assessed by accelerometer and self-report in subgroups of age, gender, education and weight statusInt J Behav Nutr Phys Act200961719320985
- DongLBlockGMandelSActivities contributing to total energy expenditure in the United States: results from the NHAPS studyInt J Behav Nutr Phys Act200411415169563
- IkramMABrusselleGGOMuradSDThe Rotterdam Study: 2018 update on objectives, design and main resultsEur J Epidemiol201732980785029064009
- StelVSSmitJHPluijmSMVisserMDeegDJLipsPComparison of the LASA physical activity questionnaire with a 7-day diary and pedometerJ Clin Epidemiol200457325225815066685
- KoolhaasCMDhanaKvan RooijFJSchoufourJDHofmanAFrancoOHPhysical activity types and health-related quality of life among middle-aged and elderly adults: the Rotterdam studyJ Nutr Health Aging Epub201739
- AinsworthBEHaskellWLHerrmannSD2011 Compendium of Physical Activities: a second update of codes and MET valuesMed Sci Sports Exerc20114381575158121681120
- HaskellWLLeeIMPateRRPhysical activity and public health: updated recommendation for adults from the American College of Sports Medicine and the American Heart AssociationCirculation200711691081109317671237
- HildebrandMvan HeesVTHansenBHEkelundUAge group comparability of raw accelerometer output from wrist- and hip-worn monitorsMed Sci Sports Exerc20144691816182424887173
- da SilvaICvan HeesVTRamiresVVPhysical activity levels in three Brazilian birth cohorts as assessed with raw triaxial wrist accelerometryInt J Epidemiol20144361959196825361583
- WhiteTWestgateKWarehamNJBrageSEstimation of physical activity energy expenditure during free-living from wrist accelerometry in UK adultsPLoS One20161112e016747227936024
- WhiteTPampro: physical activity monitor processing2016 Available from: https://github.com/thomite/pamproAccessed December 1, 2016
- BrageSWestgateKWijndaeleKGodinhoJGriffinSWarehamNEvaluation of a method for minimizing diurnal information bias in objective sensor dataPoster presented at: 3rd International Conference on Ambulatory Monitoring of Physical Activity and MovementJune 17–19, 2013Amherst, MA
- International Standard Classification of Education (ISCED)United Nations Educational, S.a.C.O.U. Division of Statistics and Education; Office of Statistics; UNESCO1976 Available from: https://unstats.un.org/unsd/iiss/International-Standard-Classification-of-Education-ISCED.ashx
- FriesJFSpitzPKrainesRGHolmanHRMeasurement of patient outcome in arthritisArthritis Rheum19802321371457362664
- OddingEValkenburgHAStamHJHofmanADeterminants of locomotor disability in people aged 55 years and over: the Rotterdam StudyEur J Epidemiol200117111033104112380718
- RadloffLSThe CES-D scale a self-report depression scale for research in the general populationAppl Psychol Meas197713385401
- McDowellIMeasuring Health: A Guide to Rating Scales and QuestionnairesOxfordOxford University Press2006
- FolsteinMFFolsteinSEMcHughPR“Mini-mental state”: a practical method for grading the cognitive state of patients for the clinicianJ Psychiatr Res19751231891981202204
- KukullWALarsonEBTeriLBowenJMcCormickWPfanschmidtMLThe Mini-Mental State Examination score and the clinical diagnosis of dementiaJ Clin Epidemiol1994479106110677730909
- Van Den BergJFVan RooijFJVosHDisagreement between subjective and actigraphic measures of sleep duration in a population-based study of elderly personsJ Sleep Res200817329530218321246
- RosenbergerMEHaskellWLAlbinaliFMotaSNawynJIntilleSEstimating activity and sedentary behavior from an accelerometer on the hip or wristMed Sci Sports Exerc201345596497523247702
- España-RomeroVGolubicRMartinKRComparison of the EPIC physical activity questionnaire with combined heart rate and movement sensing in a nationally representative sample of older British adultsPLoS One201492e8708524516543
- PetersTMShuXOMooreSCValidity of a physical activity questionnaire in ShanghaiMed Sci Sports Exerc201042122222223020404770
- KornCWSharotTWalterHHeekerenHRDolanRJDepression is related to an absence of optimistically biased belief updating about future life eventsPsychol Med201444357959223672737
- American Psychiatric AssociationDiagnostic and Statistical Manual of Mental Disorders5th edArlington (VA)APA2013
- WarnerETWolinKYDuncanDTHeilDPAskewSBennettGGDifferential accuracy of physical activity self-report by weight statusAm J Health Behav201236216817822370255
- WatkinsonCvan SluijsEMSuttonSHardemanWCorderKGriffinSJOverestimation of physical activity level is associated with lower BMI: a cross-sectional analysisInt J Behav Nutr Phys Act201076820854659
- van SluijsEMGriffinSJvan PoppelMNA cross-sectional study of awareness of physical activity: associations with personal, behavioral and psychosocial factorsInt J Behav Nutr Phys Act200745317996060
- LeePHYuYYMcDowellILeungGMLamTHStewartSMPerformance of the international physical activity questionnaire (short form) in subgroups of the Hong Kong Chinese populationInt J Behav Nutr Phys Act201188121801461
- ZhangSRowlandsAVMurrayPHurstTLPhysical activity classification using the Genea wrist-worn accelerometerMed Sci Sports Exerc201244474274821988935
- DieuOMikulovicJFardyPSBui-XuanGBeghinLVanhelstJPhysical activity using wrist-worn accelerometers: comparison of dominant and non-dominant wristClin Physiol Funct Imaging201737552552926749436
- SjöströmMOjaPHagströmerMSmithBJBaumanAHealth-enhancing physical activity across European Union countries: the Eurobarometer studyJ Public Health2006145291300