
Abstract
Background
Hematology–oncology patients often become severely thrombocytopenic and receive prophylactic platelet transfusions when their platelet count drops below 10×109 platelets/L. This so-called “platelet count trigger” of 10×109 platelets/L is recommended because currently available evidence suggests this is the critical concentration at which bleeding risk starts to increase. Yet, exposure time and lag time may have biased the results of studies on the association between platelet counts and bleeding risks.
Methods
We performed simulation studies to examine possible effects of exposure time and lag time on the findings of both randomized trials and observational data.
Results
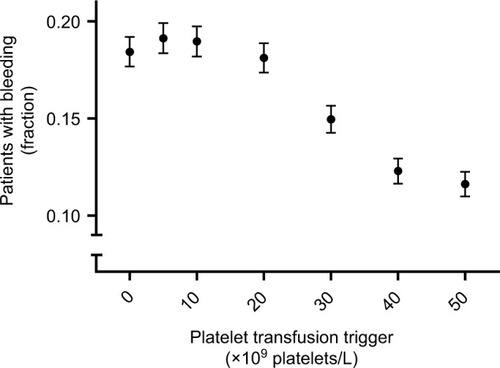
Exposure time and lag time reduced or even reversed the association between the risk of clinically relevant bleeding and platelet counts. The frequency of platelet count measurements influenced the observed bleeding risk at a given platelet count trigger. A transfusion trigger of 10×109 platelets/L resulted in a severely distorted association, which closely resembled the association reported in the literature. At triggers of 0, 5, 10, and 20×109 platelets/L the observed percentages of patients experiencing bleeding were 18, 19, 19, and 18%. A trigger of 30×109 platelets/L showed an observed bleeding risk of 16% and triggers of 40 and 50×109 platelets/L both resulted in observed bleeding risks of 13%.
Conclusion
The results from our simulation study show how minimal exposure times and lag times may have influenced the results from previous studies on platelet counts, transfusion strategies, and bleeding risk and caution against the generally recommended universal trigger of 10×109 platelets/L.
Introduction
Hematology–oncology patients often become thrombocytopenic and dependent on platelet transfusions for the prevention of spontaneous bleeding.Citation1,Citation2 Currently, these platelet transfusions are given prophylactically, mostly when the patient’s platelet count drops below 10×109 platelets/L.Citation2,Citation3
Under the current platelet transfusion policy, half the transfused patients still experience some bleeding. This bleeding is observed mostly in acute myeloid leukemia patients, 6%–7% of whom experience serious to life-threatening bleeding (ie, World Health Organization grades 3 and 4; resulting in mortality or lasting morbidity, or requiring medical intervention).Citation4–Citation8 It has been suggested that in some clinical circumstances patients should be transfused at higher platelet count triggers, to prevent bleeding.Citation2,Citation3 Conversely, some studies also suggest that for certain patients it might be safe to switch to a therapeutic, instead of a prophylactic, transfusion strategy.Citation7,Citation9
Furthermore, both the clinical circumstances dictating higher platelet count triggers and the exact triggers to be used in these circumstances have been shown to be poorly agreed upon.Citation1 Some progress in this field has recently been made. Several risk factors for bleeding and their relation to platelet counts were investigated using a recurrent-event analysis as a secondary (ie, observational) analysis of data from a randomized trial.Citation10 However, much more information is needed to reliably identify the few patients who need a much more intensive transfusion strategy and to distinguish them from the many who need fewer transfusions.
Bleeding is more likely to occur if a patient is exposed to low platelet counts.Citation11 However, the precise definition of “exposed to low platelet counts” is not straightforward. To cause bleeding, platelet counts have to drop below a certain threshold for longer than a certain minimally required time (ie, exposure time; ).Citation12,Citation13 The importance of a minimum exposure time is also supported by the notion that there is a “fixed platelet requirement” necessary to maintain vascular integrity.Citation14 If platelet counts are too low for too long, vascular integrity will gradually diminish and bleeding will eventually occur. The absolute requirement has been calculated to be around 7×10⁹ platelets/L/d.Citation14 Popular interpretation of this number is that it reflects an estimate of the number of platelets needed in circulation (ie, the minimally required platelet count). However, the number needed in circulation could conceivably be much higher. The calculated requirement reflects the number of platelets actually used to maintain vascular integrity, and a 100% efficient use of all platelets in circulation is exceedingly unlikely to ever be realized. Therefore, the threshold below which bleeding risk increases is probably higher, but remains a matter of speculation. Assuming the presence of such a threshold, to prevent bleeding, patients’ platelet counts should never stay below the threshold longer than the minimum exposure time. Achieving this goal with prophylactic platelet transfusions would then require first, identification of both the threshold and the minimum exposure time (ie, identifying the target) and second, setting a transfusion strategy that meets this target.
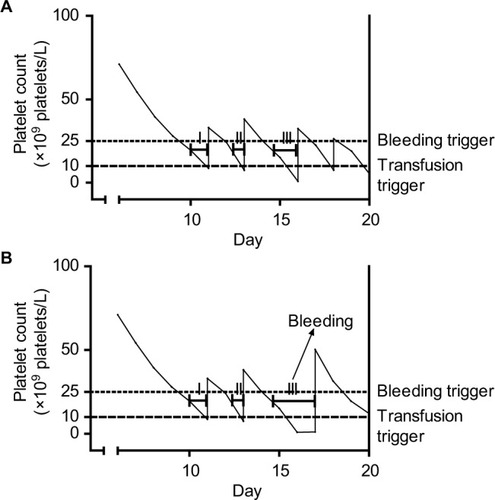
Figure 1 Platelet counts, platelet transfusions, and exposure time intervals in a single simulated patient with platelet counts performed every day (A) or every other day (B).
Identification of the target involves answering a complicated etiologic question. Setting an appropriate strategy involves prediction of the future course of platelet counts and the potential influence of transfusions on those counts. Running “trigger trials” (ie, randomized trials comparing the effectiveness of different platelet count triggers for prophylactic platelet transfusions in the prevention of bleeding) tries to tackle both these problems at once. Furthermore, both the required target and the influence of transfusions on platelet counts depend on many clinical risk factors.Citation2,Citation3,Citation15 Therefore, optimal triggers are also likely to be different for different patients. Choosing both the trigger to be tested and the patients to be included in a trial could be done much more efficiently if the relation between platelet counts, clinical risk factors, and bleeding was unambiguous.
Major problems in the interpretation of published data on this subject, both from randomized trials and observational research, stem from the effects of exposure time and lag time (ie, the time between completing the necessary exposure time and the actual occurrence of identifiable symptoms; ).Citation12,Citation13 These two time intervals can have a significant distortive influence on observed associations. Further, the frequency of platelet count measurements will influence the probability of reaching the minimum exposure time (). This frequency is likely to be lower in routine clinical practice than it is in randomized trigger trials, thereby further complicating the interpretation of results from such trials for normal clinical practice.
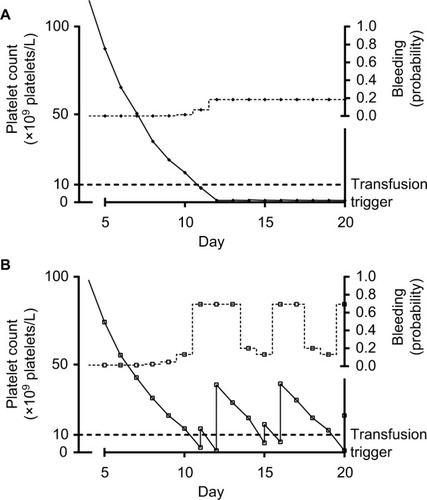
Figure 2 Platelet counts, platelet transfusions, and bleeding probability in two simulated patients.
The exact magnitude and even direction of the effects of exposure time and lag time on these associations are extremely difficult to understand intuitively. Simulation studies can be a powerful tool to explore the possible impact of difficult to intuit effects by artificially varying the responsible parameters. For this purpose, the exact values of these parameters do not even have to be biologically accurate, as long as their interrelatedness is reasonably correctly specified. We therefore performed simulation studies, based on realistic assumptions about the relation between platelet counts and bleeding risk, to create examples that illustrate the possible implications of these often counterintuitive and contradictory effects on data from both randomized trials and observational studies.
Methods
Simulation
All simulations were performed in the statistical package R.Citation16
Data from our database of 130 acute myeloid leukemia patients, undergoing remission induction treatment, were used to estimate realistic values for the gradual decrease of platelet counts in patients receiving myeloablative therapy and count increments after transfusions, during a 30 day admission period, without simulating repopulation. This study was approved by the medical ethics committee of the Leiden University Medical Center, which waived the need for informed consent. Since data would not be linked to identifying patient characteristics and data could be gathered without inconveniencing (ie, contacting) the patient, obtaining informed consent was considered a greater breach of privacy. Data from the literature were used to estimate the probability of refractoriness and bleeding.Citation9,Citation11,Citation15,Citation17,Citation18 We simulated 10,000 patients, with 30 admission days each for each arm of our seven armed “trigger trial” (ie, 2,100,000 patient-days of platelet count and bleeding data).
Platelet counts and platelet transfusions
Platelet count values were simulated by drawing from a normal distribution, as were daily decreases in platelet counts and the 24-hour count increments observed after platelet transfusions.
Mean starting platelet count was set at 246×109 platelets/L, with the standard deviation set at 69×109 platelets/L. Platelet counts were set to decrease on average by a fraction of 0.22 per day, until they fell below 7×10⁹ platelets/L, after which they were set to decrease with 1.54×10⁹ platelets/L (ie, 0.22×7×109 platelets/L) per day. The variation in decrease of the platelet count was simulated with the standard deviation for the decrease set at 4.3×10⁹ platelets/L, taking the absolute of the value drawn from a normal distribution with mean 0. Whenever the simulated decrease in platelet count was greater than the actual platelet count, the new platelet count was set to 1×10⁹ platelets/L.
Platelet transfusions were simulated to occur on the day the platelet count dropped below the specified transfusion trigger. Simulated platelet concentrations at which patients would receive a platelet concentrate transfusion, also “transfusion triggers” were 5, 10, 20, 30, 40, and 50×109 platelets/L. A trigger of 0×109 platelets/L was used to indicate no transfusions were given at any time. The effect of platelet transfusions was simulated with the mean increment of platelet concentration set at 21×109 platelets/L, with the standard deviation set at 12×109 platelets/L.
Refractoriness to platelet transfusions
Refractoriness (ie, the failure to show an adequate increase in platelet count in response to a platelet transfusion) was simulated by drawing from a uniform distribution, based on a set probability of 5% per transfusion. For simplicity, refractoriness of any etiology was set to be irreversible over the relatively short period simulated. This resulted, under current transfusion practice (ie, a transfusion trigger of 10×109 platelets/L), in approximately 25% refractoriness at day 20, increasing to 40% after continued transfusions.Citation15 The effect of refractoriness was set to be a diminishment of the transfusion effectiveness to 1% of the originally simulated 24-hour count increment.
Bleeding
Bleeding events were simulated by comparing the simulated platelet-dependent bleeding probability to a random number between 0 and 1. A new random number was drawn from a uniform distribution (ie, equal probabilities assigned to all possible values) for each patient-day. Bleeding was set to have occurred if the platelet-dependent bleeding probability was higher than the random number. The random number can therefore be thought of as the (inverse of) all patient specific bleeding risk (ie, if the random number was high, the patient had a low intrinsic bleeding risk and bleeding was unlikely to occur, even if the platelet-dependent bleeding probability was high). This platelet-dependent bleeding probability was simulated to vary from day to day by applying odds ratios for bleeding based on the simulated platelet count for that and the two previous days and bleeding events simulated to have occurred on the previous 2 days.
Odds ratios for bleeding based on platelet counts were applied at three different cut-off levels: 15×109, 25×109, and 50×109 platelets/L. Platelet counts between the second and third cut-off (ie, 25×109 to 50×109 platelets/L), without any bleeding during the previous 2 days, were considered to represent the baseline risk of bleeding, which was set at 0.5% per day.
Odds ratios of bleeding on the day the platelet count first dropped below the first cut-off (ie, 15×109 platelets/L) compared to the baseline risk of 0.5% was 1; the next day it was 3 and the second day it was 1. For the second cut-off (ie, 25×109 platelets/L), these odds ratios were 1, 3, and 5. For the third cut-off (ie, 50×109 platelets/L), the risk was reduced if platelet counts were above the cut-off and the odds ratios were 1, 0.5, and 0.5.
The current and previous 2 days together make up the combined exposure and lag times. The time window of 3 days, the cut-offs, and the odds ratios were all chosen for practical reasons, general biological plausibility, previous observations of time-varying associations of bleeding risk and platelet count (unpublished results), and the ability of the simulation to reproduce results from various published clinical trials on bleeding risk and platelet counts.Citation7,Citation9–Citation11,Citation15,Citation18–Citation24
All odds ratios were applied using a logistic transformation, to keep all probabilities between 0 and 1. All odds ratios were considered to be multiplicative, for example, odds ratios of bleeding were 5 after bleeding on the previous day and 2 after bleeding 2 days previously. The odds ratio for bleeding after bleeding on both of the previous 2 days was therefore 10 (ie, 5×2).
Bleeding events can be thought of as “clinically relevant,” for any given definition of clinically relevant. Different definitions would influence the bleeding incidence, but not the relation with other parameters. As further described, we also performed sensitivity analyses to explore the effect of differences in bleeding incidence.
Sensitivity analyses
Some sensitivity analyses were performed to explore the sensitivity of our conclusions to deviations from the assumptions used for the simulations. We incrementally reduced the probability of refractoriness (0.5% instead of 5%), the probability of bleeding (0.1% baseline risk, instead of 0.5%), and the platelet count below which bleeding risk increased (only below 5×10⁹ platelets/L).
Statistical analyses
No statistical tests were applied. In this simulation study, the sample size was arbitrarily set at 10,000 patients. Presence or absence of statistical significance is wholly uninformative in this setting, since the sample size could easily be reset at, for example, a hundred-fold higher or lower number. To give some indication of precision of our estimates, 95% confidence intervals were included in the figures.
Results
Simulation of platelet count profiles over time
All 10,000 simulated patients had steadily dropping platelet counts which were, by definition, never below 1×10⁹ platelets/L. Whenever their platelet count dropped below their prespecified transfusion trigger a simulated platelet concentrate transfusion was followed by an increase in platelet count. For an example of the first 25 patients simulated without transfusions and the first 25 patients simulated with a transfusion trigger of 50×109 platelets/L, see .
Exposure time and the frequency of platelet count measurements
shows platelet counts for a single simulated patient. Bleeding may occur if platelet counts stay below 25×109 platelets/L for more than 2 days. Each time the platelet count drops below 10×109 platelets/L, the patient receives a platelet transfusion and platelet counts increase accordingly.
shows the course of events if platelet counts are measured daily. This could, for example, represent a randomized trial testing the safety of a trigger of 10×109 platelets/L. This trigger would be deemed safe, even though the patient spends more than half her “transfusion-dependent” period below the safe threshold for bleeding (ie, 25×109 platelets/L).
shows the course of events if platelet counts are measured every other day. This could, for example, happen if we applied the results from the trial depicted in to daily clinical practice. The clinical course remains largely the same. However, at day 16, no platelet count will be performed, and therefore no transfusion will be given. This causes the minimum exposure time to be exceeded and bleeding to occur on day 17. The transfusion given on this day will be too late to prevent this bleeding.
Also note, due to underappreciation of the role of a minimum exposure time, we are likely to make a false assumption. In this case that the testing of a certain platelet count as a trigger for transfusion and determining bleeding risk will also provide a test for that particular count as a “trigger for bleeding.” This bleeding trigger may actually be higher than the investigated transfusion trigger, but we may not notice it because they are relatively close together. If these triggers are close together and platelet counts are measured frequently, patients are likely to receive a transfusion before their counts have remained under the bleeding trigger long enough to cause bleeding. Although bleeding is then indeed prevented, the causal mechanism behind it remains obscured. As a result, a seemingly harmless reduction in the frequency of count measurements can result in increased bleeding risk despite an equal transfusion strategy.
Lag time and platelet counts at time of bleeding
Another potential challenge in the interpretation of the observed association between platelet counts and bleeding risk originates from the presence of lag time (ie, the time between completing the necessary exposure time and the actual occurrence of identifiable symptoms). shows platelet counts and bleeding risk for two very different, both commonly encountered, patients. Both patient profiles would have a highly distortive influence on the observed association between morning platelet counts and bleeding. One patient is platelet transfusion refractory, but has a bleeding risk which is very insensitive to low platelet counts. The results from this patient yield a poor correlation between platelet counts and bleeding, because both are always low. The other patient has a bleeding risk which is very sensitive to platelet counts, but the risk is always lagging behind the platelet counts, due to the effect of the lag time. Therefore, as also schematically represented in , bleeding risk is low when counts are low and bleeding risk is high when counts are high. It is important to note that, although platelet transfusions in this simulation are given “too late to prevent bleeding,” in real life they would probably help stop the bleeding or prevent future bleeding. This, however, was beyond the scope of the current simulation, which, like many clinical studies, primarily considered start of first bleeding.
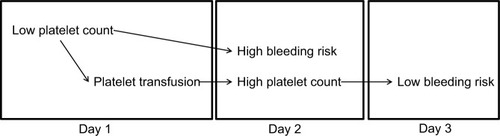
Figure 3 Association between high bleeding risk and high platelet count on day 2 is explained by confounding, caused by low platelet count on day 1, with platelet transfusion on day 1 as an intermediate.
Morning platelet counts and bleeding
The observed association between morning platelet counts and bleeding risks is depicted in . This association is strongly affected by transfusion trigger policy. shows the observed association under a policy of no transfusions and a policy of transfusions at a platelet count trigger of 10×109 platelets/L. similarly shows the no transfusions policy and a policy of a platelet count trigger of 50×109 platelets/L. Counterintuitively, a trigger of 50×109 platelets/L resulted in an association much closer to the one observed in the complete absence of transfusions than the trigger of 10×109 platelets/L.
Figure 4 Days with bleeding events according to the morning platelet count, for different platelet count triggers.
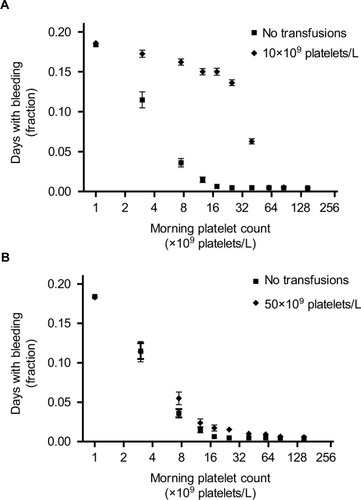
The explanation for this counterintuitive finding is that a high threshold for giving platelets (ie, a trigger of 50×109 platelets/L) does not lower bleeding risk at any given platelet count. Rather, the prevention of bleeding results from far fewer patient-days spent at low platelet counts (in this case, below 50×109 platelets/L), where the bleeding risk is highest. This lower number of patient-days also explains the much wider confidence intervals observed at these low platelet counts.
Platelet transfusion triggers and bleeding
As shown in , platelet count transfusion triggers between 5×10⁹ and 20×109 platelets/L had no effect on bleeding risk, compared to a policy of no transfusions. At transfusion triggers of 0, 5, 10, and 20×109 platelets/L 18%, 19%, 19%, and 18% of simulated patients bled, respectively. A simulation with a trigger of 30×109 platelets/L resulted in 16% of patients bleeding and triggers of 40 and 50×109 platelets/L both resulted in 13% of patients bleeding.
Figure 5 Patients with bleeding events, according to the platelet count used as a trigger for platelet transfusions.
Sensitivity analyses
Results of our sensitivity analyses are shown in and , corresponding to and from the main text. Results were very similar to those from the primary simulations. A different probability of refractoriness had almost no effect on the results. Both a lower baseline risk of bleeding and a lower bleeding trigger (ie, platelet count threshold for increase in bleeding risk) reduced bleeding incidence, but did not change the shape of the curves (ie, the relations between different parameters).
Discussion
We have reproduced the previously observed lack of association of bleeding with morning platelet counts in the range from 10×109 to 50×109 platelets/L, while also showing a clear influence of platelet counts in this same range on real bleeding risk. This seeming contradiction in observational data was explained by the combination of a lag period between low platelet count and bleeding complications on the one hand and the influence of platelet transfusions, received during this lag period, on platelet counts observed on the day of bleeding on the other hand.
The prominent effect of platelet transfusions on the observed association between morning platelet counts and bleeding risk was further illustrated by the counterintuitive effect of a very high transfusion trigger on this association. At a very high transfusion trigger (ie, 50×109 platelets/L), only refractory patients have low counts. All nonrefractory patients are kept at platelet counts with almost no bleeding risk. Since transfusions have a negligible effect on platelet counts in refractory patients, and nonrefractory patients experience negligible bleeding risk anyway, the observed risk closely mimics that of a policy without transfusions. This risk, however, applies to a much smaller group of patients (ie, only to the refractory patients). Conversely, the commonly used trigger of 10×109 platelets/L distorted the association between platelet counts and bleeding risk, and this distorted association closely resembled the association previously reported in the literature.Citation9,Citation11,Citation18
The main limitation of any simulation study is that it can never show which causal relations are present in real life. It can only show what observations you could expect under certain assumptions. We have therefore shown that our set of assumptions is at least one of the possible explanations that fit well with all published data on the association between platelet counts and bleeding: namely, that the combination of a minimal exposure time and a lag time can distort this association, obscuring the real platelet count thresholds relevant for bleeding risk. Further, through our sensitivity analyses, we show that our conclusions are not sensitive to quite severe violations of most of our assumptions. Finally, since all biological processes take time (ie, have both an exposure time and a lag time), we feel that the simulated data forms an illustrative example of the currently most likely explanation for observed associations of bleeding and platelet counts.
A minor limitation is that we lumped all patient related risk factors together into one random variable. This leaves those risk factors unspecified. This is, however, irrelevant to our main purpose of illustrating the effect of a lag period on the association between bleeding and platelet counts. We did simulate different background risks, against which the platelet count related risk operated, for different patients. This is sufficient to illustrate some of the counterintuitive relations between bleeding and platelet counts, especially in the presence of platelet transfusions.
Our primary simulations were based on data from acute myeloid leukemia patients undergoing remission induction treatment. However, our sensitivity analyses showed, among other things, that much lower baseline bleeding risk (ie, as observed in autologous transplant patients) did not affect our conclusions. Although it logically lowered the overall bleeding incidence, the relationships between bleeding and platelet counts and platelet transfusions at different triggers remained similar ().
Platelet transfusions are an accepted treatment modality in myelosuppressed thrombocytopenic patients. Therefore, the best clinical transfusion strategy is often investigated, whether explicitly stated or not, in randomized noninferiority trials.Citation6–Citation9,Citation21–Citation25 The rationale for this study design is that giving less transfusions is inherently better from a safety and costs perspective and a more restrictive strategy with noninferior clinical effectiveness is therefore always preferable.Citation26,Citation27 However, our data suggest these trials could be misleading. Trials comparing a trigger of 10×109 to a trigger of 20×109 platelets/L are likely to show noninferiority, or equivalence, simply because both have an equally low average effectiveness at preventing bleeding in a heterogeneous patient population. Irrespective of trial size, these trials then have no sensitivity to detect clinically relevant differences, because the comparator that is necessary to show this difference is never included, due to poor average effectiveness of the current treatment.
The majority of hemato-oncology patients are likely to need less transfusions than they currently receive.Citation7,Citation9 At least part of this majority could potentially even be treated effectively with therapeutic (ie, bleeding symptom-triggered) transfusions, as also suggested by subgroup analyses of a randomized trial.Citation7 A small subgroup of patients, however, experience severe bleeding, which is not prevented by current prophylactic transfusion strategies.Citation5,Citation9,Citation11 This subgroup therefore, likely requires a much more intensive transfusion strategy. We are currently not able to identify this subgroup with any level of certainty.Citation1,Citation9,Citation11 As a result, the average effectiveness of prophylactic platelet transfusions is very low. Most patients did not need these transfusions in the first place and can therefore never experience any benefits from them. Conversely, some patients, who could potentially experience benefits from an intensive transfusion regimen, are probably not receiving enough transfusions to experience any benefits. Increasing the effectiveness of current treatment will require a much better understanding of the causes of bleeding in this patient group and therefore more etiologic research.
Correctly specifying a relevant causal contrast, corresponding to a plausible biological mechanism, is crucial to all etiologic research.Citation12,Citation13,Citation28–Citation31 However, especially in light of the complicated relationship between patient related bleeding risk, lag period, platelet counts, and platelet transfusions, we often do not know what the most relevant causal contrast is. Therefore, a series of different potential causal contrasts should be investigated.Citation13 Given the limited resources and time, this endeavor should start with observational research. These observational studies, however, will always be at risk of confounding (mostly by indication). One possible solution is to first use observational research to provide us with reasonable hypotheses and then define clinically relevant causal contrasts and perform a powerful randomized trial, comparing the seemingly most appropriate intervention arms. To minimize the risk that the hypotheses generated by the observational research are invalid, due to confounding, each study needs customized methodology. This could, if possible in the specific situation under investigation, include powerful and innovative approaches like instrumental variable analyses and regression discontinuity analyses.Citation32,Citation33 These approaches, however, are not always applicable.Citation32–Citation34 Careful consideration of the statistical analyses and limitations of the study will therefore always be needed. One promising approach could be the combined use of prediction modeling and trajectory analyses.Citation35 This could identify patient groups which exhibit certain platelet count trajectories over time which predispose to higher bleeding risks.
Conclusion
The results from our simulation study show how minimal exposure times and lag times may have influenced the results from previous studies on platelet counts, transfusion strategies, and bleeding risk and caution against the generally recommended universal trigger of 10×109 platelets/L. While some patients could likely be switched to a therapeutic strategy, others might need more intensive prophylaxis. More in-depth understanding of the etiology of bleeding is needed to distinguish one from the other.
Author contribution
Rutger A Middelburg designed and conducted the research, analyzed and interpreted data, and wrote the manuscript. Jean-Louis H Kerkhoffs provided data and revised the manuscript. Johanna G van der Bom interpreted data and revised the manuscript. All authors contributed toward data analysis, drafting and critically revising the paper and agree to be accountable for all aspects of the work.
Data access and submission
The corresponding author Rutger A Middelburg had full access to the data and had final responsibility for the decision to submit. All authors have read the manuscript and approved of submission.
Acknowledgments
The authors thank Dr Jonathan Wallis for critical reading of an earlier version of the manuscript and valuable suggestions for improvements.
Supplementary material
Figure S1 Platelet counts and bleeding events in 25 simulated patients without platelet transfusions (A) or with a transfusion trigger of 50×109 platelets/L (B).
Notes: (A) First 25 patients from the simulation without platelet transfusions. (B) First 25 patients from the simulation with a platelet count trigger of 50×109 platelets/L. Each line represents the consecutive morning platelet counts of a single patient. Markers at the upper right represent bleeding events. Each line of markers represents a single patient’s days with bleeding events. Lines dropping to the bottom of the graph (B) indicate patients becoming refractory to platelet transfusions and therefore remaining at 1×10⁹ platelets/L for the remainder of the simulated period.
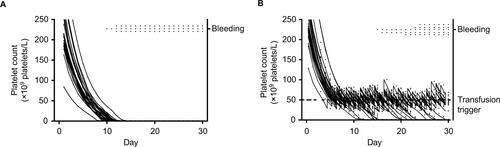
Figure S2 Days with bleeding events according to the morning platelet count, for different platelet count triggers and different assumption violations.
Notes: Markers represent fraction of days, with the indicated morning platelet count, at which patients experience bleeding. (A, B, and C) Results for simulations with different transfusion triggers. Different lines show different assumptions from the sensitivity analyses. Assumptions were adapted incrementally (ie, previous adaptations were maintained, rather than reset, when adding a new adaptation). Circles represent results from the original simulations, squares from simulations with a probability of refractoriness of 0.5% (instead of 5%), diamonds of simulations with a bleeding probability of 0.1% (instead of 0.5%), and triangles of simulations in which bleeding risk did not increase until platelet counts dropped below 5×10⁹ platelets/L. Lines for original simulations and adapted probability of refractoriness overlap.
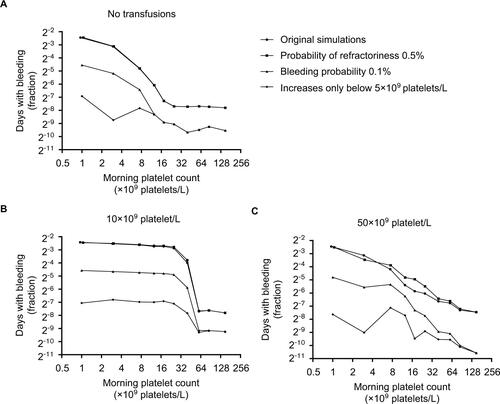
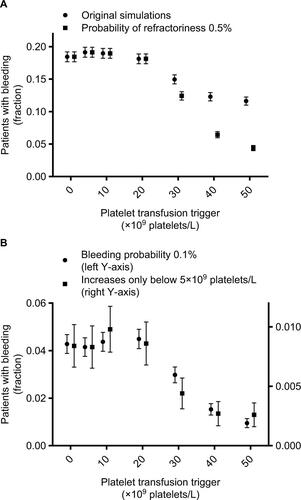
Figure S3 Patients with bleeding events, according to the platelet count used as a trigger for platelet transfusions and different assumption violations.
Notes: Markers represent fraction of patients who experience bleeding at any time during the 30 day simulation period. Error bars represent 95% confidence intervals. Different markers show different assumptions from the sensitivity analyses. Assumptions were adapted incrementally (i.e. previous adaptations were maintained, rather than reset, when adding a new adaptation). Circles (A) represent results from the original simulations, squares (A) from simulations with a probability of refractoriness of 0.5% (instead of 5%), circles (B) of simulations with a bleeding probability of 0.1% (instead of 0.5%), and squares (B) of simulations in which bleeding risk didn’t increase until platelet counts dropped below 5×10⁹ platelets/L.
Note: The lowest platelet count trigger (i.e. 0×109 platelets/L) indicates no platelet transfusions were given, since the minimum simulated platelet count was 109 platelets/L.
Disclosure
The authors report no conflict of interest in this work.
References
- KreugerALMiddelburgRAZwagingaJJKerkhoffsJLvan der BomJGClinical practice of platelet transfusions in hemato-oncology; a surveyVox Sang2015109919425833739
- KaufmanRMDjulbegovicBGernsheimerTPlatelet Transfusion: A Clinical Practice Guideline From the AABBAnn Intern Med2014101589
- de VriesRHaasFEnglish translation of the Dutch Blood Transfusion guideline 2011Vox Sang2012103363041022747957
- YpmaPFKerkhoffsJLvan HiltenJAThe observation of bleeding complications in haemato-oncological patients: stringent watching, relevant reportingTransfus Med2012 ePub103148
- MiddelburgRAYpmaPFvan der MeerPFvan Wordragen-VlaswinkelRJEissenOKerkhoffsJLMeasuring clinical bleeding using a standardized daily report form and a computer algorithm for adjudication of WHO bleeding gradesVox Sang201310514414923517250
- SlichterSJKaufmanRMAssmannSFDose of prophylactic platelet transfusions and prevention of hemorrhageN Engl J Med201036260061320164484
- StanworthSJEstcourtLJPowterGA no-prophylaxis platelet-transfusion strategy for hematologic cancersN Engl J Med20133681771178023656642
- HeddleNMCookRJTinmouthAA randomized controlled trial comparing standard- and low-dose strategies for transfusion of platelets (SToP) to patients with thrombocytopeniaBlood20091131564157319109560
- KumarAMhaskarRGrossmanBJPlatelet transfusion: a systematic review of the clinical evidenceTransfusion201410
- StanworthSJHudsonCLEstcourtLJJohnsonRJWoodEMRisk of bleeding and use of platelet transfusions in patients with hematologic malignancies: recurrent event analysisHaematologica201510074074725795717
- SlichterSJRelationship between platelet count and bleeding risk in thrombocytopenic patientsTransfus Med Rev20041815316715248165
- RothmanKJGreenlandSLashTLModern Epidemiology3Wolter Kluwer2009
- MiddelburgRAWiersum-OsseltonJCvan de WateringLMvan der BomJGObservational etiologic research: part 1–The etiologic research question: it requires DATATransfusion2013532606260824117626
- HansonSRSlichterSJPlatelet kinetics in patients with bone marrow hypoplasia: evidence for a fixed platelet requirementBlood198566110511094052629
- SlichterSJDavisKEnrightHFactors affecting posttransfusion platelet increments, platelet refractoriness, and platelet transfusion intervals in thrombocytopenic patientsBlood20051054106411415692069
- R: A language and environment for statistical computing [Version 3.2.0Vienna, AustriaR Foundation for Statistical Computing2015
- HodESchwartzJPlatelet transfusion refractorinessBr J Haematol200814234836018510692
- LawrenceJBYomtovianRADillmanCReliability of automated platelet counts: comparison with manual method and utility for prediction of clinical bleedingAm J Hematol1995482442507717373
- PfuntnerAWierLMStocksCMost Frequent Procedures Performed in U.S. Hospitals, 2011: Statistical Brief #165
- Stata Statistical Software [Version 14.1College Station, Texas, USAStataCorp LP2015
- RebullaPFinazziGMarangoniFThe threshold for prophylactic platelet transfusions in adults with acute myeloid leukemia. Gruppo Italiano Malattie Ematologiche Maligne dell’AdultoN Engl J Med1997337187018759407153
- DiedrichBRembergerMShanwellASvahnBMRingdenOA prospective randomized trial of a prophylactic platelet transfusion trigger of 10 × 10(9) per L versus 30 × 10(9) per L in allogeneic hema-topoietic progenitor cell transplant recipientsTransfusion2005451064107215987349
- HeckmanKDWeinerGJDavisCSStraussRGJonesMPBurnsCPRandomized study of prophylactic platelet transfusion threshold during induction therapy for adult acute leukemia: 10,000/microL versus 20,000/microLJ Clin Oncol199715114311499060557
- ZumbergMSdel RosarioMLNejameCFA prospective random-ized trial of prophylactic platelet transfusion and bleeding incidence in hematopoietic stem cell transplant recipients: 10,000/L versus 20,000/microL triggerBiol Blood Marrow Transplant2002856957612434952
- Mirasol Clinical Evaluation Study GroupA randomized controlled clinical trial evaluating the performance and safety of platelets treated with MIRASOL pathogen reduction technologyTransfusion2010502362237520492615
- DjulbegovicBClarkeMScientific and ethical issues in equivalence trialsJAMA20012851206120811231752
- PiaggioGElbourneDRPocockSJEvansSJAltmanDGReporting of noninferiority and equivalence randomized trials: extension of the CONSORT 2010 statementJAMA20123082594260423268518
- MiettinenOSKarpIEpidemiological Research: An IntroductionDordrechtSpringer2012
- HernanMAA definition of causal effect for epidemiological researchJ Epidemiol Community Health20045826527115026432
- HeddleNMThe research questionTransfusion200747151717207225
- EckhardtCLvan VelzenASFijnvandraatCJvan der BomJGDissecting intensive treatment as risk factor for inhibitor development in haemophiliaHaemophilia201622e241e24427076357
- StukelTAFisherESWennbergDEAlterDAGottliebDJVermeu-lenMJAnalysis of observational studies in the presence of treatment selection bias: effects of invasive cardiac management on AMI survival using propensity score and instrumental variable methodsJAMA200729727828517227979
- BorJMoscoeEMutevedziPNewellMLBarnighausenTRegression discontinuity designs in epidemiology: causal inference without randomized trialsEpidemiology20142572973725061922
- BoefAGvanPJArbousMSPhysician’s preference-based instrumental variable analysis: is it valid and useful in a moderate-sized study?Epidemiology20142592392725051311
- GuoSLiXDuXLiuHXieGGroup-Based Trajectory Analysis for Long-Term Use of Warfarin Therapy in Atrial Fibrillation PatientsStud Health Technol Inform20172451024102829295256