
 ?Mathematical formulae have been encoded as MathML and are displayed in this HTML version using MathJax in order to improve their display. Uncheck the box to turn MathJax off. This feature requires Javascript. Click on a formula to zoom.
Abstract
Objective
Physicians commonly prescribe antidepressants for indications other than depression that are not evidence-based and need further evaluation. However, lack of routinely documented treatment indications for medications in administrative and medical databases creates a major barrier to evaluating antidepressant use for indications besides depression. Thus, the aim of this study was to derive a model to predict when primary care physicians prescribe antidepressants for indications other than depression and to identify important determinants of this prescribing practice.
Methods
Prediction study using antidepressant prescriptions from January 2003–December 2012 in an indication-based electronic prescribing system in Quebec, Canada. Patients were linked to demographic files, medical billings data, and hospital discharge summary data to create over 370 candidate predictors. The final prediction model was derived on a random 75% sample of the data using 3-fold cross-validation integrated within a score-based forward stepwise selection procedure. The performance of the final model was assessed in the remaining 25% of the data.
Results
Among 73,576 antidepressant prescriptions, 32,405 (44.0%) were written for indications other than depression. Among 40 predictors in the final model, the most important covariates included the molecule name, the patient’s education level, the physician’s workload, the prescribed dose, and diagnostic codes for plausible indications recorded in the past year. The final model had good discrimination (concordance (c) statistic 0.815; 95% CI, 0.787–0.847) and good calibration (ratio of observed to expected events 0.986; 95% CI, 0.842–1.136).
Conclusion
In the absence of documented treatment indications, researchers may be able to use health services data to accurately predict when primary care physicians prescribe antidepressants for indications other than depression. Our prediction model represents a valuable tool for enabling researchers to differentiate between antidepressant use for depression versus other indications, thus addressing a major barrier to performing pharmacovigilance research on antidepressants.
Introduction
Adverse drug reactions are a major cause of mortality, morbidity, and hospitalizations in the USACitation1–Citation3 and Canada.Citation4 Pharmacovigilance – defined by The World Health Organization as “the science and activities relating to the detection, assessment, understanding, and prevention of adverse effects or any other drug-related problems”Citation5 – is essential for increasing drug safety and reducing the frequency of adverse drug events.
An important component of pharmacovigilance is monitoring the use of medicinal products for unapproved indications.Citation6 Antidepressants are a group of drugs in need of heightened pharmacovigilance because they are one of the most commonly used medicationsCitation7–Citation9 that are frequently prescribed for indications other than depression, many of which are unapproved or “off-label” for the drug.Citation10 Moreover, most off-label uses for antidepressants are not backed by a strong level of scientific evidence,Citation11 raising concerns because unsubstantiated off-label drug use increases the risk of adverse drug events and places unnecessary financial burdens on the health care system.Citation12 The frequency with which antidepressants are prescribed for non-evidenced-based indications highlights the need to conduct post-market evaluations of antidepressant-related outcomes by indication.
Administrative health databases have the potential to be valuable resources for studying antidepressant use for different indications. Such databases can identify large, population-based cohorts of antidepressant users, capture many different uses (ie, drug-indication combinations), and detect rare adverse drug events – all at a fraction of the cost required to conduct clinical trials, which tend to include smaller, more selective patient populations.Citation13 However, a major barrier precluding the use of administrative databases for this purpose is that they lack information on treatment indications, which is essential for distinguishing between antidepressant use for depression versus other indications. In the absence of documented treatment indications, studiesCitation14–Citation18 have inferred the reasons for antidepressant use based on the presence of diagnostic codes for plausible indications in administrative databases. We previously evaluated the accuracy of this approach and found that when compared to physician-documented treatment indications from an electronic prescribing system, administrative diagnostic codes had poor sensitivity (ie, identified only a small proportion of antidepressant prescriptions truly written for the corresponding indication). For example, diagnostic codes for depression, anxiety/stress disorders, and sleeping disorders identified only 26.5%, 31.2%, and 4.9% of antidepressant prescriptions for these indications, respectively.Citation19
Unless other variables in health services data besides diagnostic codes can improve the ability to predict antidepressant treatment indications, such data will likely remain an unviable resource for studying antidepressant use by indication. Thus, the primary objective of this study was to derive and validate a model using a wide range of variables derived from health services data to predict when primary care physicians prescribed antidepressants for indications other than depression and to compare the performance of this model to that of a model based on diagnostic codes alone. A second and equally important objective of this study was to identify important predictors of antidepressant prescriptions for indications other than depression and measure their association with the outcome.
Methods
Study design and context
This prediction study took place in the Canadian province of Quebec, where a universal health insurance program covers all residents for the cost of medically necessary services, including physician visits, hospitalizations, diagnostic and therapeutic procedures, and psychiatric treatments.Citation20 Over 90% of physicians are reimbursed on a fee-for-service basis, with physicians submitting claims to the provincial health insurance agency (the Régie de l’assurance maladie du Québec [RAMQ]) for services rendered in hospitals or private clinics.Citation21 Each medical claim contains a billing code for the service rendered and an optional International Classification of Diseases, Ninth Revision (ICD-9) code for the primary complaint. The province also maintains a hospitalization discharge summary database (MED-ECHO) containing details of all hospitalizations at acute care institutions in Quebec, including in-hospital procedures and discharge diagnoses recorded by medical archivists based on structured chart abstraction. Before April 2006, discharge diagnoses in hospital abstracts were recorded using the ICD-9 system and in-hospital procedures were recorded using the Canadian Classification of Diagnostic, Therapeutic, and Surgical Procedures (CCP) system. Since April 2006, the ICD-10 coding system and the Canadian Classification of Health Interventions (CCI) system have been used.
By law, all Quebec residents must be covered for prescription drugs through either private plans (ie, group or employee benefit plans) or the public drug insurance plan. Approximately 50% of residents are registered in the public drug insurance plan, including individuals aged 65 years or older, welfare recipients, and those not insured through an employer.
The Medical Office of the XXIst Century (MOXXI)
The Medical Office of the XXIst Century (MOXXI) is an indication-based electronic prescribing and drug management system used by consenting primary care physicians at community-based clinics around two major urban centers in Quebec.Citation22 For all prescriptions, MOXXI physicians are required to document at least one treatment indication using either a drop-down menu containing on-label and off-label indications (without distinction) or by typing the indication(s) into a free-text field. These physician-documented indications were previously validated against a blinded, post-hoc physician-facilitated chart review, and were shown to have excellent sensitivity (98.5%) and high positive predictive value (97.0%).Citation23
Since 2003, 207 physicians (25% of eligible) and over 100,000 patients (26% of all who visited a MOXXI physician) have consented to participate in MOXXI and have their information used for research purposes. MOXXI physicians tend to be younger and have lower patient loads than non-MOXXI physicians, while MOXXI patients tend to be older with more health complexities than non-MOXXI patients.Citation24
Data sources
This study included all prescriptions of drugs approved for depression that were written by a MOXXI physician between 1 January 2003 and 31 December 2012. The unit of analysis was the prescription. Patients with eligible prescriptions were linked by unique patient identifiers to beneficiary and medical claims data from RAMQ and hospital discharge abstracts in the MED-ECHO database. All databases accessed contained only anonymous or de-identified data. This study was approved by the McGill Institutional Review Board.
Exclusion criteria
Drugs were excluded if they had fewer than 120 prescriptions in the MOXXI system over the study period (roughly corresponding to a prescribing frequency of less than once per month). As a result, all prescriptions for moclobemide, maprotiline, phenelzine, nefazodone, and tranylcypromine were excluded from the analysis.
Study outcomes
The primary outcome was a binary variable representing whether the physician had prescribed the antidepressant for an indication other than depression. The secondary outcome was a polytomous variable that assigned antidepressant prescriptions to one of five treatment indication classes: 1) depression; 2) anxiety/stress disorders; 3) sleeping disorders; 4) pain; or 5) miscellaneous indications. Both outcomes were determined using the physician-documented indications in the MOXXI system, where treatment indications were grouped into categories using definitions under the ICD-9 system. For prescriptions where physicians recorded more than one indication (1.5% of all antidepressant prescriptions), we used the indication entered first since it most likely represented the main or most responsible indication.
Candidate predictors
We considered a wide range of characteristics related to the prescription, patient, or prescribing physician. shows all 373 variables that were considered as candidate predictors of antidepressant prescriptions for indications other than depression.
Table 1 Candidate predictors of antidepressant prescriptions for indications besides depression
Prescription factors
We used information from the index prescription to create variables for the name of the prescribed molecule, the prescribed dose (in mg/day), whether the drug was to be taken on an “as-needed” basis, and the number of other drugs concurrently prescribed with the antidepressant. We considered these factors because certain antidepressants like selective serotonin reuptake inhibitors are more commonly prescribed for depressionCitation10,Citation25 but may be taken “as-needed” when used for other conditions like sexual dysfunction.Citation26 We also hypothesized that the prescribed dose was an important predictor because drugs like trazodone, amitriptyline, and doxepin are typically taken at lower-than-usual doses when prescribed for insomnia.Citation27
Patient factors
Patient factors included variables related to demographics, socio-economic status (SES), health problems (diagnostic codes), health services use, and drugs prescribed in the past year. SES was measured using area-level markers of income (median household income), education (% of population aged 25 to 64 years with less than university education), and employment status (% of population aged 25+ years without employment), which were determined by mapping the first three digits of patients’ postal codes to their associated census tract divisions and calculating a weighted average of the respective estimates from the 2006 Canadian census. Patients’ type of drug insurance (public or private plan) was also considered since residents under 65 years old with public drug insurance are typically unemployed or on welfare.
Diagnostic codes from physician billings or hospital discharge abstracts in the past year were expressed using 129 binary variables. Twenty-six of these variables captured the presence of diagnostic codes for 13 plausible treatment indications for antidepressants: depressive disorders, anxiety/stress disorders, pain, migraine, fibromyalgia, obsessive-compulsive disorder, vasomotor symptoms of menopause (ie, hot flashes), nicotine dependence, attention deficit/hyperactivity disorder, sexual dysfunction, pre-menstrual dysphoric disorder, and eating disorders. We examined two separate observation windows for these 13 diagnostic categories: 1) ±3 days around the index prescription date, and 2) 4 to 365 days before the index prescription date. We used the set of ICD-9 codes from our previous studyCitation19 to identify diagnostic codes that mapped to each of these 13 diagnostic categories (Table S1). ICD-10 codes recorded in hospital discharge abstracts from April 2006 onwards were translated to their ICD-9 equivalent using conversion tables.Citation28 We also created another 17 binary variables to capture the presence of diagnostic codes for chronic conditions in the Charlson comorbidity index recorded over the past year since patients with depression often have more chronic morbidities than patients without depression.Citation29,Citation30 Diagnostic codes for these chronic conditions were identified using the ICD mappings by Quan et al.Citation31 The last 86 binary variables captured the presence of all remaining four-digit ICD-9 codes that were recorded for at least 1% of all patients with antidepressant prescriptions in the past year (Table S2).
Patterns of health care utilization in the past year were also considered because compared to individuals without depression, individuals with major depression who are treated in primary care are more likely to have a usual source of care, more likely to see a physician, and less likely to visit the emergency room for routine services.Citation30 We therefore created variables representing the number of outpatient visits, number of outpatient physicians seen, and whether the patient had been hospitalized, undergone day surgery, or visited the ER in the past year. Continuity of care with the prescribing physician was also measured by calculating the percentage of all outpatient visits in the past year that were made to the prescriber. Medical services received in the past year were represented by assigning billing codes from physician claims data to their respective “billing code category” using mapping tables obtained from RAMQ. Binary variables were used to represent the presence of billing codes from any category recorded for at least 1% of patients with antidepressant prescriptions in the past year (a total of 52 categories – Table S3). A similar method was used for in-hospital procedures, where procedure codes from discharge abstracts in the past year were grouped at the three-digit CCP level. CCI codes in discharge abstracts after March 2006 were translated to their CCP equivalent using conversion tables from RAMQ. Binary variables were used to represent the presence of any 3-digit procedure code recorded for at least 1% of patients with antidepressant prescriptions who had been hospitalized in the past year (a total of 70 procedure codes – Table S4).
Finally, we considered drugs prescribed to patients in the past year because patients’ previous drug history may contain clues about the reasons for antidepressant prescriptions. For example, antidepressants may be more likely to be prescribed for depression if the patient was previously prescribed atypical antipsychotics (eg, aripiprazole, quetiapine) or lithium, which are drugs commonly used to augment antidepressant therapy for depression.Citation32 Binary variables were used to represent the presence of previous prescriptions for any molecule that had been prescribed in the past year for at least 1% of patients with antidepressant prescriptions (a total of 99 drugs – Table S5).
Physician factors
Various factors may influence why physicians prescribe antidepressants for different indications, such as their previous medical training, clinical experience, workload, and receptiveness to new information on best practices. To test these hypotheses, we used information from RAMQ to capture physicians’ sex, place of medical training (Canada/USA or other), level of clinical experience (number of years in practice since medical graduation), and workload (average number of patients seen per working day in the previous year). MOXXI physicians also completed the Evidence-Nonconformity-Practicality survey,Citation33 which is a psychometric instrument that determines how physicians will likely respond to new information about evidence-based clinical practice. Higher evidence scores (possible range 6–30) indicate a stronger belief in scientific evidence versus clinical experience as the best source of clinical knowledge, higher nonconformity scores (possible range 6–30) indicate more willingness to diverge from group norms in clinical practice, and higher practicality scores (possible range 5 to 25) indicate higher sensitivity to practical concerns such as managing workload and patient flow.
Statistical analysis
illustrates the steps of the study analysis. For the primary outcome, we used multivariable binomial logistic regression to model the probability that a given prescription was written for an indication other than depression. For the secondary outcome, we used multivariable multinomial logistic regression to estimate the probabilities that a given prescription was written for each of the five mutually exclusive treatment indication classes.
Figure 1 Outline of the study analysis.
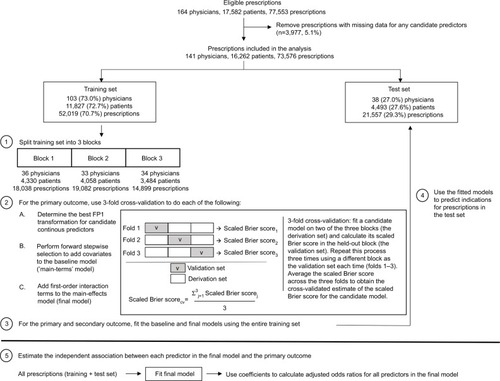
Only a small proportion (5.1%) of prescriptions had missing data, which we excluded from the main analysis (). Missing data occurred either because the patient’s postal code did not fall within a census tract region or because the prescribing physician did not complete the Evidence-Nonconformity-Practicality survey. We hypothesize that the mechanisms behind missing data were not related to factors affecting antidepressant treatment indications.
All prescriptions with complete data were randomly divided using a 3:1 split into a “training set” versus “test set”. The training set was used for model selection and to fit the final prediction models. The test set was only used to evaluate the performance of the final models; it was not used in the model building or estimation process. Because prescriptions were nested within patients who were in turn nested within physicians, we assigned a random sample of 75% of physicians (rather than individual prescriptions) to the training set. The remaining 25% of physicians were assigned to the test set. All prescriptions from the same physician and for the same patient were therefore limited to either the training or test set. To ensure that patients and prescriptions were also divided approximately 3:1 between the training and test sets, we first stratified physicians by the number of their patients and then randomly sampled separately within each stratum.
Using the same randomization procedure, we divided the physicians in the training set into three mutually exclusive blocks (, Step 1). These blocks were used for 3-fold cross-validation to reduce the risk of overfitting the final model to the training set.Citation34 The cross-validation procedure involved fitting a candidate model for the primary outcome using data from two of the three blocks (the “derivation set”) and evaluating its performance in the held-out block (the “validation set”) (, Step 2 – Box). We repeated this process three times, each time using a different block as the validation set and then averaged the performance over the three validation sets. As the performance metric, we used the scaled Brier scoreCitation35,Citation36, similar to the R2 statistic in linear regression, which was calculated using the following formula:
where N represents the total number of antidepressant prescriptions, Ŷi represents the predicted probability that prescription i was written for an indication other than depression, Yi represents the observed outcome for prescription i (1 if the prescription was not written for depression, 0 otherwise), and
represents the overall (marginal) observed probability of an antidepressant prescription being written for an indication other than depression in the study sample. As the formula shows, the scaled Brier score can be interpreted as the proportion by which a given model reduces the mean squared error of a non-informative model where all prescriptions are assigned the overall probability of having an indication other than depression.
We used 3-fold cross-validation to guide our decisions in three aspects of the model building process. The first aspect concerned the choice of functional form for the association between each continuous variable and the primary outcome (, Step 2A). To this end, we relied on the flexible yet parsimonious first-degree fractional polynomials (FP1)Citation37. For each continuous variable X, we selected the best fitting FP1 function among eight candidate FP1 functions: Xp, where the powers p were represented by the set {−2, −1, −0.5, 0, 0.5, 1, 2, 3}, and X0 denoted log(X)Citation37. The best functional form for each X was assumed to be X1 (ie, a linear association with outcome) unless a model using one of the nonlinear FP1 functions had a cross-validated scaled Brier score that was at least 0.0005 units higher than a model using the linear function. We required this minimum increase in the scaled Brier score to avoid using more complex functional forms that offered only minimal improvement in performance. The second decision concerned the selection of covariates. Starting with a model containing only covariates based on diagnostic codes for plausible antidepressant treatment indications (the “baseline model”), we used a forward stepwise selection procedure to add other covariates to the model (, Step 2B). At each step, the variable that produced the greatest increase in the cross-validated scaled Brier score was added to the model. We stopped adding covariates when none of the remaining variables further increased the cross-validated scaled Brier score by at least 0.0005 (again, to avoid including covariates that offered only minimal improvement in predictive performance). Finally, among the covariates added to the model from the forward stepwise selection procedure, we identified plausible first-order interaction terms between them and tested whether the individual addition of these interaction terms improved the cross-validated scaled Brier score of the “main-terms” model (ie, without interactions) by at least 0.0005 (, Step 2C).
After identifying the final prediction model, we used the entire training set to fit both the baseline and final models for the primary and secondary outcomes (, Step 3). We then used the fitted coefficients of these models to calculate the probability of the outcome for prescriptions in the test set, where the outcome probability was calculated as . We evaluated the performance of these predictions using the methods and criteria described below (, Step 4).
Measures of predictive performance
Primary outcome
We assessed overall model performance using the scaled Brier score. We assessed model discrimination (the model’s ability to distinguish between prescriptions for depression versus other indications) using two measures: 1) the concordance (c) statistic, which is equivalent to the area under the receiver operating characteristic curve; and 2) the discrimination slope, which is calculated as the absolute difference in the average predicted probabilities among prescriptions for depression and prescriptions for other indications.Citation36 We compared the discrimination of the final and baseline models using the integrated discrimination improvement (IDI) to quantify the predictive ability gained from including other health-related information other than diagnostic codes for plausible antidepressant treatment indications in the prediction models.Citation38 The IDI can be interpreted as the difference in discrimination slopes between the final and baseline models or alternatively as the change in average sensitivity (ie, the sensitivity averaged over all possible cut-off values between 0 and 1) minus the change in average “one minus specificity” when comparing the final model to the baseline model.Citation38
Finally, we assessed model calibration (the accuracy of the predicted probabilities compared to the observed outcomes) by calculating the ratio of observed to expected number of prescriptions for indications other than depression within each of five strata based on the estimated probability of the outcome: 0–0.2, >0.2–0.4, >0.4–0.6, >0.6–0.8, and >0.8–1.0. The expected number of prescriptions for indications other than depression in each stratum was calculated by summing the estimated probabilities across all prescriptions in the corresponding stratum.
Secondary outcome
As with the primary outcome, we assessed overall model performance for the secondary outcome using the scaled Brier score. However, because there were five treatment indication categories, we calculated the scaled Brier score using the following formula:
where N represents the total number of antidepressant prescriptions, R represents the number of treatment indication categories, Ŷij represents the estimated probability that prescription i was written for indication j, Yij represents the observed outcome for prescription i corresponding to indication j (ie, 1 if prescription i was written for indication j, 0 otherwise), and
represent the overall (marginal) observed probability of indication j in the study sample.Citation35 We also assessed the overall performance of the model separately for each treatment indication category using a “one-versus-rest” approach, where the scaled Brier score was calculated as per the primary outcome.
We calculated 95% confidence intervals (CIs) around all performance measures using a two-stage cluster bootstrapCitation39 to account for multi-level clustering of prescriptions within patients, who in turn were nested within physicians. The reported 95% CIs correspond to the values of the 2.5th and 97.5th percentiles of the distribution of the respective estimates across 1,000 bootstrap re-samples of the test set.
Measures of association
We used the final multivariable prediction model to estimate the adjusted odds ratio (ORadj) for the independent association between each selected covariate and the odds of a treatment indication besides depression, fitted to the entire dataset (, Step 5). We combined the training and test sets when estimating the adjusted odds ratios to maximize the precision of our estimates. As before, we used a two-stage cluster bootstrapCitation39 to calculate the 95% CIs around the ORadj estimates.
All statistical analyses were performed using SAS (SAS Institute Inc., Cary, NC, USA) software, version 9.4.
Results
The study analysis included a total of 73,576 antidepressant prescriptions written by 141 physicians for 16,262 patients (). Physicians prescribed antidepressants to a median of 70 (interquartile range [IQR] 12–171) patients, and patients received a median of 3 (1–6) antidepressant prescriptions over the study period. Among all antidepressant prescriptions, 32,405 (44.0%) were for indications other than depression – 16,374 (22.3%) for anxiety/stress disorders, 7,295 (9.9%) for sleeping disorders, 4,137 (5.6%) for pain, and 4,599 (6.3%) for miscellaneous indications. The remaining 41,171 (56.0%) prescriptions were for depression.
Prescription, patient, and physician characteristics
Overall, the most commonly prescribed antidepressants were venlafaxine (20.9%), citalopram (18.5%), and trazodone (9.4%). For only a small proportion (2.9%) of prescriptions, physicians prescribed the antidepressant on a “take-as-needed” basis.
More than two-thirds (68.9%) of all antidepressant prescriptions were written for female patients. Patients were a median of 55 (IQR 45–65) years old and 55.6% were registered in the public drug insurance plan. The percentage of patients without a diagnostic code for any of the 13 plausible antidepressant treatment indications within ±3 days of the index prescription date was 57.4%, which decreased to 22.5% when the length of the lookback window was increased to 365 days. Nearly one-third (31.7%) of patients had at least one chronic condition in the Charlson comorbidity index, 9.2% had been hospitalized in the past year, and 32.5% had visited the ER in the past year.
Nearly all antidepressant prescriptions were written by physicians who had received their medical training in Canada or the USA (90.0%) and had been practicing for at least 15 years at the start of the study period (94.0%). Physicians saw a median of 18 (IQR 13–23) patients per working day. Physician scores on the Evidence-Nonconformity-Practicality surveyCitation33 suggested that they favored scientific evidence over clinical experience as the best source of knowledge (median evidence score of 20, IQR 19–22), were comfortable diverging from clinical norms and common practices (median nonconformity score of 17, IQR 15–19), and were not overly concerned with pragmatic concerns of practice (median practicality score of 15, IQR 14–17).
The distribution of most of these characteristics did not differ notably between prescriptions in the training and test sets (Table S6). The only exceptions were the proportion of antidepressants prescribed on a “take-as-needed” basis (3.8% in the training set compared to 0.8% in the test set) and the proportion of antidepressant prescriptions written by physicians trained in Canada or the USA (93.9% in the training set compared to 80.5% in the test set).
Best FP1 function for continuous variables
Among all candidate predictors considered, 13 were continuous variables. For seven of these covariates, there was a better nonlinear FP1 function with a higher cross-validated scaled Brier score than the conventional linear X1 representation. The best-fitting FP1 function was X−2 for four of these variables (number of other drugs concurrently prescribed with the index drug, patient age, number of outpatient physicians seen in the past year, and the physician nonconformity score), X−0.5 for two variables (number of outpatient visits in the past year and physician workload), and X3 for the physician evidence score. The linear function X1 was used for the remaining six continuous variables ().
Derivation of the final model
Starting with the baseline model, which only contained the 26 variables based on diagnostic codes for plausible antidepressant treatment indications, the cross-validated estimate of the scaled Brier score was 0.0916 (). Thus, compared to a non-informative model where all prescriptions were assigned a probability of 44% (the overall probably that an antidepressant prescription was written for an indication other than depression), the baseline model reduced the mean square error by only 9.16%.
Table 2 Derivation of the final prediction model for antidepressant prescriptions for indications other than depression
Among the remaining 347 candidate predictors, the forward stepwise selection procedure added 14 of these variables to the baseline model (). The name of the molecule prescribed was added first and was by far the best predictor of whether an antidepressant was prescribed for an indication other than depression. Adding this variable resulted in a cross-validated scaled Brier score of 0.3193 – representing an increase of 0.2277 over the baseline model. The next three variables added were the area-level marker of patient education, physician workload, and the prescribed dose, which collectively increased the cross-validated estimate of the scaled Brier score by another 0.0117. The last 10 variables added – each with only a very minor contribution to the cross-validated scaled Brier score – were the number of outpatient visits in the past year, whether the drug was prescribed on a “take-as-needed” basis, binary variables for whether the patient had been prescribed each of three drugs in the past year (trazodone, quetiapine, and furosemide), binary variables for whether the patient had a diagnostic code in the past year for each of three conditions (diabetes without chronic complication, dementia, and unspecified nonpsychotic mental disorder following organic brain damage), patient age, and a binary variable for whether the patient had a billing code for any diagnostic procedure (eg, endoscopies, electrocardiograms, biopsies) in the past year. Collectively adding these 14 variables to the baseline model increased the scaled Brier score by 0.2499, creating the final “main-terms” model with a scaled Brier score of 0.3415.
Finally, we tested whether the main-terms model performed better when a first-order interaction term was added between the name of the molecule and the prescribed dose or when patient age was crossed with any variable for diagnostic codes or drugs prescribed in the past year. Only the interaction term between the name of the molecule and the prescribed dose further increased the cross-validated scaled Brier score, yielding the final prediction model with a cross-validated scaled Brier score of 0.3452 (). Table S7 shows the regression coefficients of all covariates in the final prediction model that were fit using the entire training set. These regression coefficients were used to calculate the estimated probability of the primary outcome for prescriptions in the test set.
Performance of the final versus baseline models
Primary outcome
In the test set, the final model had a scaled Brier score of 0.307 (95% CI 0.245 to 0.360) (). The final model had good discrimination, with a c statistic of 0.815 (95% CI 0.787 to 0.847) and a discrimination slope of 0.325 (95% CI 0.286 to 0.366). The final model performed substantially better than the baseline model, which had a scaled Brier score of only 0.076 (95% CI −0.007 to 0.131), a c statistic of only 0.651 (95% CI 0.590 to 0.711), and a discrimination slope of only 0.086 (95% CI 0.052 to 0.120). The IDI of 0.239 (95% CI 0.204 to 0.270) () resulted from an increase in average sensitivity of 0.113 (95% CI 0.085 to 0.143) minus a decrease in average “one-minus-specificity” of −0.126 (95% CI −0.150 to −0.099), further demonstrating that the 14 variables added to the baseline model significantly improved the ability to discriminate between prescriptions written for depression versus other indications.
Table 3 Performance of the final and baseline models for predicting antidepressant prescriptions for indications other than depression
The overall calibration of the final model was very good, with a ratio of 0.986 (95% CI 0.842 to 1.136) for the overall number of observed to expected prescriptions for indications other than depression (). The final prediction model underestimated the number of prescriptions in the stratum with a very low (≤0.2) probability of the outcome and slightly overestimated the number of prescriptions in the stratum with a higher probability of the outcome (0.2 to 0.6). When the estimated probability exceeded 0.6, however, the predictions from the final model were very accurate. In comparison, the overall calibration of the baseline model was worse, with a ratio of 0.935 (95% CI 0.773 to 1.125) for the overall number of observed to expected prescriptions for indications other than depression. Furthermore, the baseline model did not afford a clear identification of prescriptions with a high probability of indications other than depression, as over half of prescriptions had an estimated probability between 0.4 and 0.6 and only 0.3% (n=75) of prescriptions had an estimated probability >0.8 ().
Table 4 Calibration of the final and baseline models for predicting antidepressant prescriptions for indications other than depression
Secondary outcome
For the multinomial logistic regression model that produced estimated probabilities for each of the five treatment indication classes, the scaled Brier score across the five classes was 0.320 (95% CI 0.249 to 0.385) (). When the estimated probabilities for each treatment indication class were evaluated separately, the final multinomial model performed best for sleeping disorders (scaled Brier score of 0.628, 95% CI 0.518 to 0.736) and worst for miscellaneous indications (0.128, 95% CI 0.044 to 0.202). In comparison, the performance of the baseline model was again much worse. The scaled Brier score across the five indication categories was notably lower at only 0.067 (95% CI 0.002 to 0.108) and was also lower for each treatment indication class individually, especially sleeping disorders (scaled Brier score of only 0.029, 95% CI 0.004 to 0.043).
Table 5 Overall and per-class performance of the final and baseline models for predicting antidepressant treatment indications expressed as a five-class outcome
Association between predictors in the final model and the primary outcome
Compared to venlafaxine (a serotonin-norepinephrine reuptake inhibitor [SNRI]), the molecules most likely to be prescribed for indications other than depression were amitriptyline (a tricyclic antidepressant [TCA]) (adjusted odds ratio [ORadj] 20.98, 95% CI 12.27 to 48.91) and trazodone (ORadj 18.55, 95% CI 8.7 to 45.88) (). Other drugs more likely to be prescribed for indications besides depression than venlafaxine included four TCAs (nortriptyline, doxepin, imipramine, and desipramine), duloxetine (an SNRI), and paroxetine (a selective serotonin reuptake inhibitor [SSRI]). Bupropion was least likely to be prescribed for indications other than depression, with an ORadj of 0.18 (95% CI 0.06 to 0.44) compared to venlafaxine.
Table 6 Adjusted odds ratios for the independent association between variables in the final prediction model and antidepressant prescriptions for treatment indications other than depression
For certain molecules, indications besides depression were less likely if the prescribed dose increased. For each 10 mg/day increase in the prescribed dose, the odds of indications other than depression decreased substantially for mirtazapine (ORadj 0.68, 95% CI 0.48 to 0.89), nortriptyline (ORadj 0.68, 95% CI 0.30 to 0.92) and paroxetine (ORadj 0.78 (95% CI 0.66 to 0.91), and decreased moderately for citalopram (ORadj 0.86, 95% CI 0.76 to 0.96), amitriptyline (ORadj 0.92, 95% CI 0.78 to 0.99) and venlafaxine (ORadj 0.96, 95% CI 0.94 to 0.98) (). On the other hand, antidepressants that were prescribed on a “take-as-needed” basis were notably more likely to be prescribed for indications other than depression (ORadj 2.85, 95% CI 1.47 to 6.09).
Antidepressants were also more likely to be prescribed for indications other than depression if the patient had undergone a diagnostic procedure in the past year (ORadj 1.19, 95% CI 1.04 to 1.33) or lived in an area where a higher percentage of the population did not have university education (ORadj per 1% increase 1.07, 95% CI 1.03 to 1.10). Patients with a diagnostic code for anxiety/stress disorders, fibromyalgia, obsessive-compulsive disorder, or attention deficit/hyperactivity disorder in the past year were also more likely to be prescribed antidepressants for indications other than depression, with these associations being strongest when the diagnostic code was recorded around the index prescription date. Conversely, patients were significantly less likely to be prescribed antidepressants for indications other than depres sion if they had a diagnostic code for depression, unspecified nonpsychotic mental disorder following organic brain damage (ICD-9 code of 310.9), or diabetes without chronic complication, or if they had been prescribed furosemide or trazodone in the past year. Patients with diagnostic codes for dementia or prescriptions for quetiapine in the past year were also less likely to be prescribed antidepressants for indications other than depression, but these 95% CIs did not exclude 1 ().
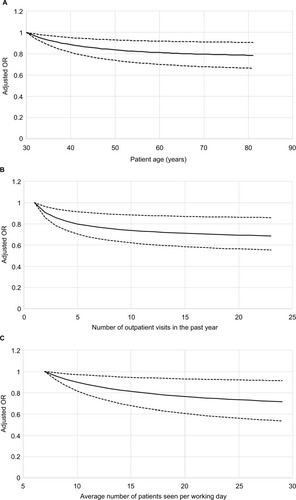
shows the adjusted ORs for the primary outcome that were estimated in the final model for the three continuous covariates that were expressed using nonlinear FP1 functions: patient age (panel A), the number of outpatient visits in the past year (panel B), and physician workload (panel C). For all these covariates, the odds of the outcome decreased with increasing values of the variable over their low to middle ranges but plateaued for values above a threshold.
Figure 2 Independent association between antidepressant prescriptions for indications other than depression and the three continuous covariates in the final model that were expressed using non-linear FP1 functions. Patient age (A) was expressed using the function X−2 while the number of outpatient visits in the past year (B) and physician workload (C) were expressed using the function X−0.5. The adjusted ORs account for all other covariates in the final model and were calculated based on coefficients fit using all prescriptions. For each continuous covariate, adjusted ORs were calculated from the 5th to 95th percentile of the distribution of observed values using the value at the 5th percentile as the reference level. The black lines represent the point estimates of the adjusted ORs, while the dotted lines represent the 95% CIs around the point estimates.
Discussion
In this study, we derived and validated a model that could accurately predict when primary care physicians prescribed antidepressants for indications other than depression. The most important predictors in the final model included the name of the molecule and the dose at which it was prescribed, the presence of diagnostic codes for certain conditions in administrative data over the past year, the patient’s education level, and the physician’s workload. The final prediction model had good discrimination, good calibration, and performed substantially better than a model containing only covariates based on diagnostic codes for plausible antidepressant treatment indications.
Comparison with previous studies
Few studies have attempted to predict antidepressant treatment indications or identify factors associated with them. Gardarsdottir et alCitation25 developed an algorithm to identify antidepressant users with a diagnostic code for depression in a Dutch medical database. The authors similarly found that antidepressant users with a diagnostic code for depression were more likely to be prescribed SSRIs rather than TCAs and to be prescribed higher doses of the drug. Milea et alCitation15 identified factors associated with antidepressant users without a diagnostic code for either approved or common off-label indications in a US claims database. Although the authors dissimilarly found that antidepressant users without a diagnosis of interest were more likely to be older or female, it is hard to compare our findings because the authors combined depression with other off-label indications for antidepressants and did not include prescriptions for TCAs or trazodone in the analysis. Finally, Sihvo et alCitation40 identified factors associated with non-psychiatric antidepressant use (neither depression nor anxiety) in an adult Finnish population where patients’ psychiatric history was assessed via self-report in a structured interview. The authors found that patients with lower levels of education or who had not used health services in the past year were more likely to take antidepressants for non-psychiatric reasons. Although neither of these associations was statistically significant in their study, these findings are concordant with our observation that patients with less than university education or fewer outpatient visits in the past year were more likely to receive antidepressant prescriptions for indications other than depression.
In all these studies, treatment indications were measured using suboptimal methods. The use of diagnostic codes alone identifies the true indication for only a small proportion of antidepressant prescriptionsCitation19 and the use of self-reported psychiatric history may lead to under-reporting of depression and other mental conditions.Citation40 In this study, we measured treatment indications using validated, physician-documented indications that were systematically recorded for every prescription. We also considered a more extensive range of predictors for antidepressant treatment indications than any other previous studies.
Explanations for study findings
Our finding that patients with lower education were more likely to be prescribed antidepressants for indications besides depression may be because patients with lower education are more likely to suffer from insomniaCitation41 and chronic painCitation42 for which antidepressants are often prescribed. Our finding that antidepressant prescriptions were more likely to be written for depression if the patient had more previous outpatient visits may be explained by the observation that patients with depression visit their primary care provider more frequently than patients without depression.Citation43 We also found that patients with past prescriptions for furosemide were more likely to be prescribed antidepressants for depression, which may have been observed because depression is associated with heart failure and adverse renal disease outcomes.Citation44 Our finding that patients with previous prescriptions for trazodone were more likely to be prescribed antidepressants for depression may be due to the fact that sleeping disorders are a key symptom of depressionCitation45 and the physicians in our study mainly prescribed trazodone for sleeping disorders (81% of all trazodone prescriptions). Finally, the somatic and symptomatic nature of many nonpsychiatric conditions for antidepressants (eg, pain, fibromyalgia, Crohn’s disease) may require patients to undergo various diagnostic tests before reaching a proper diagnosis.Citation46,Citation47 Thus, the work-up required to investigate patients’ medical complaints may explain why antidepressants were more likely to be prescribed for indications besides depression if the patient had undergone a diagnostic procedure in the past year.
Implications of findings
Administrative data and electronic health records rarely contain information linking prescriptions directly to their corresponding diagnoses,Citation15,Citation48 thus creating major barriers for using these data to study antidepressant use by indication. The fact that we derived a model that could accurately predict when antidepressants were being prescribed for indications other than depression is a promising finding for researchers. Specifically, it suggests that in the absence of documented treatment indications, researchers may still be able to use health services data to stratify antidepressant users by indication to achieve better precision when studying outcomes from antidepressant use and using antidepressant prescriptions as a proxy for depression treatment. Thus, our prediction model represents a valuable tool for enabling more valid, accurate database research on antidepressant use for both depression and other (eg, off-label) indications. Furthermore, the poor performance of our baseline model emphasizes that algorithms based on diagnostic codes alone should not be used to infer antidepressant treatment indications. Such algorithms likely have poor accuracy and will misclassify a significant number of antidepressant users, thus compromising the validity of the analysis.
For policy makers, the fact that the specific molecule prescribed was by far the strongest predictor of why antidepressants were prescribed suggests that health policies or interventions aimed at specific drugs may have large impacts on changing prescribing behaviors for antidepressants. For example, policies around trazodone would likely have a substantial impact on antidepressant use for sleeping disorders since this drug is used almost exclusively to treat insomnia.
Strengths and limitations
The main strength of this study is that it included ten years of data where physicians systematically documented treatment indications for antidepressants at the point of prescribing. Another strength is that in deriving our prediction model, we applied sound practices to reduce model over-fitting while still optimizing predictive performance. First, we used changes in the scaled Brier score rather than p-values as our criterion for selecting variables. Given that there were so many candidate predictors, the standard practice of relying on p-valuesCitation15,Citation25,Citation40 would have likely included many irrelevant variables or variables with little predictive value. The scaled Brier score, on the other hand, allowed us to assess each variable based on its predictive utility rather than statistical significance. Second, using 3-fold cross-validation during the variable selection process allowed us to obtain better estimates of the test error, thus reducing the risk of overfitting the final model to the training set. Finally, we tested the final model’s performance on a held-out set of prescriptions that had not been used during the training process, which allowed us to better estimate the model’s performance on new data. However, despite our best efforts to prevent overfitting, the final prediction model still performed better in the training set (cross-validated estimate of 0.345 for the scaled Brier score) than in the test set (scaled Brier score of 0.307).
Study limitations include the generalizability of our findings, as the MOXXI system is used by primary care physicians in one Canadian province for patients that are generally older with more health complexities.Citation24 Future research should be done to determine if our findings represent the prescribing habits of other specialists and physicians from other geographical locations. Another study limitation is that in creating predictors for the model, we did not consider previously dispensed drugs, because dispensing data was unavailable for patients with private drug insurance who contributed nearly half (44%) of the antidepressant prescriptions in this study. We also modelled treatment indications as mutually exclusive categories even though some antidepressants could have been prescribed for multiple indications. However, we hypothesize that this situation did not occur very frequently because only a small proportion (1.8%) of antidepressant prescriptions had multiple indications entered in the electronic prescribing system. This observation is similar to another UK studyCitation49 that found only 5% of antidepressants users reported taking antidepressants for multiple indications. Furthermore, MOXXI physicians had good reason to enter all relevant indications into the MOXXI system because these conditions became part of the patient’s problem list, which was then accessed by drug knowledge databases to identify potential drug-disease problems.Citation22
Finally, two study considerations deserve mention. First, because we used prescribing data in this study, future research should determine whether the performance of our prediction model is similar when applied to drug dispensing data, since patients who fill their antidepressant prescriptions may be distinct from those who do not. Second, the relationships we observed in this study were associational and not necessarily causal, thus requiring further investigation to reveal the mechanisms behind them.
Conclusion
In this study, we used health services data to derive a model that could accurately predict when primary care physicians prescribed antidepressants for indications other than depression. This model represents a valuable tool that could enable researchers to conduct more accurate database studies on antidepressant use by indication in the absence of documented treatment indications. This study also identified important factors associated with antidepressant prescriptions for indications besides depression that could help inform health policies and interventions aimed at changing prescribing behaviors for antidepressants.
Acknowledgments
The funders had no role in the study design; collection, analysis, interpretation of the data; writing of the manuscript; or in the decision to submit the manuscript for publication.
Disclosure
JW is supported by the Vanier Canada Graduate Scholarship (Canadian Institutes of Health Research), the Max E. Binz Fellowship (Faculty of Medicine, McGill University),a graduate student fellowship from the Research Institute of the McGill University Health Centre, and grant IOP-112675 from the Canadian Institutes of Health Research. MA and RT are both James McGill Professors at McGill University. The authors report no conflicts of interest in this work.
References
- ShepherdGMohornPYacoubKMayDWAdverse drug reaction deaths reported in United States vital statistics, 1999–2006Ann Pharmacother201246216917522253191
- LazarouJPomeranzBHCoreyPNIncidence of adverse drug reactions in hospitalized patients: a meta-analysis of prospective studiesJAMA199827915120012059555760
- BonnDAdverse drug reactions remain a major cause of deathLancet1998351911011839643702
- WuCBellCMWodchisWPIncidence and economic burden of adverse drug reactions among elderly patients in Ontario emergency departments: a retrospective studyDrug Saf201235976978122823502
- World Health OrganizationThe Importance of Pharmacovigilance: Safety Monitoring of Medicinal ProductsGenevaWorld Health Organization2002
- KumarAPharmacovigilance: importance, concepts, and processesAm J Health Syst Pharm201774860661228235869
- PrattLBrodyDGuQAntidepressant use in persons aged 12 and over: United States, 2005–2008NCHS Data Brief20117618 Available from: http://www.cdc.gov/nchs/data/databriefs/db76.htmAccessed May 5, 2015
- RotermannMSanmartinCHennessyDArthurMPrescription medication use by Canadians aged 6 to 79Health Rep201425639 Available from: http://www.statcan.gc.ca/pub/82-003-x/2014006/article/14032-eng.htmAccessed May 5, 2015
- Prescribing and Medicines TeamPrescriptions Dispensed in the Community: England 2005–2015Health and Social Care Information Centre2016 Available from: http://digital.nhs.uk/catalogue/PUB20664/pres-disp-com-eng-2005-15-rep.pdfAccessed September 14, 2016
- WongJMotulskyAEgualeTBuckeridgeDLAbrahamowiczMTamblynRTreatment indications for antidepressants prescribed in primary care in Quebec, Canada, 2006–2015JAMA2016315202230223227218634
- WongJMotulskyAAbrahamowiczMEgualeTBuckeridgeDLTamblynROff-label indications for antidepressants in primary care: descriptive study of prescriptions from an indication based electronic prescribing systemBMJ2017356j60328228380
- EgualeTBuckeridgeDLVermaAAssociation of off-label drug use and adverse drug events in an adult populationJAMA Intern Med20161761556326523731
- SuissaSGarbeEPrimer: administrative health databases in observational studies of drug effects–advantages and disadvantagesNat Clin Pract Rheumatol200731272573218037932
- LarsonMJMillerKFlemingKJTreatment with antidepressant medications in private health plansAdm Policy Ment Health200734211612616969580
- MileaDVerpillatPGuelfucciFToumiMLamureMPrescription patterns of antidepressants: findings from a US claims databaseCurr Med Res Opin20102661343135320373875
- SimonGEStewartCBeckANational prevalence of receipt of antidepressant prescriptions by persons without a psychiatric diagnosisPsychiatr Serv201465794494624788368
- ChenHReevesJHFinchamJEKennedyWKDorfmanJHMartinBCOff-label use of antidepressant, anticonvulsant, and antipsychotic medications among Georgia Medicaid enrollees in 2001J Clin Psychiatry200667697298216848658
- WuC-SShauW-YChanH-YLeeY-CLaiY-JLaiM-SUtilization of antidepressants in Taiwan: a nationwide population-based survey from 2000 to 2009Pharmacoepidemiol Drug Saf201221998098822511574
- WongJAbrahamowiczMBuckeridgeDLTamblynRAssessing the accuracy of using diagnostic codes from administrative data to infer antidepressant treatment indicationsPharmacoepidemiol Drug Saf
- Régie de l’assurance maladie du QuébecMedical services Available from: http://www.ramq.gouv.qc.ca/en/citizens/health-insurance/health-care/Pages/medical-services.aspxAccessed March 11, 2017
- MonfaredAATLelorierJAccuracy and validity of using medical claims data to identify episodes of hospitalizations in patients with COPDPharmacoepidemiol Drug Saf2006151192916136613
- TamblynRHuangAKawasumiYThe development and evaluation of an integrated electronic prescribing and drug management system for primary careJ Am Med Inform Assoc200613214815916357357
- EgualeTWinsladeNHanleyJABuckeridgeDLTamblynREnhancing pharmacosurveillance with systematic collection of treatment indication in electronic prescribing: a validation study in CanadaDrug Saf201033755956720553057
- BartlettGTamblynRKawasumiYPoissantLTaylorLNon-participation bias in health services research using data from an integrated electronic prescribing project: The role of informed consentActa Bioethica2005112145159
- GardarsdottirHEgbertsACGvan DijkLSturkenboomMCJMHeerdinkERAn algorithm to identify antidepressant users with a diagnosis of depression from prescription dataPharmacoepidemiol Drug Saf200918171518980206
- StoneKJVieraAJParmanCLOff-label applications for SSRIsAm Fam Physician200368349850412924832
- McCallWVOff-label use of prescription medications for insomnia: sedating antidepressants, antipsychotics, anxiolytics, and anticonvulsants (Chapter 34)Insomnia: Diagnosis and TreatmentLondon, UKInforma Healthcare2010397409
- Canadian Institute for Health InformationConversion Tables (for use with ICD-10-CA/CCI) https://secure.cihi.ca/estore/productSeries.htm?pc=PCC85Accessed July 27, 2016
- KatonWJEpidemiology and treatment of depression in patients with chronic medical illnessDialogues Clin Neurosci201113172321485743
- DrussBGRaskKKatonWJMajor Depression, Depression Treatment, and Quality of Primary Medical CareGen Hosp Psychiatry2008301202518164936
- QuanHSundararajanVHalfonPCoding algorithms for defining comorbidities in ICD-9-CM and ICD-10 administrative dataMed Care200543111130113916224307
- PapakostasGIManaging partial response or nonresponse: switching, augmentation, and combination strategies for major depressive disorderJ Clin Psychiatry200970Suppl 6162519922740
- GreenLAGorenfloDWWyszewianskiLMichigan Consortium for Family Practice ResearchValidating an instrument for selecting interventions to change physician practice patterns: a Michigan Consortium for Family Practice Research studyJ Fam Pract2002511193894212485547
- HastieTTibshiraniRFriedmanJThe Elements of Statistical Learning: Data Mining, Inference, and Prediction2nd edNew YorkSpringer-Verlag2009
- BrierGWVerification of forecasts expressed in terms of probabilityMon Weather Rev195078113
- SteyerbergEWVickersAJCookNRAssessing the performance of prediction models: a framework for some traditional and novel measuresEpidemiology201021112813820010215
- SauerbreiWMeier-HirmerCBennerARoystonPMultivariable regression model building by using fractional polynomials: description of SAS, STATA and R programsComput Stat Data Anal2006501234643485
- PencinaMJD’AgostinoRBD’AgostinoRBVasanRSEvaluating the added predictive ability of a new marker: from area under the ROC curve to reclassification and beyondStat Med200827215717217569110
- XiaoYAbrahamowiczMBootstrap-based methods for estimating standard errors in Cox’s regression analyses of clustered event timesStat Med2010297–891592320213705
- SihvoSIsometsäEKiviruusuOAntidepressant utilisation patterns and determinants of short-term and non-psychiatric use in the Finnish general adult populationJ Affect Disord20081101–29410518276016
- SuttonDAMoldofskyHBadleyEMInsomnia and health problems in CanadiansSleep200124666567011560179
- SmithBHElliottAMChambersWASmithWCHannafordPCPennyKThe impact of chronic pain in the communityFam Pract200118329229911356737
- WongSTMancaDBarberDThe diagnosis of depression and its treatment in Canadian primary care practices: an epidemiological studyCMAJ Open201424E337E342
- KopWJSeligerSLFinkJCLongitudinal association of depressive symptoms with rapid kidney function decline and adverse clinical renal disease outcomesClin J Am Soc Nephrol20116483484421393483
- NuttDWilsonSPatersonLSleep disorders as core symptoms of depressionDialogues Clin Neurosci200810332933618979946
- BergerADukesEMartinSEdelsbergJOsterGCharacteristics and healthcare costs of patients with fibromyalgia syndromeInt J Clin Pract20076191498150817655684
- WilkinsTJarvisKPatelJDiagnosis and management of Crohn’s diseaseAm Fam Physician201184121365137522230271
- LiYSalmasianHHarpazRChaseHFriedmanCDetermining the reasons for medication prescriptions in the EHR using knowledge and natural language processingAMIA Annu Symp Proc2011201176877622195134
- AartsNNoordamRHofmanATiemeierHStrickerBHVisserLESelf-reported indications for antidepressant use in a population-based cohort of middle-aged and elderlyInt J Clin Pharm20163851311131727586370