
Abstract
Background
For a patient cohort, access to linkable population-based registries permits sampling of a comparison cohort from the general population, thereby contributing to the understanding of the disease in a population context. However, sampling without replacement in random order can lead to immortal time bias by conditioning on the future.
Aim
We compared the following strategies for sampling comparison cohorts in matched cohort studies with respect to time to ischemic stroke and mortality: sampling without replacement in random order; sampling with replacement; and sampling without replacement in chronological order.
Methods
We constructed index cohorts of individuals from the Danish general population with no particular trait, except being alive and without ischemic stroke on the index date. We also constructed index cohorts of persons aged >50 years from the general population. We then applied the sampling strategies to sample comparison cohorts (5:1 or 1:1) from the Danish general population and compared outcome risks between the index and comparison cohorts. Finally, we sampled comparison cohorts for a heart failure cohort using each strategy.
Results
We observed increased outcome risks in comparison cohorts sampled 5:1 without replacement in random order compared to the index cohorts. However, these increases were minuscule unless index persons were aged >50 years. In this setting, sampling without replacement in chronological order failed to sample a sufficient number of comparators, and the mortality risks in these comparison cohorts were lower than in the index cohorts. Sampling 1:1 showed no systematic difference between comparison and index cohorts. When we sampled comparison cohorts for the heart failure patients, we observed a pattern similar to when index persons were aged >50 years.
Conclusion
When index persons were aged >50 years, ie, had high outcome risks, sampling 5:1 without replacement introduced bias. Sampling with replacement or 1:1 did not introduce bias.
Background
The cohort study is a classic design in epidemiological studies of disease risk or prognosis.Citation1 Life tables, often used to compute sex- and age-standardized incidence and mortality ratios in cohort studies, can contribute in understanding diseases in a population context.Citation1 However, life table-based designs are inadequate when more detailed confounder adjustment is required if data on the additional variables is unavailable in the life tables.Citation1
In epidemiological studies, population registries available in some European countries are used widely to sample and follow comparison cohorts representing the general populationCitation2–Citation4 based on risk-set sampling.Citation1 The comparison cohort can be matched to the patient cohort on variables including sex, birth year, and calendar period, ensuring that comparators are alive on the patient’s index date.Citation5–Citation19 Notice that matching on birth year and calendar period implies matching on age.
Sampling comparison cohorts from the general population provides a more flexible study design than studies relying on population-based life tables,Citation12,Citation13 because individuals in the comparison cohort can be assigned the same index date as the patient to whom they are matched. This allows for assessment of characteristics in both the patient and comparison cohorts through linkage to other health care, lifestyle, or socioeconomic registries.Citation2,Citation3 Several strategies can be used to sample a general population comparison cohort for a patient cohort (or other types of index cohorts). One approach is to sample each comparator only once, ie, to sample without replacement,Citation20 avoiding dependency between observations. However, if sampling is done in random (non-chronological) order relative to the order of the index dates of the patients, sampling without replacement can lead to immortal time biasCitation21 by conditioning on the future. As an example, consider a study in which it is required to sample a comparison cohort for a patient cohort, matching on sex, birth year, and calendar period. Now consider two patients, p1 and p2, with the same sex and birth year, diagnosed on dates, d1and d2, respectively, with p1 being diagnosed before p2. If comparators are sampled for p2 first, then the selected individuals are ineligible to be sampled as comparators for p1 on d1 because they survived until d2, introducing immortal time bias. As the comparators sampled for p2 are unavailable as comparators for p1, the proportion of potential comparators for p1 who die before d2 increase after comparators are sampled for p2. Hence, comparators sampled for p1 are drawn from a set of individuals, who on average die at an earlier date than they would, had we not sampled comparators for p2 first.
It is possible to circumvent the immortal time bias by sampling with replacementCitation20 or by sampling without replacement in chronological order, ie, given any two patients of the same sex and birth year, pi and pj, such that pi is diagnosed before pj, the comparators should be selected for pi before pj.
In this study, we compare the following three sampling strategies for selecting comparison cohorts, matching on sex, birth year, and calendar period: 1) sampling without replacement in random order, 2) sampling with replacement, and 3) sampling without replacement in chronological order. We compare the strategies with respect to balancing matching factors, and with respect to time to ischemic stroke and mortality in the sampled comparison cohorts.
We hypothesized that sampling without replacement in random order would produce comparison cohorts in which the outcome rates would be higher than in the general population because of immortal time bias (an illustration of the different sampling strategies is available in the Supplementary materials).
Methods
Setting and data sources
This study was conducted in Denmark using two nationwide population-based registries: the Civil Registration System (CRS) and the Danish National Patient Registry (DNPR). The CRS contains virtually complete and highly accurate individual-level information on all residents in Denmark, including birth date, sex, vital status, and sequential dates of migration.Citation2 Since its establishment in 1968, the CRS has registered cumulatively more than 9.5 million individuals with more than 250 million person-years of follow-up.Citation2 CRS data have been used extensively in epidemiological studies, eg, to assess all-cause mortality and to sample comparison cohorts in cohort studies and controls in case–control studies.Citation2
The DNPR has recorded every inpatient hospitalization since 1977 and every outpatient and emergency room visit since 1995.Citation22 For each admission, one primary and potentially several secondary diagnoses are registered, classified according to the International Classification of Diseases, Eighth Revision (ICD-8) until the end of 1993 and Tenth Revision (ICD-10) thereafter.Citation22 Data from the CRS and DNPR can be linked on an individual level using a unique personal identifier assigned to all Danish residents at birth or upon immigration.Citation2,Citation22
Study outline
We undertook both a general population cohort study and a heart failure cohort study.
In the general population cohort study, we constructed index cohorts of individuals from the general population and then sampled comparison cohorts using the three different sampling strategies. Our premise was that if a valid sampling strategy was applied, we would observe no systematic difference between the comparison and the index cohorts with respect to any characteristic. For example, the comparison and index cohorts should be similar with respect to distribution of baseline characteristics, risk and rate differences of outcomes should be zero, and correspondingly, risk and rate ratios should be one.
In the heart failure cohort study, we selected a heart failure patient cohort and sampled comparison cohorts to assess whether choice of sampling strategy affected the associations between heart failure and outcome risks and rates.
In both studies we matched on sex, birth year, and calendar period and followed the cohorts until incident ischemic stroke or death to compute the rates of these outcomes. We selected heart failure as a disease example because it is common among the elderly, allowing us to construct a large patient cohort.Citation5 Heart failure is also associated with a poor prognosis with respect to both survival and complications,Citation23 increasing the likelihood of detecting differences between the strategies. We selected ischemic stroke as an outcome, because it is a common reason for acute hospitalization in the adult population,Citation24 ie, detecting potential differences in risks and rates between cohorts is therefore more likely than if we had chosen a rare disease as an outcome. The study period was from January 1, 1980 to August 31, 2012.
Cohorts in the general population cohort study
We selected a random sample of 50,000 individuals from the CRS, who were alive in Denmark at some point during the study period, as a source population for the index and comparison cohorts. All Danish residents had the same probability of being sampled. We then constructed an index cohort within the sample as follows: on 1st January of each year in the study period, we recruited individual persons in the source population, who were alive and without ischemic stroke on that date, into the index cohort with a probability of 0.1%. We identified ischemic stroke using primary and secondary diagnoses in all available inpatient and outpatient records in the DNPR (diagnostic codes provided in the Supplementary materials).
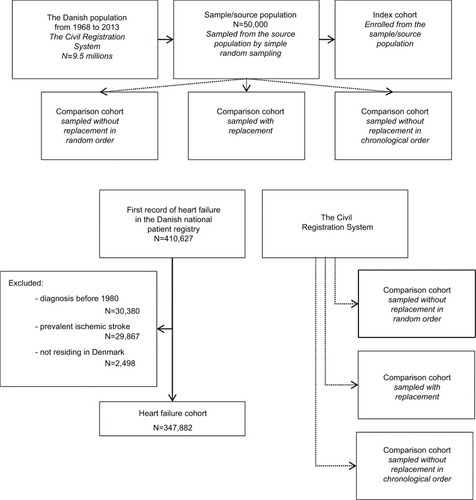
After the index cohort was constructed, we sampled comparison cohorts from the source population, using the three different sampling strategies (). Specifically, we sorted the members of the index cohort (referred to as ‘index persons’) either using a random variable drawn from a uniform distribution or, when sampling without replacement in chronological order, by their index dates. We then sampled individuals of the same sex and birth year, who were alive on the index date of the index person and removed the sampled individuals from the sampling pool except when sampling with replacement. Individuals were ineligible to be sampled as comparators on a given date if they had suffered an ischemic stroke or were already included as index persons before that date. We sampled five comparators for each index person, or as many as possible if less than five were eligible.
Figure 1 Selection of the index and comparison cohorts within one iteration (top), and selection of the heart failure cohort and comparison cohorts (bottom). Note: The comparison cohorts were matched to the index/heart failure cohort on sex, birth year, and calendar period.
Because index persons were characterized by no particular trait except being alive and without ischemic stroke on the index date, we considered the rates of ischemic stroke and mortality observed in the index cohort as true rates against which we could compare the rates observed in the matched comparison cohorts.
For a second analysis, we constructed index cohorts of persons aged >50 years from the general population. We did this by making the probability of being recruited into the index cohorts age-dependent. Thus, we set the probability of being recruited to 0 for those aged 50 years or younger on 1st January in a given year and [(age in years − 50)/50]% for those older than 50 years; for example, someone aged 60 years would have a 0.2% probability of being recruited. Again, using the three sampling strategies, we sampled five comparators for each index person, or as many as possible if less than five were eligible, and persons with prevalent ischemic stroke at the index date were ineligible to be included in the index and comparison cohorts.
We repeated this 1,000 times to obtain a measure of the variation of the outcome rates in the different index and comparison cohorts, and we used a new random sample of 50,000 individuals in each iteration.
Cohorts in the heart failure cohort study
To assess whether the sampling strategies would produce different results for a specific patient cohort, we selected a cohort of incident heart failure patients and sampled three comparison cohorts using the different sampling strategies.
To identify the cohort of patients with heart failure, we used all primary and secondary diagnoses in the DNPR inpatient and outpatient records from January 1, 1977, to August 31, 2012. To prevent inclusion of prevalent heart failure patients, we excluded all patients with a diagnosis of heart failure from 1977 through 1979, thus starting the study in 1980. We also excluded heart failure patients with a previous diagnosis of ischemic stroke and patients not living in Denmark at the time of their incident heart failure diagnosis. The remaining patients were included in the study, with the date of their first heart failure diagnosis serving as the index date ().
Using each of the three sampling strategies, we sampled five comparators from the CRS for each heart failure patient, or as many as possible if less than five were eligible. Individuals were ineligible to be selected as comparators if they had a prevalent diagnosis of heart failure or ischemic stroke on the index date of the heart failure patient.
Follow-up and statistical analyses
We followed members of each cohort for a maximum of 10 years from the index date, until occurrence of ischemic stroke, death, emigration, or August 31, 2012, whichever came first. It was possible for a person in a comparison cohort to become an index person/heart failure patient during follow-up. In this case, the person was enrolled into the index/heart failure cohort; however, the person was not censored from the relevant comparison cohort on the date of becoming an index person/heart failure patient, imitating an intention-to-treat type of analysis.Citation25 Had we chosen to censor comparators who became index persons during follow-up in the general population study, we would expect to see no difference in outcome rates as the censoring would be non-informative. In the heart failure study, censoring comparators who developed heart failure during follow-up would likely decrease the outcome rates in the comparison cohorts as the censoring would be informative, and we would expect the censored comparators to be at a higher risk of outcomes than the non-censored comparators.
We recorded data on the size of individual cohorts, median age and proportion of males, and number of comparators who became index persons/heart failure patients during follow-up in the respective comparison cohorts. We also computed duration of follow-up, number of persons who developed ischemic stroke or died during follow-up, rates of ischemic stroke and mortality, and the ratio of unique individuals to cohort size in the comparison cohorts sampled with replacement.
In the general population cohort study, we summarized these statistics by their median and interquartile range across all 1,000 iterations.
We further estimated the cumulative incidenceCitation26 of ischemic stroke and death in each cohort, treating one outcome as a competing event to the other. In the general population cohort study, we used the cumulative incidences to estimate risk differences of ischemic stroke and death between the comparison and the index cohorts for every month of follow-up. Based on the 1,000 iterations, we computed the 2.5th, 5th, 10th, 25th, 50th (median), 75th, 90th, 95th, and 97.5th percentiles of the risk differences and plotted medians, along with bands of symmetric percentiles, against time, for each sampling strategy. Similarly, in the general population cohort study, we computed hazard ratios of ischemic stroke and death using the index cohorts as the reference and presented the log-hazard ratios by box plots. If a valid strategy was used, log-hazard ratios should be normally distributed around zero, while hazard ratios should be log-normally distributed around one.
In the heart failure cohort study, we also computed hazard ratios of each outcome comparing the heart failure cohort to each comparison cohort. However, as the proportionality assumption was violated, we instead presented incidence rate ratios. We also recorded the number of matches sampled for each heart failure patient and computed incidence rate ratios of ischemic stroke and death after restricting the analysis to patients for whom the individual sampling strategy identified five comparators.
Sensitivity analyses
In the general population study we conducted two sensitivity analyses. First, we sampled one rather than five comparators for each index person in the index cohorts of persons aged >50 years. Second, we constructed index cohorts by recruiting anyone alive on 1st January in a given year with a chance of 0.5% rather than 0.1%.
In the heart failure cohort study, we also performed a sensitivity analysis by sampling one to one.
All analyses were carried out using SAS version 9.4 (Cary, NC, USA). The study was approved by the Danish Data Protection Agency (record number: 1-16-02-268-14). No approval from an ethics committee or informed consent from patients is required for registry studies in Denmark.
Results
General population cohort study
When anyone in the source population was recruited into the index cohort with a probability of 0.1%, the median size of the index cohorts was 1,000 persons, and the comparison cohorts were approximately five times larger. Generally, the median age and proportion of males were similar in the index and comparison cohorts (). This indicates that all three sampling strategies were successful in constructing comparison cohorts that resembled the index cohorts with respect to the matching factors.
Table 1 Characteristics of the index and comparison cohorts
When we compared comparison cohorts sampled without replacement in random order to the index cohorts, we observed a consistently positive median risk difference of death (). However, the magnitude of the median risk difference was minuscule throughout the follow-up and peaked at a value of just 0.15% (data not shown). Thus, overall we found no substantial difference between the index cohorts and the comparison cohorts sampled without replacement in random order (, and ).
Figure 2 Medians of estimated monthly risk differences of ischemic stroke and death comparing each of the comparison cohorts to the index cohorts, along with bands covering the interquartile range, 10th–90th, 5th–95th, and 2.5th–97.5th percentiles.
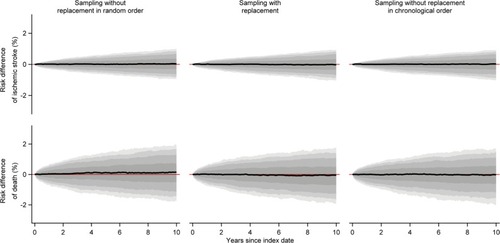
Figure 3 Box plots of log(hazard ratios) of ischemic stroke and death comparing the individual comparison cohorts to the index cohorts.
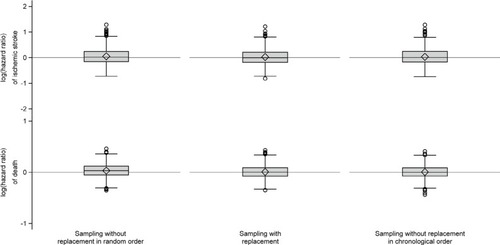
We found no systematic deviation from the index cohorts with respect to any outcome measure for either of the other two sampling strategies (, and ).
When we constructed index cohorts of people aged >50 years, the median size of the index cohort was almost 1,000 persons, there was a minority of males, and the median age was in the early seventies (). In the comparison cohorts, we were generally unable to find a sufficient number of matches, particularly when sampling without replacement in chronological order (). We found that sampling without replacement in random order led to increased outcome rates compared to the index cohorts resulting in positive median risk differences and log-hazard ratios (, and ). Furthermore, we observed negative risk differences of death when we compared comparison cohorts sampled without replacement in chronological order to the index cohorts ().
Figure 4 Medians of estimated monthly risk differences of ischemic stroke and death comparing each of the five to one sampled comparison cohorts to the index cohorts of persons aged >50 years, along with bands covering the interquartile range, 10th–90th, 5th–95th, and 2.5th–97.5th percentiles.
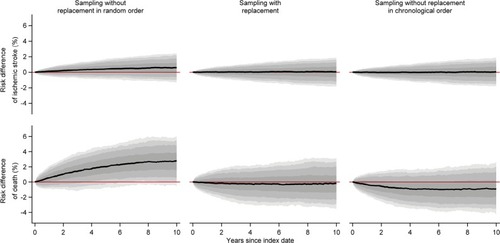
Figure 5 Box plots of log(hazard ratios) of ischemic stroke and death comparing the individual five to one sampled comparison cohort to the index cohorts of persons aged >50 years.
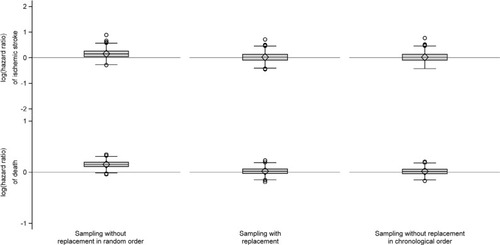
Table 2 Characteristics of the index cohorts of persons aged >50 years and their five to one sampled comparison cohorts
When we sampled one comparator for each member of the index cohort of persons aged >50 years, we observed no substantial difference between the sampling strategies, ie, all comparison cohorts generally resembled the index cohorts (, and ).
Figure 6 Medians of estimated monthly risk differences of ischemic stroke and death comparing each of the one to one sampled comparison cohorts to the index cohorts of persons aged >50 years, along with bands covering the interquartile range, 10th–90th, 5th–95th, and 2.5th–97.5th percentiles.
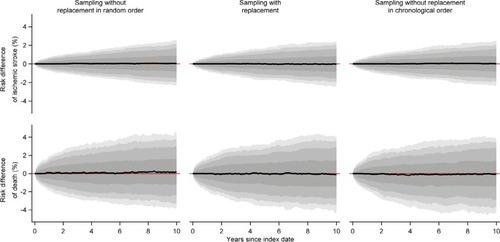
Figure 7 Box plots of log(hazard ratios) of ischemic stroke and death comparing the individual one to one sampled comparison cohort to the index cohorts of persons aged >50 years.
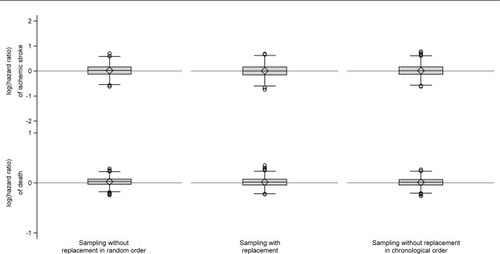
Table 3 Characteristics of the index cohorts of persons aged >50 years and their one to one sampled comparison cohorts
In the sensitivity analysis where we set the probability of being recruited into the index cohort to 0.5% for anyone alive in the source population on 1st January of each year, a median of 4,737 persons from the source population were recruited into the index cohort, and as a result the comparison cohorts became very large relative to the source population of 50,000 individuals (Table S1). We found that the comparison cohorts resembled the index cohorts with respect to sex and age distributions; however, sampling without replacement in chronological order resulted in smaller comparison cohorts than the other strategies (Table S1). With regards to outcomes, we found that sampling without replacement in random order led to positive risk differences and log-hazard ratios of both ischemic stroke and death compared to the index cohorts (Figures S1 and S2). Comparison cohorts sampled with replacement or without replacement in chronological order did not deviate substantially from the index cohort (Table S1, Figures S1 and S2).
Heart failure cohort study
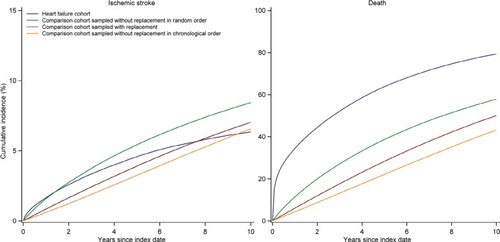
In the heart failure cohort (N=347,882), the median age was 77 years and a slight majority of patients were male (). When we sampled a comparison cohort without replacement in random order, the median age was slightly lower than in the heart failure cohort (), as a substantial number of heart failure patients were left without a match (Table S2). When we sampled without replacement in chronological order, almost one-fifth of the heart failure patients had no match (Table S2), resulting in a comparison cohort whose age distribution was substantially lower than in the heart failure cohort (). These problems did not occur when we sampled with replacement () or one to one (Table S3).
Table 4 Characteristics of the heart failure cohort and its comparison cohorts
Regarding outcomes, we found that the risks and rates of ischemic stroke and death in the comparison cohort sampled without replacement in random order were higher than those observed in the other comparison cohorts (, ). Furthermore, the risks and rates of outcomes in the comparison cohort sampled without replacement in chronological order were lower than in the comparison cohort sampled with replacement (, ).
Figure 8 Cumulative incidence of ischemic stroke and death in the heart failure cohort and the comparison cohorts sampled using different strategies.
However, when we sampled one to one, the differences between all comparison cohorts decreased, though the mortality rate was still elevated in the comparison cohort sampled without replacement in random order (Table S3, Figure S3). The results from the comparison cohorts sampled with replacement or without replacement in chronological order became almost identical (Table S3, Figure S3).
In the analysis where we restricted to patients for whom the individual sampling strategy identified five comparators, the differences in incidence rate ratios decreased when sampling without replacement in chronological order compared to sampling with replacement. However, the differences remained substantial (). Furthermore, when sampling without replacement in random order, the mortality rate ratio decreased ().
Discussion
In this study, we found that the three sampling strategies generated comparison cohorts with outcome rates similar to that observed in the index cohorts representing the general population, unless the index persons were aged >50 years or the comparison cohorts were very large compared to the source population. Thus, our hypothesis, that sampling without replacement in random order would result in comparison cohorts with increased outcome rates compared to the general population, was only confirmed in some settings in the general population cohort study. In the heart failure cohort study, we found that different sampling strategies generated substantially different results, both for fatal and non-fatal outcomes. However, differences between comparison cohorts for both the index cohort with persons aged >50 years and the heart failure cohort attenuated greatly when sampling one to one rather than five to one.
The null result in the first analysis of the general population cohort study suggests that even if the comparison cohort includes as many as 10% of the source population, the choice of sampling strategy may not in itself impact the results. That said, the sampling strategy may be important if comparators are at a substantial risk of getting the outcome. This was exemplified in our study by constructing index cohorts of people aged >50 years.
All three sampling strategies led to comparison cohorts with different characteristics when the index cohort comprised people aged >50 years. This was reflected in the heart failure cohort study, in which sampling without replacement failed to sample an adequate number of comparators, particularly when sampling in chronological order. As researchers typically exclude patients for whom no match can be found,Citation27,Citation28 it is an important observation that the age distribution was skewed toward lower age in the comparison cohort sampled without replacement in chronological order, compared with the heart failure cohort. It follows that if patients without matches were removed from the cohort under study, the remaining patients would constitute a selected (younger) subcohort.Citation23,Citation24 We attribute the lower outcome rates observed when sampling without replacement in chronological order, compared to sampling with replacement, to the age difference between members of the two comparison cohorts.
Several studies have been published in which a comparison cohort has been sampled from the general population.Citation5–Citation19 While a few studies reported sampling with replacement,Citation5,Citation19 the sampling strategy was not described in others.Citation6–Citation18
In addition to the sampling strategy, several other important factors must be considered when conducting a matched cohort study.Citation1 The sampling ratio, ie, the number of comparators sampled for each patient, is an important consideration, as highlighted by the sensitivity analyses in which we changed the sampling ratio. If subgroup analyses are conducted, it may be necessary to sample a greater number of comparators to ensure their availability for all index persons than if no subgroup analyses are conducted. Furthermore, to get precise estimates, more comparators are needed if the outcome of interest is rare rather than frequent. However, it is questionable if there is much to gain in statistical power when the sampling ratio exceeds four.Citation29 Also, if the patient cohort is large compared to the general population, conditional on matching factors, it may not be feasible to sample many comparators for each index person. In previous studies, the sampling ratio has varied between 4Citation17 and 100.Citation6,Citation13
Another aspect to consider is the matching factors. In addition to sex, birth year, and calendar period, comparison cohorts have been matched on factors such as residencyCitation16,Citation17 or a specific comorbidity.Citation17 However, matching on some confounders may reduce rather than improve efficiency.Citation30 Furthermore, increasing the number of matching factors increases the risk of finding no eligible comparators, because the matching factors function as eligibility criteria for the comparison cohort.
Our study has several limitations. Although it showed differences between comparison cohorts selected by different sampling strategies in some settings, it did not present means of quantifying the size of these differences in general. Furthermore, we chose heart failure to illustrate the sampling strategies because this disease is common among the elderly,Citation23 and old age is generally associated with high rates of ischemic stroke and mortality. For this reason, the differences in outcome rates between comparison cohorts may be extreme, compared to differences that would be observed in smaller patient cohorts with less frequent outcomes in the general population. Also, in the heart failure cohort study, we did not know the true outcome rates in the general population, unlike in the general population study. Moreover, there might be differences between sampling strategies which we did not detect, eg, we did not assess baseline covariates beyond the matching factors.
Conclusion
When the comparators were at a substantial risk of getting the outcome, the sampling strategy impacted study results. Thus, sampling without replacement in random order led to comparison cohorts with inflated outcome rates in such settings, while sampling without replacement in chronological order led to an unsuccessful matching when sampling five to one. Therefore, sampling with replacement may be advisable in matched cohort studies when the outcome of interest is common among comparators. Alternatively, one to one matching may be applicable.
Acknowledgments
Funding: This paper was supported by the Program for Clinical Research Infrastructure (PROCRIN) established by the Lundbeck Foundation and the Novo Nordisk Foundation and administered by the Danish Regions. PROCRIN had no role in the conception and design of the study, nor in the collection, analyses, or interpretation of the data, nor in the writing of the manuscript and the decision to submit for publication.
Disclosure
The authors report no conflicts of interest in this work.
References
- RothmanKJGreenlandSLashTLModern Epidemiology3rd edPhiladelphiaWolters Kluwer Health/Lippincott Williams & Wilkins2008
- SchmidtMPedersenLSørensenHTThe Danish Civil Registration System as a tool in epidemiologyEur J Epidemiol201429854154924965263
- LudvigssonJFOtterblad-OlaussonPPetterssonBUEkbomAThe Swedish personal identity number: possibilities and pitfalls in healthcare and medical researchEur J Epidemiol2009241165966719504049
- HerrettEGallagherAMBhaskaranKData resource profile: clinical practice research datalink (CPRD)Int J Epidemiol201544382783626050254
- AdelborgKHorváth-PuhóEOrdingAPedersenLToft SørensenHHendersonVWHeart failure and risk of dementia: a Danish nationwide population-based cohort studyEur J Heart Fail201719225326027612177
- Broesby-OlsenSFarkasDKVestergaardHRisk of solid cancer, cardiovascular disease, anaphylaxis, osteoporosis and fractures in patients with systemic mastocytosis: a nationwide population-based studyAm J Hematol201691111069107527428296
- CorrainiPOrdingAGHendersonVWCancer, other comorbidity, and risk of venous thromboembolism after stroke: a population-based cohort studyThromb Res2016147889327710857
- FaurschouMAhlströmMGLindhardsenJBaslundBObelNImpact of pre-existing co-morbidities on mortality in granulomatosis with polyangiitis: a cohort studyRheumatology201655464965326615030
- FaurschouMAhlströmMGLindhardsenJObelNBaslundBRisk of diabetes mellitus among patients diagnosed with giant cell arteritis or granulomatosis with polyangiitis: comparison with the general populationJ Rheumatol2017441788327744394
- FolkestadLHaldJDCanudas-RomoVMortality and causes of death in patients with osteogenesis imperfecta: a register-based nationwide cohort studyJ Bone Miner Res201631122159216627345018
- HallagerSBrehm ChristensenPLadelundSMortality rates in patients with chronic hepatitis C and cirrhosis compared with the general population: a Danish cohort studyJ Infect Dis2017215219220127803168
- IversenLHPedersenLRiisAFriisSLaurbergSSørensenHTPopulation-based study of short- and long-term survival from colorectal cancer in Denmark, 1977–1999Br J Surg200592787388015892155
- Jensen-FangelSPedersenLPedersenCLow mortality in HIV-infected patients starting highly active antiretroviral therapy: a comparison with the general populationAIDS2004181899715090834
- LegangerJSøborgMKMortensenLQGregersenRRosenbergJBurcharthJAssociation between diverticular disease and Ehlers-Danlos syndrome: a 13-year nationwide population-based cohort studyInt J Colorectal Dis201631121863186727604811
- Lindahl NorbergAMontgomerySMBottaiMHeymanMHovénEIShort-term and long-term effects of childhood cancer on income from employment and employment status: a national cohort study in SwedenCancer201712371238124827870013
- LohseNHansenABPedersenGSurvival of persons with and without HIV infection in Denmark, 1995–2005Ann Intern Med20071462879517227932
- MatthewsALanganSMDouglasIJSmeethLBhaskaranKPhosphodiesterase type 5 inhibitors and risk of malignant melanoma: matched cohort study using primary care data from the UK clinical practice research datalinkPLoS Med2016136e100203727299522
- MellemkjaerLPapadopoulosFCPukkalaECancer incidence among patients with anorexia nervosa from Sweden, Denmark and FinlandPLoS One2015105e012801826000630
- SvenssonEHorváth-PuhóEStokholmMGSørensenHTHendersonVWBorghammerPAppendectomy and risk of Parkinson’s disease: a nationwide cohort study with more than 10 years of follow-upMov Disord201631121918192227621223
- LohrSLSampling: Design and Analysis2nd edBoston, MABrooks/Cole2010
- SuissaSImmortal time bias in observational studies of drug effectsPharmacoepidemiol Drug Saf200716324124917252614
- SchmidtMSchmidtSASandegaardJLEhrensteinVPedersenLSørensenHTThe Danish National Patient Registry: a review of content, data quality, and research potentialClin Epidemiol2015744949026604824
- RogerVLEpidemiology of heart failureCirc Res2013113664665923989710
- Writing Group MembersMozaffarianDBenjaminEJHeart disease and stroke statistics – 2016 update: a report from the American Heart AssociationCirculation20161334e38e36026673558
- DanaeiGRodríguezLACanteroOFLoganRHernánMAObservational data for comparative effectiveness research: an emulation of randomised trials of statins and primary prevention of coronary heart diseaseStat Methods Med Res2013221709622016461
- KalbfleischJDPrenticeRLThe Statistical Analysis of Failure Time Data2nd edHoboken, NJWiley2002
- MansourniaMAHernánMAGreenlandSMatched designs and causal diagramsInt J Epidemiol201342386086923918854
- SjölanderAGreenlandSIgnoring the matching variables in cohort studies – when is it valid and why?Stat Med201332274696470823761197
- DalyLEBourkeGJBourkeGJInterpretation and Uses of Medical Statistics5th edMalden, MABlackwell Science2000
- GreenlandSMorgensternHMatching and efficiency in cohort studiesAm J Epidemiol199013111511592293747