
Abstract
Purpose
To use recorded weight values to internally validate weight status and weight change coding in the primary care Electronic Health Record (EHR).
Patients and methods
We included adult patients with weight-related Read codes recorded in the UK’s Clinical Practice Research Datalink EHR between 2000 and 2017. Weight status codes were compared to weight values recorded on the same day and positive predictive values (PPVs) were calculated for commonly used codes. Weight change codes were validated using three methods: the percentage (%) difference in kilograms at the time of the code and 1) the previous weight measurement, 2) the weight predicted using linear regression, and 3) the historic mean weight. Weight change codes were validated if estimates were consistent across two out of three methods.
Results
A total of 8,108,481 weight codes were recorded in 1,000,002 patients’ EHR. Twice as many were recorded in females (n=5,208,593, 64%). The mean body mass index for “overweight” codes ranged from 31.9 kg/m2 to 46.9 kg/m2 and from 17.4 kg/m2 to 19.2 kg/m2 for “underweight” codes. PPVs for the most commonly used weight status codes ranged from 81.3% (80%–82.5%) to 99.3% (99.2%–99.4%). Across the estimation methods, and using only validated weight change codes, mean weight loss ranged from – 5.2% (SD 5.8%) to −7.9% (SD 7.3%) and mean weight gain from 4.2 % (SD 5.5%) to 7.9 % (SD 8.2%). The previous and predicted weight methods were most consistent.
Conclusion
We have developed an internationally applicable methodology to internally validate weight-related EHR coding by using available weight measurement data. We demonstrate the UK Read codes that can be confidently used to classify weight status and weight change in the absence of weight values. We provide the first evidence from primary care that a Read code for unexpected weight loss represents a mean loss of ≥ 5 % in a 6-month period, which was broadly consistent across age groups and gender.
Introduction
Extremes of weight and unexpected weight change are associated with multiple disease states such as cancer and cardiovascular disease, with increased morbidity and mortality.Citation1–Citation3 Although weight is a simple low-cost biometric retained in multiple clinical prediction models,Citation4–Citation7 weight measurements are commonly missing (not at random) from Electronic Health Records (EHRs) in primary care.Citation8,Citation9 In clinical settings where weight is not measured routinely, it is most commonly measured in relation to the clinical problem, chronic disease, or in patients who appear overweight or underweight.Citation10,Citation11 When measured, kilograms (kg), pounds, and body mass index (BMI) may be recorded inconsistently in structured or free text.Citation12,Citation13 Weight-related codes may be recorded in the presence or absence of weight measurements. The relationship between the two has not been investigated in any setting.
There is no international standardization of how and when clinical codes are chosen and entered into an EHRCitation14 leading to inconsistencies in coding practice and discordant coding hierarchies, such as Read and the ICD coding.Citation15 Murtaugh et al identified bodyweight measures in the free text of 8% of the Veterans Administration EHR when no coded weight information was present.Citation13 Price et al showed an increased prevalence of jaundice and visible hematuria when free text evidence of these clinical features was added to coded entries.Citation16 At present, the major UK EHR platforms provide only coded EHR data for research.Citation17 Read codes are used in the English National Health Service to document the clinical history and care process of patients attending primary care.Citation18 The Read code hierarchy is complex with multiple overlapping terms including for symptoms and signs, investigations, diagnoses, and medications.Citation19
Code lists are used to define variables of interest in epidemiological studies but there is no accepted method for code list generation, so researchers develop their own strategies and collate existing lists.Citation20–Citation22 Guidelines recommend that code lists are published to promote transparency and to allow replication and validation studies in other datasets.Citation23 This is not yet common practice: out of 25 studies included in a recent systematic review, none of the 19 studies reported the code lists used to define weight loss.Citation10 Validation studies of coding aim to ensure the accuracy and credibility of epidemiological studiesCitation24 and often utilize external questionnaire or linked secondary care data (ie, external validation).Citation25–Citation27 In comparison, internal validation uses corroborative data from the source dataset, such as blood pressure measurement data to verify hypertension coding.Citation28 Validation studies of symptom codes are relatively uncommon, probably due to the scarcity of external datasets holding detailed symptom information.Citation28,Citation29
The aim of this study was to develop an internationally applicable methodology to assess the internal validity of weight-related coding by utilizing the objective weight values recorded in the EHR. Once developed, this methodology could be applied to any EHR dataset containing weight-related codes and weight measurements. To achieve this, we investigated the average weight value at each weight-related code, the positive predictive value (PPV) of commonly used weight status codes, and the degree of weight change prior to weight change codes, and developed several methods to do so and compared these.
Patients and methods
Study population
We accessed the Clinical Practice Research Datalink (CPRD) GOLD database, an ongoing primary care database of anonymized EHR data that covers a representative sample of ~6.9% of the UK population in terms of age, sex, and ethnicity, from ~674 participating practices using the Vision EHR at the time of this study.Citation8 Patients aged >18 years for the study period of January 1, 2000 and December 31, 2017 were included in this analysis. All included were eligible for linkage to the National Cancer Registration and Analysis Service cancer registry, practice and patient level Index of Multiple Deprivation data, and Office for National Statistics mortality data, as independent markers of data quality rather than disease status.
Weight-related codes
A long list of candidate weight-related codes was generated by searches of the Read terms in the medical dictionary of the CPRD code browser using: *weight*, *body mass index*, *BMI*, *fat*, *thin*, *cachexi*. The Read code hierarchies were then explored around the candidate codes to identify potential related terms not picked up by the initial searching.
Code categorization
All candidate codes were categorized into four groups by the authors (PA, BDN, WH, RP, SS) using Microsoft Excel to reach consensus (). These were
Figure 1 Flowchart of candidate code categorization.
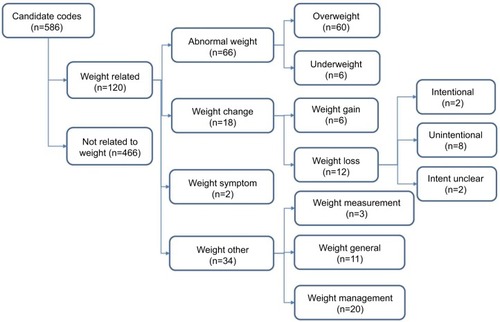
Abnormal weight – codes that reported a weight outside of normality
Weight change – codes that suggested weight change
Weight “symptom” – codes that reported a weight “symptom” without clarifying which
Weight other – codes that reported weight measurement, weight related advice, or a normal weight
All codes were then extracted from CPRD together with the associated date, the patient’s age at the time of the weight code, their gender, and all available height values.
Weight measurements
Weight measurement values were extracted from CPRD for every patient with a “weight-related” code and a bespoke method developed to convert implausible kg values. Weight values were initially assumed to be measured in kg and the median weight (in kg) for each patient was calculated. Weight values were then assumed to be recorded in stones and pounds, or pounds alone, and converted into kg. Original kg values that fell outside of the range of less than half to more than 1.5 times the individual’s median kg value were replaced by the converted value if the converted value fell within this range. Finally, any remaining measurements under 20 kg or over 200 kg were dropped. As expected, and as previously described in large population-based cohorts,Citation30 the distribution of the remaining weight measurements was slightly positively skewed.
Body mass index
BMI values were generated using the available height and weight data. An algorithm was developed to identify and convert heights recorded as centimeters into meters and remaining heights less than 1.3 m or greater than 2.1 m were dropped. The closest previous height was carried forward if there was no height measurement on the day of the weight measurement and the closest later height carried backwards if there was no height prior to or on the day of weight measurement.
Statistical analysis
Validity of weight-related coding
To investigate whether weight values could be used to validate weight status codes, weight values recorded on the same day as the abnormal weight codes were retained and the mean weight calculated (with corresponding 95% CIs). Weight symptom codes were also included in this analysis to understand their use, and two normal BMI codes as an additional sense check. PPVs (with corresponding 95% CIs) were also calculated for weight codes that specified a BMI range, using the BMI values as the reference standard.
Validity of weight-change codes
Weight measurement values were ordered by date leading up to the first weight change code in each patient. Again, weight symptom codes were also included in this analysis to understand their use.
Weight change was estimated using three methods. These were the percentage (%) difference between the kg value at the time of the code and the
Previous weight value within a 2-year period
Predicted weight value for the time of the weight code, estimated by fitting a linear regression model for each patient through 3-monthly means of all weight values recorded in the preceding 5 yearsCitation31
Historic mean weight of each patient using values recorded in the preceding 5 years
We also calculated estimates for the absolute difference using these three methods. For the second and third methods, the weight measurement closest to the weight code and within the month preceding the weight code was classified as the weight value at the time of the weight code if there was no weight measurement on the day of the weight code. For all three methods, implausible changes in weight were set as those less than the first percentile and greater than the ninety-ninth percentile, and were excluded. This approach ensured that we minimized data loss, and increased the likelihood that we would capture weight change where present, whilst excluding implausible extreme changes.
The mean weight change (95% CI) and median weight change IQR were calculated for each weight code for each method. Codes for which the IQR remained below 0 for at least two of the three methods were considered validated as weight loss codes. Codes for which the IQR remained above 0 for at least two of the three methods were considered validated as weight gain codes. By ensuring that the IQR remained above or below 0, we reduced the influence of outliers and ensured that at least 75% of values accurately represented the weight change described by the code.
This study was approved as a component of the Independent Scientific Advisory Committee Protocol 16_164A2.Citation32 All analyses were performed in Stata version 15.
Results
A total of 8,108,481 weight-related codes were recorded in CPRD between January 1, 2000 and December 31, 2017 in 1,000,002 individuals. Twice as many weight-related codes were recorded in females (n=5,208,593, 64%) than males. They were most commonly recorded in individuals aged 50–60 years (1,533,516, 19%); 40–50 years (1,470,111, 18%); and 60–70 years (1,425,102, 18%). The three most commonly used codes were “O/E – weight” (5,378,411, 66%) which usually accompanies a weight measurement value, “body mass index” (1,023,792, 13%), and “ideal weight” (314,499, 4%).
Internal validity of abnormal weight coding
presents the most frequently used codes by increasing mean weight. In total, 396,864 (60%) abnormal weight codes were accompanied by a weight measurement value recorded on the same day, 108,647 (16%) had a prior weight measurement value recorded, and 154,939 (23%) codes had no prior weight values.
Table 1 The face validity of the 30 most commonly used abnormal weight codes
The most commonly entered abnormal weight codes were “obesity” (193,221, 7%), “body mass index 30+ – obesity” (100,687, 4%), and “weight symptom” (96,442, 4%). The mean BMI for weight codes classified as “overweight” ranged from 31.9 to 46.9. The mean BMI of weight codes classified as “underweight” ranged from 17.4 to 19.2. The mean BMI for the remaining “weight symptom” code was 32.6.
Due to the large number of codes included in the analysis, CIs were narrow for all codes (). Specific codes such as “body mass index 25–29 – overweight” were associated with appropriate mean BMI value with relatively narrow SD (mean =27.5, SD=2). Less specific codes, such as “obesity”, were associated with an appropriate mean BMI value but with less precision as demonstrated by a larger SD (mean =37.7, SD=6). Non-specific codes, such as “weight symptom”, were associated with a relatively wide variation (mean =32.6, SD=9). The PPVs were high for the more commonly used and specific weight codes, ranging from 81.3% (80%–82.5%) for “Body Mass Index low K/M2” to 99.3% (99.2%–99.4%) for “O/E – overweight” ().
Table 2 PPV of the most commonly used and specific abnormal weight codes
Internal validity of weight change coding
shows the percent weight change expressed as the median (IQR) weight change for each estimation method and each weight change or weight symptom code. Ten codes met the criterion for validation as indicators of weight loss and four codes met the criterion for validation as indicators of weight gain: at least two of the three IQRs obtained for each code did not include 0. The two weight symptom codes could not be confidently reclassified as weight loss or weight gain codes and were retained as “weight symptom” codes (, ).
Figure 2 Comparison of the mean percent weight change estimated using three methods for each weight change code (hollow circles) and combined by weight change group (full circles).
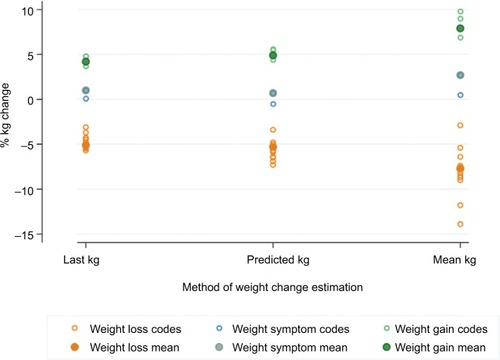
Table 3 Internal validation of weight change Read codes using three methods of percent weight change estimation
Amount of weight change prompting a weight change code
The mean weight loss prior to a validated weight loss code ranged from 5.2% (95% CI, −5.2% to −5.2%) to −7.9% (−8% to −7.8%), depending on the method (). For females, the amount of weight loss ranged from −5.4% (−5.5% to −5.3%) to −8.3% (−8.4% to −8.2%), and in males from −4.8% (−4.9% to −4.7%) to −7.4% (−7.5% to −7.3%). Within each method, there was little variation in the mean weight loss across age groups, although there was a slight trend toward greater weight loss being observed in the oldest age groups: mean weight loss for the trend method ranged from −5.2% (−5.7% to −4.7%) to −5.8% (−6% to −5.6%) across age groups and from −6.3% (−6.5% to −6.1%) to −10.2% (−10.3% to −10.1%) using the historic mean.
Table 4 Weight change by weight change group, gender, and age group for each of the three methods of percent weight change estimation
The mean weight gain prior to a validated weight gain code ranged from 4.2% (95% CI, 4.1%–4.3%) to 7.9% (7.8%–8%), depending on the method (). Weight gain codes were 3.5 times more likely to be recorded in females. For females, the amount of weight gain ranged from 4.5% (4.4%–4.6%) to 8.4% (8.3%–8.5%), and in males from 3.3% (3.2%–3.4%) to 6.4% (6.2%–6.6%). Each method demonstrated a different pattern in weight gain across age groups: the trend method suggested a similar pattern of weight gain across age groups, whilst the previous and historic mean methods suggested a decreasing amount of weight gain triggered a code with increasing age.
The mean weight change associated with a weight symptom code ranged from 0.7% (95% CI, 0.6%–0.8%) to 2.7% (2.6%–2.8%), depending on the method (). For females with a weight symptom code, weight change ranged from 1% (0.8%–1.2%) to 3.2% (3.1%–3.3%), and for males from −0.3% (−0.5% to −0.1%) to 0.9% (0.7%–1.1%). Whichever method was used to assess change in weight, weight symptom codes were more commonly used after weight loss in older people, with weight change ranging from –2.3% (−3% to −1.6%) to −6.7% (−7.2% to −6.2%) in the 80+ years age groups, while the same weight symptom code ranged from 1% (0.6%–1.4%) to 4.5% (4.2%–4.8%) in the 18–29 years age group.
Method consistency
For the validated weight change codes, there was greater consistency between the method using the previous weight measurement value and the predicted measurement method compared with the historic mean method (). In addition, the greater the time between the weight code and the last weight measurement, the greater the weight change (). To evaluate the potential bias of modeling only individuals with valid BMI measures, we compared information on age and gender for those with and without a valid measure. The proportion of individuals with weight measured was consistent across age group and gender.
Table 5 Association between time to previous weight measurement and estimated weight change
Discussion
We report the methodology and findings of the first internal EHR validation study using the available weight measurement values and weight-related coding. We demonstrate which weight-related Read codes can be used to quantify weight with the greatest precision and have provided estimates of weight and PPV for the most commonly used codes. Out of the three methods developed to assess the extent of weight change prior to a weight change code, the two that performed similarly were the difference from the preceding weight measurement and the predicted weight based on linear trend. Weight loss codes were typically employed when weight loss was ≥5%, especially when the previous weight measurement was over 6 months ago. Weight symptom codes were not used by general practitioners to record weight change and were used variably depending on patient age.
Comparison with existing literature
We have found no directly comparable studies. We are aware of only one English study using weight measurement data to define weight loss: a case-control study investigating the risk of symptoms for colorectal cancer in different age groups.Citation33 Weight loss was defined by using the highest recorded weight in the preceding 2 years, leading to the possibility of under-or over-estimation of weight change. We generated BMI for each weight measurement using the available height information in CPRD using a similar algorithm to Bhaskaran et al, who compared BMI recorded in CPRD to that from a representative sample of the population of England (the Health Survey for England [HSE]).Citation34 They found that mean BMI of those with data in CPRD more closely matched the HSE when the CPRD data on BMI were limited to those recorded in the last 3 years. Based on this, we confined our validations of weight status to individuals with a weight status code and a weight measurement occurring on the same day. Using this method, the mean BMI was 29.5, higher than the mean BMI of 27.0 recorded by the HSE for the same period.Citation35 This difference most probably occurred because there are a large number of codes to describe being overweight and only a few to described being underweight. When restricted to the “body mass index” code denoting that a BMI measurement had taken place, the mean BMI was 27.2, demonstrating external validity with the HSE.
Strengths and limitations
As weight is not measured routinely in English primary care, weight measurement is an example of informative observation: sicker patients (potentially with a weight-related problem) are more likely to attend and to have their weight measuredCitation36 or a weight-related code (some weight values may be entered under free text).Citation37 Sperrin et al modeled the time to next BMI measurement as a recurrent event using anonymized UK primary care data in patients with type 2 diabetes in Salford, UK.Citation38 They showed that the higher the previous BMI measurement the higher the likelihood of repeat BMI measurement, that an increasing trend in BMI lowered the likelihood of repeat BMI measurement, and that the presence of comorbidity increased the likelihood of BMI measurement. To minimize the impact of weight coding on subsequent weight measurement patterns, we restricted our analysis of weight change to measurements prior to the first weight change code.
Weight typically increases slowly throughout adulthood with gain in adiposity and then slowly decreases from the seventh decade of life as muscle mass is slowly lost.Citation39 Deviations from this underlying trend are unusual without an identifiable pathological or behavioral explanation.Citation3 The slight trend observed toward greater weight loss in the oldest age groups may represent expected muscle loss or alternatively underlying serious disease in the frail elderly, but as we do not have disease status we cannot investigate these possibilities in this dataset. To account for expected weight loss, we chose a simple linear regression modeling approach in preference to more sophisticated modeling techniques such as regression with restricted cubic splines. Linear regression was feasible as we estimated weight over short periods up to 5 years and generated 3-monthly means to reduce the effect of measurement error after cleaning the data for outliers.
Implications
Although the findings of this study have specific relevance to epidemiologists utilizing Read coded data derived from the UK’s EHR, the methods developed are transferrable to any EHR that includes weight measurement data and weight-related coding used in any health care economy.
The REporting of studies Conducted using Observational Routinely-collected Data (RECORD) statement is a reporting guideline for observational studies using health data collected for non-research purposes.Citation23 It recommends that the validation steps used when choosing codes or algorithms to select the study population should be provided or referenced, together with a complete list of codes and algorithms used to classify exposures, outcomes, confounders, and effect modifiers. For example, a cross-sectional analysis recently examined diabetes coding between 1995 and 2014 and showed that code selection made a significant difference to the incidence of diabetes.Citation40 To this end, we present validated weight-related and weight change Read codes for use in primary care EHR epidemiology. Such codes will be invaluable for any epidemiological study interested in weight as a covariate and in particular in disease areas with clear links between weight change and clinical outcomes. For example, extant studies assessing whether weight loss predicts the presence of cancer have mostly defined weight loss using weight loss Read codes without publishing the code lists.Citation10 Without understanding which codes have been used to define weight loss and the internal validity of these codes, it has been impossible to ascertain the accuracy of the prevalence and the predictive value of weight loss. Further research should investigate whether estimates of the predicted value of weight loss are modified when using the codes found here to classify weight loss with greater confidence.
This improved transparency could further inform clinical practice by, for example, informing clinicians about how much weight change is predictive of cancer or other serious disease in primary care. In primary care populations, the optimal percentage weight loss to maximize its predictive value as a sign of underlying serious illness has remained elusive.Citation3 In UK primary care, the NICE guidelines for suspected cancer recommend that unexpected weight loss in combination with other clinical features should prompt further investigation for cancer.Citation41 A subsequent review suggested that unexpected weight loss alone should prompt investigation for cancer.Citation32 Neither of these recommendations defined the degree of weight loss, or the time period of loss, that should prompt action but both included studies that defined unexpected weight loss using Read coding. Previous reviews recommended that ≥5% involuntary weight loss over 6–12 months should be investigated.Citation3,Citation42,Citation43 However, these data mainly come from populations recruited from hospital outpatients or inpatients, most of whom were elderly, where the prevalence of cancer and other serious disease is much higher than in primary care.
This study provides the first evidence from primary care that a Read code for unexpected weight loss represents a mean loss of ≥5% in a 6-month period, which was broadly consistent across age groups and gender.
Conclusion
Our study reports the findings of an internationally applicable methodology to internally validate weight-related coding using the available weight measurement values. We demonstrate the UK Read codes that can be confidently used to classify weight status and weight change in the absence of weight values. We also provide the first evidence from primary care that a Read code for unexpected weight loss represents a mean loss of ≥5% in a 6-month period, a finding that is broadly consistent across age groups and gender.
Data sharing statement
The categorization is available from the corresponding author.
Disclosure
The authors report no conflicts of interest in this work.
References
- BhaskaranKDouglasIForbesHdos-Santos-SilvaILeonDASmeethLBody-mass index and risk of 22 specific cancers: a population-based cohort study of 5·24 million UK adultsThe Lancet20143849945755765
- di AngelantonioEBhupathirajuSNWormserDBody-mass index and all-cause mortality: individual-participant-data meta-analysis of 239 prospective studies in four continentsThe Lancet201638810046776786
- WongCJInvoluntary weight lossMed Clin North Am201498362564324758965
- Hippisley-CoxJCouplandCBrindlePDevelopment and validation of QRISK3 risk prediction algorithms to estimate future risk of cardiovascular disease: prospective cohort studyBMJ2017357j2099
- Hippisley-CoxJCouplandCBrindlePDevelopment and validation of QRISK3 risk prediction algorithms to estimate future risk of cardiovascular disease: prospective cohort studyBMJ2017357j209928536104
- KharraziHChangHYHeinsSEWeinerJPGudzuneKAAssessing the impact of body mass index information on the performance of risk adjustment models in predicting health care costs and utilizationMed Care201856121042105030339574
- Usher-SmithJAHarshfieldASaundersCLExternal validation of risk prediction models for incident colorectal cancer using UK BiobankBr J Cancer2018118575075929381683
- HerrettEGallagherAMBhaskaranKData resource profile: clinical practice research datalink (CPRD)Int J Epidemiol201544382783626050254
- KontopantelisEParisiRSpringateDAReevesDLongitudinal multiple imputation approaches for body mass index or other variables with very low individual-level variability: the mibmi command in StataBMC Res Notes20171014128086961
- NicholsonBDHamiltonWO’SullivanJAveyardPHobbsFRWeight loss as a predictor of cancer in primary care: a systematic review and meta-analysisBr J Gen Pract201868670e311e32229632004
- VerberneLDMNielenMMJLeemrijseCJVerheijRAFrieleRDRecording of weight in electronic health records: an observational study in general practiceBMC Fam Pract201819117430447691
- HamiltonWLancashireRSharpDPetersTJChengKKMarshallTThe risk of colorectal cancer with symptoms at different ages and between the sexes: a case-control studyBMC Medicine2009711719374736
- MurtaughMAGibsonBSReddDZeng-TreitlerQRegular expression-based learning to extract bodyweight values from clinical notesJ Biomed Inform20155418619025746391
- NichollsSGLanganSMBenchimolEIRoutinely collected data: the importance of high-quality diagnostic coding to researchCMAJ201718933E1054E105528827435
- van WalravenCAustinPAdministrative database research has unique characteristics that can risk biased resultsJ Clin Epidemiol201265212613122075111
- PriceSJStapleySAShephardEBarracloughKHamiltonWTIs omission of free text records a possible source of data loss and bias in clinical practice research datalink studies? A case-control studyBMJ Open201665e011664
- BradleySHLawrenceNRCarderPUsing primary care data for health research in England – an overviewFuture Hospital Journal201853207212
- CiminoJJReview paper: coding systems in health careMethods Inf Med1996354–52732849019091
- BensonTThe history of the read codes: the inaugural James read memorial lecture 2011Inform Prim Care201119317318222688227
- WatsonJNicholsonBDHamiltonWPriceSIdentifying clinical features in primary care electronic health record studies: methods for codelist developmentBMJ Open2017711e019637
- SpringateDAKontopantelisEAshcroftDMClinicalCodes: an online clinical codes Repository to improve the validity and reproducibility of research using electronic medical recordsPLoS One201496e9982524941260
- WilliamsRKontopantelisEBuchanIPeekNClinical code set engineering for reusing EHR data for research: a reviewJ Biomed Inform20177011328442434
- BenchimolEISmeethLGuttmannAThe reporting of studies conducted using observational Routinely-collected health data (record) statementPLoS Med20151210e100188526440803
- EhrensteinVPetersenISmeethLHelping everyone do better: a call for validation studies of routinely recorded health data. Clin Epidemiol20168495127110139
- KhanNFHarrisonSERosePWValidity of diagnostic coding within the general practice Research database: a systematic reviewBr J Gen Pract201060572e128e13620202356
- ThomasKHDaviesNMetcalfeCWindmeijerFMartinRMGunnellDValidation of suicide and self-harm records in the clinical practice research datalinkBr J Clin Pharmacol201376114515723216533
- ThomasSLEdwardsCJSmeethLCooperCHallAJHow accurate are diagnoses for rheumatoid arthritis and juvenile idiopathic arthritis in the general practice Research Database?Arthritis Rheum20085991314132118759262
- HerrettEThomasSLSchoonenWMSmeethLHallAJValidation and validity of diagnoses in the general practice research database: a systematic reviewBr J Clin Pharmacol201069141420078607
- NissenFQuintJKWilkinsonSMüllerovaHSmeethLDouglasIJValidation of asthma recording in electronic health records: a systematic reviewClin Epidemiol2017964365629238227
- HermanussenMDanker-HopfeHWeberGWBody weight and the shape of the natural distribution of weight, in very large samples of German, Austrian and Norwegian conscriptsInt J Obes Relat Metab Disord200125101550155311673780
- AltmanDPractical Statistics for Medical ResearchLondonChapman and Hall/CRC1990
- NicholsonBDAveyardPHobbsFDRWeight loss as a predictor of cancer and serious disease in primary care: an ISAC-approved CPRD protocol for a retrospective cohort study using routinely collected primary care data from the UKDiagnostic and Prognostic Research2018211
- HamiltonWLancashireRSharpDPetersTJChengKMarshallTThe risk of colorectal cancer with symptoms at different ages and between the sexes: a case-control studyBMC Med2009711719374736
- BhaskaranKForbesHJDouglasILeonDASmeethLRepresentativeness and optimal use of body mass index (BMI) in the UK Clinical Practice Research Datalink (CPRD)BMJ Open201339e003389
- NHS Digital [website on the Internet]Health Survey for England – England’s changing health since the 1990s - Weight Trends2018 Available from: http://healthsurvey.hscic.gov.uk/data-visualisation/data-visualisation/explore-the-trends/weight.aspxAccessed August 28, 2018
- GaspariniAAbramsKRBarrettJKMixed effects models for health-care longitudinal data with an informative visiting process: a Monte Carlo simulation studyarXiv2018180800419v1
- KharraziHAnzaldiLJHernandezLThe value of unstructured electronic health record data in geriatric syndrome case identificationJournal of the American Geriatrics Society20186681499150729972595
- SperrinMPetherickEBadrickEInformative observation in health data: association of past level and trend with time to next measurementStud Health Technol Inform201723526126528423794
- WallaceJISchwartzRSEpidemiology of weight loss in humans with special reference to wasting in the elderlyInt J Cardiol2002851152112163206
- TateARDungeySGlewSBeloffNWilliamsRWilliamsTQuality of recording of diabetes in the UK: how does the GP’s method of coding clinical data affect incidence estimates? cross-sectional study using the CPRD databaseBMJ Open201771e012905
- Suspected Cancer: Recognition and Referral [webpage on the Internet]National Institute for Health and Care Excellence2015 Available from: https://www.nice.org.uk/guidance/ng12Accessed August 28, 2018
- GaddeyHLHolderKUnintentional weight loss in older adultsAm Fam Physician201489971872224784334
- McminnJSteelCBowmanAInvestigation and management of unintentional weight loss in older adultsBMJ20113421d173221447571