
Abstract
Purpose
The aim of this study was to determine the association between smoking and breast cancer after adjusting for smoking misclassification bias and confounders.
Methods
In this case–control study, 1000 women with breast cancer and 1000 healthy controls were selected. Using a probabilistic bias analysis method, the association between smoking and breast cancer was adjusted for the bias resulting from misclassification of smoking secondary to self-reporting as well as a minimally sufficient adjustment set of confounders derived from a causal directed acyclic graph (cDAG). Population attributable fraction (PAF) for smoking was calculated using Miettinen’s formula.
Results
While the odds ratio (OR) from the conventional logistic regression model between smoking and breast cancer was 0.64 (95% CI: 0.36–1.13), the adjusted ORs from the probabilistic bias analysis were in the ranges of 2.63–2.69 and 1.73–2.83 for non-differential and differential misclassification, respectively. PAF ranges obtained were 1.36–1.72% and 0.62–2.01% using the non-differential bias analysis and differential bias analysis, respectively.
Conclusion
After misclassification correction for smoking, the non-significant negative-adjusted association between smoking and breast cancer changed to a significant positive-adjusted association.
Plain Language Summary
Why Was the Study Done?
The evidence about the association between breast cancer and self-reported smoking is inconsistent. Previous research has shown considerable measurement error in the definition of smoking. This measurement error needs to be corrected when quantifying an unbiased estimate of the effect of smoking on breast cancer.
What Did the Researchers Do and Find?
To correct misclassification error due to smoking, we used probabilistic bias analysis methods. We determined the sensitivity and specificity values of self-reported smoking and subsequently calculated the expected number of smoking exposure in case and control groups. Then, we calculated the positive and negative predictive values in two groups. We then constructed a new dataset with imputation of the values of exposure to smoking based on the positive and negative predictive values. We assessed the association between smoking and breast cancer adjusted for confounders assuming scenarios of both differential and non-differential misclassification errors. The probabilistic bias analysis showed that smoking has a significant positive effect on breast cancer with the ORs ranging from 1.7 to 2.8 for different scenarios. Our results also showed that 0.62% to 2.01% of all breast cancers were attributed to smoking.
What Do These Results Mean?
The results of our study demonstrated that there was substantial measurement error in self-reported smoking leading to attenuation or masking of the true association in the conventional analysis.
Introduction
Breast cancer is the most prevalent and important cause of cancer-related deaths in women worldwide, accounting for 25% of all new cancers as well as 15% of total cancer-related deaths.Citation1 Advanced age, low physical activity, high BMI, positive family history, nulliparity, early menarche, use of OCP, and drinking alcohol are the most important risk factors of breast cancer.Citation2 Smoking is another risk factor that has been the subject of many studies for more than three decades. However, no clear association has been established between tobacco use and breast cancer yet.Citation3 A report by the United States’ Surgeon General failed to show an association between smoking and breast cancer in 2004;Citation4 However, existence of a weak but significant association between smoking and breast cancer was shown in a subsequent Surgeon General report.Citation5 Several systematic reviews and meta-analyses have been conducted to assess the contradictory results from the two reports; some of the studies included in these reviews have shown a positive association between smoking and breast cancerCitation6–Citation11 while some others rejected.Citation12–Citation14 However, no concrete explanation has been yet provided for the discrepant results. Misclassification is an important contributor to bias in epidemiologic studies and in the case of smoking and breast cancer it might exist due to under-reporting of smoking information (possibly because of its social stigma).Citation15 Several studies have examined the degree of misclassification in smoking measurement.Citation6,Citation16,Citation17 Since measurement error may decrease causal effect estimatesCitation16,Citation18 between smoking and breast cancer, it might be one of the reasons for the inconsistent and contradictory results. Therefore, to examine the effect of smoking on breast cancer, it might be prudent to use statistical methods suggested for correction of misclassification bias secondary to self-reported smoking.Citation19
Generally, two approaches have been developed to correct misclassification. The probabilistic bias analysis method (PBAM) proposed by Lash and Fox,Citation20,Citation21 and Bayesian method (BM) proposed by MacLehoseCitation22 and Gustafson.Citation23 Both methods can control bias.Citation24–Citation26 However PBAM, which is based on the Monte Carlo simulation,Citation20,Citation21,Citation27 is conceptually simpler and easier to perform. Studies have shown similar results will be produced by selecting similar priors in both methods.Citation28 Contrary to simple bias and multidimensional analysesCitation29 that perform bias correction using a set of few bias parameter (sensitivity and specificity) values, PBAM creates simulation intervals that are adjusted for a probability distribution of bias parameters as well as confounders and random error through record-level correction of the misclassified exposure.Citation20 The general concept behind PBAM was introduced by Fox et alCitation20 and Lash et alCitation21 generalized it for polytomous exposure variables.
Although the association between smoking and breast cancer has been investigated in several studies,Citation3–Citation14 none of them have adjusted for measurement bias secondary to self-reported smoking. Therefore, this study was conducted to evaluate the effect of smoking on breast cancer after adjusting for smoking misclassification bias as well as confounders using PBAM.
Materials and Methods
Design and Sampling
This case–control study was conducted in Tehran, Iran. The protocol of the study was approved by the Ethics Committee of Tehran University of Medical Sciences (IR.TUMS.SPH.REC.1398.072). All participants provided written consent for this study. The study was undertaken according to the Declaration of Helsinki Protocol. Detailed descriptions of the methodology for this study have been published previouslyCitation30 and are also summarized here. The cases included 1000 breast cancer patients that were selected prospectively (incidence cases) from breast cancer detection clinics in Tehran, Iran. Breast cancer diagnosis was confirmed using both pathological and clinical data. The control group included 1000 non-cancer individuals that were selected using a proportional-to-size stratified random sampling across all Tehran districts.
The inclusion criteria included Iranian nationality, age 25–75 years, willingness to participate in the study, and active residency in Tehran. Pregnant women, women who had other cancers in addition to breast cancer, and healthy women who received preventive treatments for breast cancer were excluded from the study. One of the investigators created a questionnaire that listed all established risk factors of breast cancer which were included in the data collection forms.Citation30 The questionnaire was validated only in terms of content validity. However, we note that the misclassification problem in the question of smoking which is closely related to the construct validity exists, as the question was subject to recall and under-reporting biases. Clinical measurements including weight and height were measured by a trained female research assistant. The questionnaire contained seven sections including 1) demographic and general data, 2) physical activity, 3) use of cigarettes, tobacco, and alcohol, 4) diet, 5) data related to pregnancy and past medical history (history of breast diseases also history of pregnancy along with their delivery dates), 6) family history, and 7) clinical measurements including weight and height, weight at puberty (age 12), also weight at 20 and 30 years of age.
Statistical Analysis
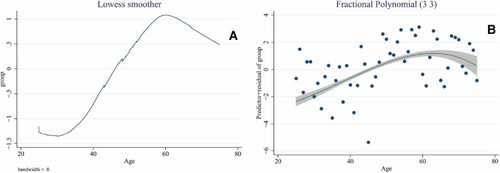
A list of confounders was prepared by searching relevant literature. A causal directed acyclic graph (cDAG)Citation31–Citation33 was generated using the DAGitty packageCitation34 (). A minimally sufficient set for confounding adjustment was determined according to Pearl’s back-door criterion.Citation35 In the following, a conventional multivariable logistic regression model was fitted to evaluate the association between smoking and breast cancer adjusted for the set of confounders. Adjusted ORs with corresponding 95% confidence intervals were computed. The appropriate scale for age was determined using locally weighted scatterplot smoother (LOWESS) and fractional polynomials. The LOWESS and fractional polynomial plot for the association between age and breast cancer have been presented in . All analyses were done using the R software.
Figure 1 Causal directed acyclic graph (cDAG) for the effect of smoking and breast cancer. Minimally sufficient adjustment set included age, alcohol, education, physical activity and socioeconomic status (SES).
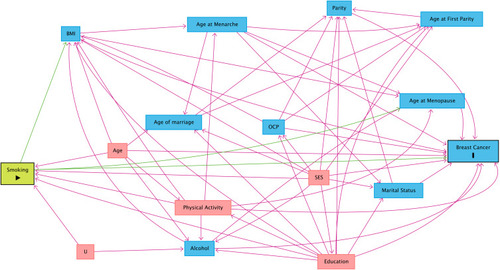
Figure 2 LOWESS (A) and fractional polynomial plot (B) for the association between age and breast cancer.
Bias Analysis Using PBAM
Step 1: To determine the sensitivity and specificity of self-reported smoking by undertaking a systematic literature review using electronic research engines Scopus, PubMed, and Web of Science using the following key words: “sensitivity”, “specificity”, “self-reported smoking”, “validity”, “accuracy”, “measurement error” and “measurement bias” as keywords. The retrieved studies were screened in terms of study titles, abstracts, and full texts. All the articles that met the latter were read carefully and data on sensitivity, specificity, the gold standard used, and confidence intervals reported for specificity and sensitivity were extracted. Next, the results were merged using an inverse-variance weighted random-effects model.Citation36
Step 2: Our systematic review resulted in six studies of which five had been conducted in cancer patientsCitation37–Citation41 and one had been done in noncancer.Citation42 The pooled estimates of specificity and its 95% confidence intervals (CIs) were 94% (89–100) in cancer patients, 98% (95–100) in noncancer subjects, and 95% (91–99) in the total population. Moreover, pooled estimates of sensitivity and their 95% CIs were 84% (73–95) in cancer patients, 90% (83–97) in noncancer patients, and 85% (76–94) in the total population.
Step 3: In the next stage of the analysis, probability distributions (including triangular, Beta and logistic) were generated and their parameters were chosen so that the median of probability distribution was equal to the median of the pooled estimate. In addition, their dispersion was made to be consistent with 95% confidence intervals. The values obtained for both cancer and the noncancer population were used for determination of the distribution parameters for differential misclassification bias analysis and the values obtained for the total population were used for determination of the distribution parameters in non-differential misclassification bias analysis. The probability distribution parameters for Triangular, Beta and Logistic distribution are shown in . It is noteworthy that the correlation for sensitivity and specificity in both case and control groups was considered 0.8 in the differential misclassification bias analysis.
Table 1 The Probability Distributions Parameters for Triangular, Beta and Logistic Distributions in Case and Control Groups
Step 4: The next step involved developing a sensitivity/specificity matrix to estimate the expected number of exposed and unexposed cases according to Formula 1:
where A is the expected number of exposed cases, B is the expected number of unexposed cases, A* is the number of observed exposed cases, and B* is the number of observed unexposed cases. We randomly selected values for sensitivity and specificity from the probability distributions mentioned in step 3 and subsequently used these values in formula 1. We then solved Formula 1 for obtaining values A and B based on Formulas 2 and 3: (for more explanation, see Appendix)
Step 5: Then next step involved calculating both a positive predictive value (PPV) and negative predictive value (NPV) using Formulas 4 and 5:
In case of out-of-range values for the PPV and NPV (<0 or >1), the iteration process was discarded and steps 4–5 were repeated.
Step 6: The next step involved generating a new variable termed “expected exposure” which was generated among cases according to the status of observed exposure in the dataset and PPV/NPV. The distribution of this variable followed a Bernoulli distribution with the probability parameters equal to PPV and NPV for exposed and unexposed cases, respectively. Thus, a uniform random variable (Ui) with the range 0–1 was generated. For an exposed case, the value of expected exposure was considered 1 (exposed) if Ui<PPV; otherwise, it was considered 0 (unexposed). On the contrary for an unexposed case, the value of expected exposure was considered 0 (unexposed) if Ui<NPV; otherwise, it was considered 1 (exposed). To estimate expected exposure among controls, steps 4–6 were repeated.
Step 7: In the next step, the same conventional logistic regression model (aforementioned above) was administered again using expected values for exposure (smoking) derived in step 6 rather than observed exposure values and adjusted ORs with 95% confidence interval for expected exposure was obtained.
Step 8: The ORs obtained in Step 7 were the result of one round of analysis. To obtain a simulation interval, steps 4–7 were repeated using probabilistic bias analysis and the Monte Carlo simulation technique. For this purpose, a Monte Carlo sampling of the probability distributions considered in step 3 was performed. This procedure corrects the misclassification bias in self-reported smoking. Steps 4–7 were then repeated. After repeating these steps, the point estimate was determined using 50 percentiles and the Monte Carlo sensitivity analysis (MCSA) interval was determined using 2.5 and 97.5 percentiles for ORs obtained from the conventional logistic regression model in step 7. Thus, the effects of different sources involved in misclassification bias were also considered in the analysis.Citation22
This point estimate with MCSA interval was only corrected for misclassification bias and confounding. Random error is also needed to be addressed. Thus, before step 4 a sample was taken from the dataset using the bootstrap method. Then, steps 4–8 were done so that confounding control and misclassification adjustment were applied to the bootstrap sample. The 95% MCSA intervals incorporating bias and random error were obtained using 2.5 and 97.5 percentiles over bootstrap samples. It should be mentioned that there were 500 bootstrap samples. Moreover, Monte Carlo was repeated 1000 times in each bootstrap sample yielding 500,000 adjusted ORs.
Population Attributable Fraction (PAF)
PAF for smoking was calculated using the Miettinen Formula:Citation43
where is the proportion of smokers in the case group after misclassification bias correction in step 6. Based on rarity assumption, we used the OR adjusted for misclassification bias and confounders, obtained in step 7 instead of the RR in Formula 6.Citation44,Citation45 It should be noted that for the PAF calculation, misclassification bias was corrected using Monte Carlo simulation. Random error was corrected using the bootstrap technique as well.
Results
This study was conducted in 1000 cases and 932 healthy controls. The mean (SD) age of participants was 50.40 (9.70) years in the case group and 42.16 (9.49) in the control group. The characteristics of the case and control groups have been presented in . The causal DAG for the effect of smoking on breast cancer has been depicted in . According to , the minimally sufficient adjusted set included age, alcohol consumption, education level, physical activity, and socioeconomic status (SES).
Table 2 Characteristics of Cases and Controls
Conventional and Bias Analyses
presents the results of both the conventional analysis and bias analysis for the effect of smoking on breast cancer. Based on the conventional logistic regression analysis, the OR between smoking and breast cancer was 0.64 (95% CI: 0.36 to 1.13). There was no substantial evidence against the independence of breast cancer from smoking, though the 95% confidence interval was compatible with the significant protective effects. According to the results of non-differential misclassification bias analysis, the adjusted OR estimate was 2.63 (95% MCSA interval: 1.75 to 4.19) using triangular distribution, 2.63 (95% MCSA interval: 1.83 to 3.88) using beta distribution, and 2.69 (95% MCSA interval: 1.36 to 6.31) using logistic distribution for the bias parameters. On the contrary, considering differential misclassification, the adjusted OR estimate was 1.73 (95% MCSA interval: 0.87 to 5.06), 2.83 (95% MCSA interval: 1.20 to 15.98) and 2.09 (95% MCSA interval: 1.05 to 10.15) using the triangular, beta and logistic distributions for the bias parameters, respectively. The distributions of adjusted ORs using different bias parameters have been displayed in .
Figure 3 The distribution of ORs adjusted for measurement bias and confounding, assuming non-differential (A, B and C) and differential (D, E and F) misclassification errors. The distribution of bias parameter was assumed to be triangular (A and D), beta (B and E) and logistic (C and F).
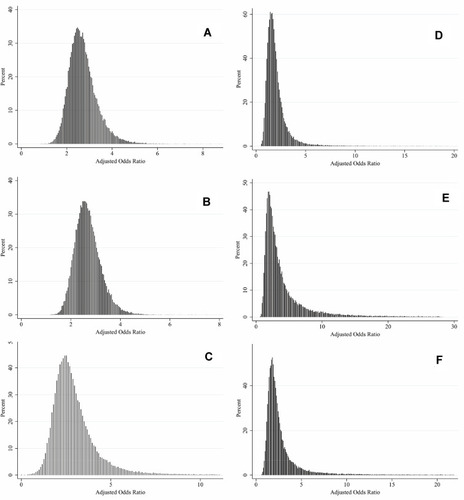
Table 3 Adjusted Odds Ratio with 95% Confidence Interval or MCSA Interval Using Conventional and Probabilistic Bias Analyses.
Population Attributable Fraction
shows PAF estimates with 95% confidence intervals/MCSA intervals using conventional and bias analyses. PAF estimate for smoking was −2.53% (95% CI: −8.01 to 0.52) in conventional analysis. Using the triangular, beta and logistic distributions for the bias parameter in non-differential bias analysis, the PAF estimate for smoking was 1.55% (95% MCSA interval: 0.56 to 2.89), 1.36% (95% MCSA interval: 0.41 to 2.50) and 1.72% (95% MCSA interval: 0.25 to 4.07), respectively, whereas in the differential bias analysis, they were 0.62% (95% MCSA interval: −0.21 to 3.52), 2.01% (95% MCSA interval: 0.05 to 5.12) and 0.95% (95% MCSA interval: 0.01 to 4.35).
Table 4 The Estimates of Population Attributable Fraction with 95% Confidence Intervals or MCSA Intervals Using Conventional and Bias Analyses
Discussion
In this study, we assessed the association between smoking and breast cancer after controlling three sources of error including misclassification, confounding, and random error. It should be pointed out that PBAM is a type of Monte Carlo sensitivity analysis that is very similar to Bayesian methodsCitation28 where results depend on prior distributions.Citation20,Citation28 So the results of PBAM depend on the distribution of sensitivity and specificityCitation46 of the misclassified variable under question. Using the same prior distributions for sensitivity and specificity parameters, the results of PBAM and Bayesian methods should be very similar.Citation28 Although there are different sources for determining the distribution of sensitivity and specificity such as expert opinion and study validation,Citation16,Citation47 it seems the medical literature happens to be potentially the best resources for this information.Citation48 The use of medical literature allows investigators to incorporate subjective data in their study while the merging of different sources can neutralize the effects of these judgments.Citation20 Since different sources report different results in the literature, data from these sources were pooled using inverse-variance weighting techniques in this study in order to obtain more robust estimates of bias parameters.
Based on the results of the conventional analysis in the present study, we did not observe sufficient evidence against independence of self-reported smoking and breast cancer. Although our finding is contrary to the results of most studies introducing smoking as a risk factor for major diseases including cancer,Citation3,Citation5-Citation11 it is important to acknowledge that case–control studies are prone to misclassification bias because of the presence of recall and self-reporting biases.Citation14 Cohort studies are much less prone to differential measurement error because exposure ascertainment occurs before the onset of the outcome (although differential measurement error can still occur due to dependence of exposure measurement on for some risk factors such as age) and prospective data collection should also reduce measurement error due to poor recall of past exposures.Citation49 However, similar to case–control studies of smoking and breast cancer, the results of cohort studies were inconsistent (the results are not shown but available upon request).
The Collaborative Group on Hormonal Factors of Breast Cancer merged 53 cohort and case–control studies. They concluded there was no association between smoking and breast cancer.Citation14 Chen et alCitation12 merged 51 studies and could not detect any association between smoking and breast cancer in Chinese females. Moreover, Okasha et alCitation13 evaluated 13 studies. They demonstrated the relationship between smoking and breast cancer in early life was very inconsistent. Comparison of the results, unadjusted for smoking misclassification is interesting as some researchers found a positive association between passive smoking and breast cancerCitation12,Citation13 and attributed this inconsistency to measurement error in self-reported smoking.Citation14 However, the roles of other factors including low prevalence of smoking in womenCitation12 also unmeasured confounding variables alike alcohol consumption should not be forgotten.Citation13,Citation14 Our study found a strong effect of smoking on breast cancer after adjusting for misclassification bias and confounders such as alcohol consumption. In other words, the estimate of the adjusted OR was in the range of 2.6–2.7 when controlling for non-differential misclassification and 1.7–2.8 when controlling for differential misclassification, indicating a marked underestimation of the smoking effect without proper adjustment for misclassification bias.
Few studies have utilized PBAM for misclassification correction in epidemiologic studies. Therefore, our extensive search did not yield any other studies similar to ours. Some studies applied this method in other contexts.Citation50–Citation55 For example, De Silva et alCitation53 found a stronger association between the risk of maternal transfusion and inter-pregnancy interval after adjusting for misclassification of severe maternal morbidity. Bodnar et alCitation51 found the association between self‐reported pre-pregnancy BMI and pregnancy outcomes was overestimated without considering misclassification. However, Momoli et alCitation50 and Bodnar et alCitation52 reported that the observed relationship did not change markedly after applying PBAM compared to conventional methods.
We have also estimated PAF for smoking, adjusted for misclassification. It is clear that smoking is one of the most important risk factors for many cancers and 20% of all cancers are caused by smoking.Citation56 Since PAF is a function of risk ratio and prevalence,Citation57 its estimated prevalence may not reflect the actual prevalence due to measurement error for smoking. The results showed that PAF ranged from 1.36% to 1.72% in non-differential bias analysis and from 0.62% to 2.01% in differential bias analysis. The breast cancer PAF estimate was reported to be 4.6% for smoking in the Netherlands by Van Gemert et alCitation58 based on another study by Neutel et al,Citation59 also examined the effect of smoking in Canadian women, the PAF estimate for smoking ranged from 3.1% to 4.1% during 1994–2006. The PAF estimates of the aforementioned studies were higher than our study, which could be due to the lower prevalence of smoking in Iranian women.
Both non-differential and differential misclassification were considered in the present study. However, differential misclassification of exposure is more common in traditional case–control studies as exposure data are collected after disease diagnosis.Citation16 Simple bias analysis can also be done by applying bias correction in each confounder strata along with summarization. However, this method is time-consuming and does not take into account distribution of the bias parameters which can produce sparse data problems.Citation20,Citation47 Other methods such as empirical and Bayesian methods are more challenging in terms of computations while using PBAM, bias can be corrected by calculating the bias parameters probabilistically and considering the distribution of bias parameter to impute the expected exposure.Citation20,Citation46 This method is simpler and can be used to provide the estimate of associations adjusted for multiple covariates using logistic regression, proportional hazards regression, and other popular regression models.Citation20
Some strengths of our study include conducting a systematic search for the values of bias parameters, using different distributions for bias parameters, and assuming scenarios of differential and non-differential misclassification error. Also, we used a causal diagram to identify a minimally sufficient set for adjustment for confounding. To avoid over-adjustment bias, we did not adjust for the mediators on the pathway between smoking and breast cancer such as menopause or age at menopause. Finally, we carefully adjusted for the difference in age between cases and controls using LOWESS and fractional polynomials.
Our study has some limitations. First, there was some misclassification in using ever/never smoking instead of “pack-years” which may reduce statistical power, induce a biased impression of dose-response, and change non-differential error to differential.Citation60 Another limitation of the present study was the inability to control for unmeasured confounding alike diet or misclassification in self-reporting confounders such as alcohol. We should note that presence of measurement error in a confounder like alcohol will lead to residual confounding although our study objective was correcting exposure misclassification but not unmeasured confounding. We appreciate the misclassification error in smoking and alcohol is likely correlated which may increase the residual confounding.Citation60 However, the prevalence of alcohol in IranCitation61,Citation62 which used an indirect method for estimation is very low (even less than 3.5% observed in the present study) and so alcohol probably cannot be a strong confounder.
We also calculated the E-valueCitation63 ie, the minimum strength of association, on the risk ratio (odds ratio for rare outcomes) scale, that an unmeasured confounder would need to have with both the treatment and outcome, conditional on the measured covariates, to fully explain away a specific treatment–outcome association. The results for different bias analysis scenarios are presented in . The Table shows that alcohol needs to have a large association (OR=5.1 in one differential scenario) with both smoking and breast cancer to fully explain the observed association between smoking and breast cancer. It should be noted that the calculation of E-values assumes no adjustment was made for alcohol although we did adjust the self-reported alcohol in the analysis.
Table 5 E-Values for Alcohol Consumption Assuming No Adjustment Was Made for the Variable
Conclusion
Conventional statistical analysis cannot quantify the effect of smoking on breast cancer due to misclassification of self-reported smoking. In this study, conventional analysis failed to show an association between smoking and breast cancer even though smoking has been confirmed to be a strong risk factor for many cancers. Analyses using PBAM indicated that smoking has a significant positive effect on breast cancer with ORs ranging from 1.7 to 2.8 for different scenarios. The results also suggested that 0.62% to 2.01% of breast cancers were attributed to smoking. Thus, the incidence of breast cancer can be reduced, although slightly in our population due to low prevalence of smoking, through implementing smoking cessation programs. However, future confirmatory studies can provide more evidence for proper assessment of the effects of variables prone to misclassification bias and potentially encourage researchers to use PBAM methodology in the future.
Abbreviations
BM, Bayesian method; PBAM, probabilistic bias analysis method; cDAG, causal directed acyclic graph; LOWESS, locally weighted scatterplot smoother; CIs, confidence intervals; PPV, positive predictive value; NPV, negative predictive value; MCSA, Monte Carlo sensitivity analysis; PAF, population attributable fraction; SES, socioeconomic status.
Author Contributions
All authors contributed to data analysis, drafting and revising the article, gave final approval of the version to be published, and agreed to be accountable for all aspects of the work.
Acknowledgments
This article was derived from Dr Pakzad’s PhD thesis, entitled: “The impact of smoking on breast cancer by control of smoking misclassification bias and adjust of confounding by using probabilistic bias analysis method”, approved at Tehran University of Medical Sciences (registration number: 240/1405, 19/01/2019). We thank Dr Mahyar Etminan for his helpful comments on the paper.
Disclosure
The authors report no conflicts of interest in this work.
References
- Bray F, Ferlay J, Soerjomataram I, Siegel RL, Torre LA, Jemal A. Global cancer statistics 2018: GLOBOCAN estimates of incidence and mortality worldwide for 36 cancers in 185 countries. CA Cancer J Clin. 2018;68(6):394–424. doi:10.3322/caac.2149230207593
- Nelson HD, Zakher B, Cantor A, et al. Risk factors for breast cancer for women aged 40 to 49 years: a systematic review and meta-analysis. Ann Intern Med. 2012;156(9):635–648. doi:10.7326/0003-4819-156-9-201205010-0000622547473
- Terry PD, Rohan TE. Cigarette smoking and the risk of breast cancer in women: a review of the literature. Cancer Epidemiol Biomarkers Prev. 2002;11(10):953–971.12376493
- U.S. Department of Health and Human Services. The Health Consequences of Smoking: A Report of the Surgeon General. Atlanta, GA: U.S. Department of Health and Human Services, Centers for Disease Control and Prevention, National Center for Chronic Disease Prevention and Health Promotion, Office on Smoking and Health; 2004.
- U.S. Department of Health and Human Services. The Health Consequences of Involuntary Exposure to Tobacco Smoke: A Report of the Surgeon General. Atlanta, GA: U.S. Department of Health and Human Services, Centers for Disease Control and Prevention, Coordinating Center for Health Promotion, National Center for Chronic Disease Prevention and Health Promotion, Office on Smoking and Health; 2006.
- Reynolds P. Smoking and breast cancer. J Mammary Gland Biol. 2013;18(1):15–23. doi:10.1007/s10911-012-9269-x
- Hruba D. Smoking and breast cancer. Klinicka Onkologie. 2013;26(6):389–393. doi:10.14735/amko201338924320585
- Macacu A, Autier P, Boniol M, Boyle P. Active and passive smoking and risk of breast cancer: a meta-analysis. Breast Cancer Res Treat. 2015;154(2):213–224. doi:10.1007/s10549-015-3628-426546245
- Johnson KC, Miller AB, Collishaw NE, et al. Active smoking and secondhand smoke increase breast cancer risk: the report of the Canadian expert panel on tobacco smoke and breast cancer risk (2009). Tob Control. 2011;20(1):e2. doi:10.1136/tc.2010.035931
- Lee PN, Hamling J. Environmental tobacco smoke exposure and risk of breast cancer in nonsmoking women: a review with meta-analyses. Inhal Toxicol. 2006;18(14):1053–1070. doi:10.1080/0895837060094543217050342
- Sadri G, Mahjub H. Passive or active smoking, which is more relevant to breast cancer. Saudi Med J. 2007;28(2):254–258.17268706
- Chen C, Huang Y-B, Liu X-O, et al. Active and passive smoking with breast cancer risk for Chinese females: a systematic review and meta-analysis. Chin J Cancer. 2014;33(6):306–316. doi:10.5732/cjc.013.1024824823992
- Okasha M, McCarron P, Gunnell D, Smith GD. Exposures in childhood, adolescence and early adulthood and breast cancer risk: a systematic review of the literature. Breast Cancer Res Treat. 2003;78(2):223–276. doi:10.1023/A:102298891875512725422
- Collaborative Group on Hormonal Factors in Breast Cancer. Alcohol, tobacco and breast cancer–collaborative reanalysis of individual data from 53 epidemiological studies, including 58 515 women with breast cancer and 95 067 women without the disease. Br J Cancer. 2002;87(11):1234–1245. doi:10.1038/sj.bjc.660059612439712
- Khalagi K, Mansournia MA, Motevalian S-A, et al. An ad hoc method for dual adjusting for measurement errors and nonresponse bias for estimating prevalence in survey data: application to Iranian mental health survey on any illicit drug use. Stat Methods Med Res. 2018;27(10):3062–3076. doi:10.1177/096228021769093929298600
- Blair A, Stewart P, Lubin JH, Forastiere F. Methodological issues regarding confounding and exposure misclassification in epidemiological studies of occupational exposures. Am J Ind Med. 2007;50(3):199–207. doi:10.1002/ajim.2028117096363
- Adams-Campbell L, Devine P, Eaton D, et al. Breast Cancer and the Environment: A Life Course Approach. Washington, DC: National Acad. Press; 2012.
- Jurek AM, Greenland S, Maldonado G. Brief report: how far from non-differential does exposure or disease misclassification have to be to bias measures of association away from the null? Int J Epidemiol. 2008;37(2):382–385. doi:10.1093/ije/dym29118184671
- Luta G, Ford MB, Bondy M, Shields PG, Stamey JD. Bayesian sensitivity analysis methods to evaluate bias due to misclassification and missing data using informative priors and external validation data. Cancer Epidemiol. 2013;37(2):121–126. doi:10.1016/j.canep.2012.11.00623290580
- Fox MP, Lash TL, Greenland S. A method to automate probabilistic sensitivity analyses of misclassified binary variables. Int J Epidemiol. 2005;34(6):1370–1376. doi:10.1093/ije/dyi18416172102
- Lash TL, Fox MP, Thwin SS, et al. Using probabilistic corrections to account for abstractor agreement in medical record reviews. Am J Epidemiol. 2007;165(12):1454–1461. doi:10.1093/aje/kwm03417406006
- MacLehose RF, Olshan AF, Herring AH, Honein MA, Shaw GM, Romitti PA. Bayesian methods for correcting misclassification an example from birth defects epidemiology. Epidemiology. 2009;20(1):27–35. doi:10.1097/EDE.0b013e31818ab3b019234399
- Gustafson P. Measurement Error and Misclassification in Statistics and epidemiology: Impacts and Bayesian Adjustments. Chapman and Hall/CRC; 2003.
- Moradzadeh R, Mansournia MA, Ghiasvand R, Baghfalaki T, Nadrian H, Holakouie-Naieni K. Impact of age at menarche on breast cancer: the assessment of recall bias. Arch Iran Med. 2019;22(2):65–70.30980640
- Moradzadeh R, Mansournia MA, Baghfalaki T, Nadrian H, Gustafson P, McCandless LC. The impact of maternal smoking during pregnancy on childhood asthma: adjusted for exposure misclassification; results from the National Health and Nutrition Examination Survey, 2011–2012. Ann Epidemiol. 2018;28(10):697–703. doi:10.1016/j.annepidem.2018.07.01130150159
- Moradzadeh R, Mansournia MA, Baghfalaki T, Ghiasvand R, Noori-Daloii MR, Holakouie-Naieni K. Misclassification adjustment of family history of breast cancer in a case-control study: a bayesian approach. Asian Pac J Cancer Prev. 2015;16(18):8221–8226. doi:10.7314/APJCP.2015.16.18.822126745064
- Lash TL, Fox MP, Fink AK. Applying Quantitative Bias Analysis to Epidemiologic Data. Springer Science & Business Media; 2011.
- MacLehose RF, Gustafson P. Is probabilistic bias analysis approximately Bayesian? Epidemiology. 2012;23(1):151–158. doi:10.1097/EDE.0b013e31823b539c22157311
- Greenland S. Basic methods for sensitivity analysis of biases. Int J Epidemiol. 1996;25(6):1107–1116. doi:10.1093/ije/25.6.11079027513
- Salehiniya H, Haghighat S, Parsaeian M, et al. Iranian breast cancer risk assessment study (IRBCRAS): a case control study protocol. WCRJ. 2018;5:1–5.
- Mansournia MA, Higgins JP, Sterne JA, et al. Biases in randomized trials: a conversation between trialists and epidemiologists. Epidemiology. 2017;28(1):54–59. doi:10.1097/EDE.000000000000056427748683
- Mansournia MA, Hernán MA, Greenland S. Matched designs and causal diagrams. Int J Epidemiol. 2013;42(3):860–869. doi:10.1093/ije/dyt08323918854
- Etminan M, Collins G, Mansournia M. Using causal diagrams to improve the design and interpretation of medical research. Chest. 2020. In Press.
- Textor J, van der Zander B, Gilthorpe MS, Liśkiewicz M, Ellison GT. Robust causal inference using directed acyclic graphs: the R package ‘dagitty’. Int J Epidemiol. 2016;45(6):1887–1894. doi:10.1093/ije/dyw34128089956
- Pearl J. Causality: Models, Reasoning and Inference. Vol. 29 Cambridge University Press; 2000.
- Harris RJ, Deeks JJ, Altman DG, Bradburn MJ, Harbord RM, Sterne JA. Metan: fixed- and random-effects meta-analysis. Stata J. 2008;8(1):3–28. doi:10.1177/1536867X0800800102
- Alberg AJ, Worley ML, Tooze JA, et al. The validity of self-reported recent smoking in head and neck cancer surgical patients. Otolaryngol Head Neck Surg. 2015;153(6):990–995. doi:10.1177/019459981559438526195573
- Kvalvik LG, Nilsen RM, Skjærven R, et al. Self-reported smoking status and plasma cotinine concentrations among pregnant women in the Norwegian Mother and Child Cohort Study. Pediatr Res. 2012;72(1):101–107. doi:10.1038/pr.2012.3622441375
- Martínez Ma E, Reid M, Jiang R, Einspahr J, Alberts DS. Accuracy of self-reported smoking status among participants in a chemoprevention trial. Prev Med. 2004;38(4):492–497. doi:10.1016/j.ypmed.2003.12.00615020184
- Sandhu S, Humphris G, Whitley S, Cardozo A, Sandhu A. Smoking habits in patient’s who have been treated for an oral cancer: validation of self-report using saliva cotinine. Oral Oncol. 2004;40(6):576–578. doi:10.1016/j.oraloncology.2003.11.00615063384
- Studts JL, Ghate SR, Gill JL, et al. Validity of self-reported smoking status among participants in a lung cancer screening trial. Cancer Epidemiol Biomarkers Prev. 2006;15(10):1825–1828. doi:10.1158/1055-9965.EPI-06-039317035388
- Hoseini M, Yunesian M, Nabizadeh R, et al. Biomonitoring of tobacco smoke exposure and self-reported smoking status among general population of Tehran, Iran. Environ Sci Pollut Res Int. 2016;23(24):25065–25073. doi:10.1007/s11356-016-7619-827677995
- Miettinen OS. Proportion of disease caused or prevented by a given exposure, trait or intervention. Am J Epidemiol. 1974;99(5):325–332. doi:10.1093/oxfordjournals.aje.a1216174825599
- Mansournia MA, Altman DG. Population attributable fraction. BMJ. 2018;360:k757. doi:10.1136/bmj.k75729472187
- Khosravi A, Nielsen R, Mansournia MA. Methods matter: population attributable fraction (PAF) in sport and exercise medicine. Br J Sports Med. 2020;1–6.31594793
- Lash TL, Fink AK. Semi-automated sensitivity analysis to assess systematic errors in observational data. Epidemiology. 2003;14(4):451–458. doi:10.1097/01.EDE.0000071419.41011.cf12843771
- Greenland S, Mansournia MA, Altman DG. Sparse data bias: a problem hiding in plain sight. BMJ. 2016;352:i1981. doi:10.1136/bmj.i198127121591
- Lash TL, Fox MP, MacLehose RF, Maldonado G, McCandless LC, Greenland S. Good practices for quantitative bias analysis. Int J Epidemiol. 2014;43(6):1969–1985. doi:10.1093/ije/dyu14925080530
- White E, Hunt JR, Casso D. Exposure measurement in cohort studies: the challenges of prospective data collection. Epidemiol Rev. 1998;20(1):43–56. doi:10.1093/oxfordjournals.epirev.a0179719762508
- Momoli F, Siemiatycki J, McBride ML, et al. Probabilistic multiple-bias modeling applied to the Canadian data from the interphone study of mobile phone use and risk of glioma, meningioma, acoustic neuroma, and parotid gland tumors. Am J Epidemiol. 2017;186(7):885–893. doi:10.1093/aje/kwx15728535174
- Bodnar LM, Siega‐Riz AM, Simhan HN, Diesel JC, Abrams B. The impact of exposure misclassification on associations between prepregnancy BMI and adverse pregnancy outcomes. Obesity. 2010;18(11):2184–2190. doi:10.1038/oby.2010.2520168307
- Bodnar LM, Himes KP, Abrams B, et al. Gestational weight gain and adverse birth outcomes in twin pregnancies. Obstet Gynecol. 2019;134(5):1075–1086. doi:10.1097/AOG.000000000000350431599828
- De Silva DA, Thoma ME. The association between interpregnancy interval and severe maternal morbidities using revised national birth certificate data: A probabilistic bias analysis. Paediatr Perinat Epidemiol. 2019;00:1–12.
- Tordoff D, Andrasik M, Hajat A. Misclassification of sex assigned at birth in the behavi9oral risk factor surveillance system and transgender reproductive health: a quantitative bias analysis. Epidemiology. 2019;30(5):669–678. doi:10.1097/EDE.000000000000104631162292
- Vlaar T, Elbaz A, Moisan F. Is the incidence of motor neuron disease higher in French military personnel? Amyotroph Lat Scl Fr. 2019;21:1–9.
- Parkin DM, Boyd L, Walker LC. 16. The fraction of cancer attributable to lifestyle and environmental factors in the UK in 2010. Br J Cancer. 2011;105(Suppl 2):S77–S81. doi:10.1038/bjc.2011.48922158327
- Northridge ME. Public health methods–attributable risk as a link between causality and public health action. Am J Public Health. 1995;85(9):1202–1204. doi:10.2105/AJPH.85.9.12027661224
- van Gemert WA, Lanting CI, Goldbohm RA, et al. The proportion of postmenopausal breast cancer cases in the Netherlands attributable to lifestyle-related risk factors. Breast Cancer Res Treat.2015;152(1):155–162. doi:10.1007/s10549-015-3447-726044369
- Neutel CI, Morrison H. Could recent decreases in breast cancer incidence really be due to lower HRT use? Trends in attributable risk for modifiable breast cancer risk factors in canadian women. Can J Public Health. 2010;101(5):405–409. doi:10.1007/BF0340486221214057
- Mansournia MA, Danaei G, Forouzanfar MH, et al. Effect of physical activity on functional performance and knee pain in patients with osteoarthritis: analysis with marginal structural models. Epidemiology. 2012;23(4):631–640. doi:10.1097/EDE.0b013e31824cc1c322415107
- Nikfarjam A, Hajimaghsoudi S, Rastegari A, et al. The frequency of alcohol use in Iranian urban population: the results of a national network scale up survey. Int J Health Policy Manag. 2017;6(2):97. doi:10.15171/ijhpm.2016.10328812784
- Eftekhar AM, Salehi M, Gharaei B, et al. A household study on the prevalence of substance misuse in tehran: the need for other methods to estimate the prevalence. Iran J Psychiatry. 2006;1(4):158–161.
- VanderWeele TJ, Ding P. Sensitivity analysis in observational research: introducing the E-value. Ann Intern Med. 2017;167(4):268–274. doi:10.7326/M16-260728693043