
Abstract
Purpose
Medulloblastoma (MB), the most common malignant brain tumor in children, is divided into four tumor subgroups: wingless-type (WNT), sonic hedgehog (SHH), Group 3, and Group 4. Ideally, clinical practice and treatment design should be subgroup specific. While WNT and SHH subgroups have well-defined biomarkers, distinguishing Group 3 from Group 4 is not straightforward. MicroRNAs (miRNAs), which regulate posttranscriptional gene expression, are involved in MB tumorigenesis. However, the miRNA–messenger RNA (mRNA) regulatory network in MB is far from being fully understood. Our aims were to investigate miRNA expression regulation in MB subgroups, to assess miRNA target relationships, and to identify miRNAs that can distinguish Group 3 from Group 4.
Patients and methods
With these aims, integrated transcriptome mRNA and miRNA expression analysis was performed on primary tumor samples collected from 18 children with MB, using miRNA sequencing (miRNA-seq), RNA sequencing (RNA-seq), and quantitative PCR.
Results
Of all the expressed miRNAs, 19 appeared to be significantly differentially expressed (DE) between Group 4 and non-Group 4 subgroups (false discovery rate [FDR] <0.05), including 10 miRNAs, which, for the first time, are reported to be in conjunction with MB. RNA-seq analysis identified 165 genes that were DE between Group 4 and the other subgroups (FDR <0.05), among which seven are predicted targets of five DE miRNAs and exhibit inverse expression pattern.
Conclusion
This study identified miRNA molecules that may be involved in Group 4 etiology, in general, and can distinguish between Group 3 and Group 4, in particular. In addition, understanding the involvement of miRNAs and their targets in MB may improve diagnosis and advance the development of targeted treatment for MB.
Introduction
Medulloblastoma (MB), a highly malignant tumor of the cerebellum, is the most common malignant brain cancer in children.Citation1 Current MB therapy includes surgical resection, craniospinal irradiation, chemotherapy, and bone marrow transplantation in high-risk patients, which yields 5-year survival rates of 60%–70%.Citation2 Despite advances in treatment and attempts at early detection of metastatic cells,Citation3 the incidence rate of tumor recurrence in MB patients is about 40%, and 30% die from the disease.Citation4
MB is highly heterogenic, comprising four tumor subgroups with distinct clinical, biological, and genetic profiles (reviewed in a study by Gupta et al).Citation5 These include the wingless-type (WNT) class (Group 1), with activated Wingless pathway signaling;Citation6 sonic hedgehog (SHH)-activated–TP53 wild-type and SHH-activated–TP53 mutant (Group 2), represented by Hedgehog pathway activation;Citation7 Group 3, with enhanced photoreceptor and GABAergic pathway signaling; and Group 4, reflected by the upregulation of neuronal and glutamatergic signaling.Citation8 More details on the genetic and molecular signature of each subgroup can be found in a study by Ramaswamy and Taylor.Citation9 Briefly, WNT tumors exhibit somatic mutations of β-catenin (CTNNB1) and monosomy 6. Mutations in PTCH1 or SUFU are frequent in infant SHH tumors, while children (3–16 years) have somatic mutations in PTCH1 or germline and/or somatic TP53 mutations. Approximately 30% of childhood SHH tumors presents TP53 mutations and has a poor prognosis. SHH tumors in adults have a higher mutational load (somatic mutations in SMO, PTCH1, TERT promoter). Amplification of MYC and copy number gains and losses on chromosomes 1, 9 and arm-level copy number variations on chromosome 17q are common cytogenetic aberrations in Group 3. In Group 4, somatic nucleotide variants are less frequent and are hence considered to be copy number-driven tumors. In 10% of Group 4 tumors, inactivating mutations of the histone demethylase KDM6A occur. Tandem duplications of SNCAIP are identified and are mutual to amplifications of CDK6 and MYCN. As opposed to the SHH subgroup, in Group 4, MYCN amplifications do not indicate a poor prognosis. The most common cytogenetic aberration, identified in almost 80% of Group 4 tumors, is isochromosome 17q, with less frequent aberrations in 8p, 7q, 11p, and 18q.
Recently, by using genome-wide DNA methylation and gene expression data, Cavalli et al suggested that each of the four subgroups can be divided to even more subtypes.Citation10 Although distinct signaling pathways are involved in the etiology of each subgroup, the histological presentation and treatment are quite similar, resulting in different clinical outcomes. Overall, genetic characterization of the tumor is essential for appropriate clinical decision-making.Citation8,Citation11 While the SHH and WNT subgroups have well-defined and specific biomarkers, the diagnosis of Group 3 and Group 4 is more challenging; hence, it is of high priority to detect novel genes or microR-NAs (miRNAs) that distinguish between these two subgroups.
miRNAs are small noncoding RNAs of 20–27 nucleotides in length, which regulate gene expression by binding to cognate sequences, located preferentially at the 3′ untranslated regions of protein-coding messenger RNAs (mRNAs). miRNAs are processed from primary transcripts to generate the mature-length molecule (reviewed in studies by Herrera-Carrillo and Berkhout and Daugaard and Hansen).Citation12,Citation13 Briefly, canonical miRNAs are transcribed in the nucleus as primary miRNAs, which are then processed by the microprocessor complex Drosha–DGCR8 to generate the ~70 nucleotide precursor hairpin.Citation14 The pre-miRNA is exported to the cytoplasm,Citation15 where it is cleaved by the RNase III-like enzyme Dicer, in a complex with the cofactors TRBP and PACT, to generate the mature-length miRNA duplex.Citation16,Citation17 miRNA duplexes are loaded into the RNA-induced silencing complex (RISC) through interaction with Argonaute proteins.Citation18 The mature form of the active miRNA strand directs the RISC complex to mRNAs while the passenger strand is degraded. miRNAs play a key role in various cellular processes, such as development, differentiation, and metabolism (reviewed in a study by Jansson and Lund).Citation19 Alterations in the miRNA–mRNA interaction have been linked to a number of clinical conditions, including neurological disorders.Citation20 In addition, miRNAs have been shown to be involved in different aspects of cancer development, including cancer initiation, progression, tumor growth, and metastasis (reviewed by Lin and Gregory),Citation21 suggesting the use of miRNAs in diagnosis and cancer treatment. miRNAs can function as oncomiRsCitation22 or tumor suppressors,Citation23 and their unique expression profiles have been demonstrated for different types of cancers, including brain tumors.Citation24 So far, miRNA studies in MB have raised a series of potential candidates,Citation25–Citation27 where some were found to have unique roles in specific MB subgroups. For instance, the oncogenic miR-17/92 cluster was shown to cooperate with activated SHH signaling both in vitro and in vivo, increasing cellular proliferation and tumorigenic capacity in appropriate model systems of MB.Citation25,Citation26 More recently, it was found that SHH MB cells display reduced tumor growth when silencing miR-17/20 and miR-19a/b in vitro and in vivo.Citation28 Two complementary studies have shown that the miR-183-96-182 cluster is highly upregulated in subgroup 3.Citation27,Citation29 In addition, miR-193a, miR-224/miR-452 cluster, and miR-148a, which are found to be upregulated in the WNT pathway MB, were suggested to have antitumor or metastasis-suppressive activity.Citation30
Despite these studies, to the best of our knowledge, no high-throughput unbiased sequencing research has been done to reveal miRNA–mRNA interactions in MB subgroups. Here, we applied high-throughput sequencing on tissues from different subgroups of MB to generate global miRNA and mRNA expression profiles from the same individuals. Using this unbiased approach, we identified novel miR-NAs whose expression can distinguish Group 4 from the Group 3 subgroups and several miRNA–mRNA regulatory networks controlling various key pathways relevant to MB development.
Patients and methods
Patient cohort, tissue source, and tumor collection
The study design adheres to the tenets of the Declaration of Helsinki and was approved by the Schneider Children’s Medical Center of Israel and the National Review Board of the Israel Ministry of Health. All samples in this study were obtained, under institutional review board approval, from pediatric patients at the Schneider Children’s Medical Center of Israel; written informed consent was obtained from all patients and their parents. Tumor samples were collected from patients during surgery for their primary tumor. For histological characterization, specimens were placed in formalin, cut, and stained according to standard techniques, followed by a consultant neuropathologist analysis. For RNA extraction, tumor tissue was placed in RNAlater™ (AM7020; Thermo Fisher Scientific, Waltham, MA, USA) and stored at −80°C. The study cohort consists of 18 pediatric patients diagnosed with MB (Table S1), 7 boys and 11 girls; mean age at diagnosis 5.9±3.3 years. At the time of this study, all patients were monitored at the Pediatric Oncology Unit. Of the 18 children, 14 were diagnosed with localized disease and four were diagnosed as metastatic. All patients were treated by chemotherapy; 15 patients received radiation in addition to chemotherapy; three did not receive radiation therapy due to their young age (<3 years); and nine underwent bone marrow transplantation. Recurrence of the disease occurred in three children, of whom two died.
RNA extraction
Total RNA was extracted from fresh frozen tumor tissues samples using Trizol reagent (TRI Reagent, 93289; Sigma-Aldrich Co, St Louis, MO, USA) for cell lysis. Homogenization of the tissues was done using a needle (18 G×1½″, 1.2×40 mm, 4710012040 HSW FINE-JECT®; Henke-Sass Wolf, Tuttlingen, Germany) and a 3-mL syringe (5020.000V0 HSW SOFT-JECT®; Henke-Sass Wolf). Phase separation was done using chloroform (chloroform [stab/Amylene] AR-b, 030805; Bio-Lab Ltd, Jerusalem, Israel). RNA precipitation was performed overnight with isopropanol (2-propanol AR-b, 162605; Bio-Lab Ltd) and washed with 70% ethanol (ethanol absolute [dehydrated] CP, 052502; Bio-Lab Ltd). The RNA was dissolved in diethylpyrocarbonate-treated water (AM9922; Thermo Fisher Scientific). Quantification of the amount and quality of RNA was performed using the NanoDrop 1000 spectrophotometer (ND-1000 UV/Vis; Thermo Fisher Scientific).
RNA and miRNA sequencing (RNA-seq and miRNA-seq)
Total RNA library preparation and sequencing were performed at the core genomic facility of the Sheba Medical Center, Ramat Gan, Israel. Library preparation was performed following the Illumina (San Diego, CA, USA) recommendations. The quality and sizes of the products were checked using an Agilent DNA 1000 kit of the Bioanalyzer 2100 (Agilent Technologies, Santa Clara, CA, USA) and each library had an insert size of ~200 base pairs. Cluster generation and single-end sequencing were carried out using the standard Illumina procedures for the HiSeq 2500 sequencer (Illumina). Raw data were deposited at the sequence read archive accession number SRP095882.
RNA-seq data analysis
Following quality control with FastQC,Citation31 reads were processed to trim adaptors and low-quality bases were eliminated using Trim galore software, version 0.4.1 (http://www.bioinformat-ics.babraham.ac.uk/projects/trim_galore/). Trimmed reads were aligned to the human genome (hg38) by the TopHatCitation32 program, version 2.1.1. The number of reads overlapping each of the annotated genes was counted using the HTSeq-count script from the HTSeqCitation33 python package, version 0.6.1p1, using the “union” overlap resolution mode. The count table was filtered to contain only mRNAs having at least one count per million (CPM) in at least a single sample. Expression counts were normalized to library size following trimmed mean of M values normalization using the edgeRCitation34 package, version 3.16.5. Voom transformation and differential expression analysis were performed using linear modeling, implemented at the limmaCitation35 package, version 3.30.13, in R version 3.3.2. Since replicates for the SHH and WNT groups were not available to us at the time of conducting this experiment, the dispersion estimation was done based on information from Group 3 and Group 4. p-values were corrected for multiple testing using the Benjamini and Hochberg approach, and genes having adjusted p-values <0.05 were referred to as being differentially expressed (DE). For visualization of the subgroup classification, heat-maps were generated using heatmap.2 from gplots,Citation36 version 3.0.1R package, by using unsupervised hierarchical clustering (complete linkage) and 1-correlation as the distance method.
miRNA data analysis
Raw reads were processed to trim adaptors and low-quality bases using Trim galore, version 0.4.1. Reads shorter than 15 nucleotides were discarded. The miRExpressCitation37 tool was used to map reads to precursor miRNAs from miRBase, version 21, and to generate miRNA expression profiles. Expression was computed by summing counts of reads that fell within the location of the mature miRNA in the precursor sequence plus a tolerance range of four nucleotides. Count filtering, normalization, and differential expression were carried out in a manner similar to RNA-seq analysis, as described earlier. Unless otherwise specified, an adjusted p-value cutoff of 0.05 was used for significance detection. Identical mature miRNAs originating from different precursors were counted as the same type of molecule in all downstream analyses. Due to the small number of samples in our analysis, miRNA was defined as expressed if at least one of the following conditions was met: 1) it had at least one CPM read in WNT or SHH samples; 2) it had at least one CPM read in at least one sample belonging to Group 3; or 3) it had at least one CPM read in at least three Group 4 samples. For visualization of DE miRNA, heat-maps were generated using iheatmaprCitation38 R package, version 0.2.4, by using the Euclidean as the distance method and complete linkage for clustering. To assess the uncertainty in the hierarchical clustering, p-values were calculated via multiscale bootstrap resampling analysis using pvclustCitation39 R package, version 2.0–0. The package pvclust gives two types of p-values: bootstrap probability and approximately unbiased. For the visualization of DE miRNAs, heat-maps were generated using iheatmaprCitation38 R package, version 0.2.4, by using an unsupervised hierarchical clustering (complete linkage) and Euclidean as the distance method.
Ingenuity pathway analysis (IPA)
Normalized and filtered miRNA as well as mRNA data were uploaded to Qiagen’s IPA® (Qiagen, Redwood City, CA, USA; www.qiagen.com/ingenuity) software, version 01–04. IPA was used to gain insight into the overall biological changes introduced by expression, miRNA target gene prediction, and miRNA and mRNA integrated analysis. Using the Ingenuity Pathways Knowledge Base, each gene was linked to specific functions, pathways, and diseases. For miRNA–mRNA integration analysis, IPA miRNA target filter was used; only experimentally validated and “highly predicted” mRNA targets were included in the analysis. By applying an expression pairing tool, we focused on miRNAs and their target genes with opposite expression.
Public data sets of gene expression
Publicly available, quality-controlled robust multi-array average normalized mRNA expression matrix, generated using microarray (Affymetrix HG 1.1 ST; Affymetrix, Santa Clara, CA, USA) and was downloaded from the Gene Expression Omnibus database (GSE37385).Citation40 The data set GSE37385 contains 285 subjects diagnosed with MB, covering SHH, Group 3, and Group 4 subgroups. Detection of genes DE between Group 4 and non-Group 4 in GSE37385 data set was done similar to the RNA-seq analysis described earlier. For visualization, heat-maps were generated using iheatmaprCitation38 R package, version 0.2.4, by using unsupervised hierarchical clustering (complete linkage) and Euclidean as the distance method.
Reverse transcription (RT) and quantitative PCR (qPCR)
Isolated RNA (2 μg) was reverse transcribed with random primers using High Capacity cDNA RT kit + RNAse inhibitor (4374967; Thermo Fisher Scientific) according to the manufacturer’s instructions. The qPCR assay was done using the Fast SYBR® Green Master Mix (4385612; Thermo Fisher Scientific). For miRNA expression validation analysis, total RNA was extracted from 16 fresh frozen tumor tissues (Table S1). For the validation of miRNAs, 0.5 μg of isolated RNA was used for the qScript™ miRNA cDNA Synthesis kit (95107; Quanta Biosciences, Gaithersburg, MD, USA), including poly(A) tailing reaction, RT and SYBR Green qRT-PCR amplification. The detection of expression levels was performed using the StepOnePlus™ System (Thermo Fisher Scientific). Primer sequences are listed in Tables S2 and S3.
Real-time qPCR expression level analysis
The patient subgroup was defined according to the gene signature of Kunder et alCitation41 (Table S4) and their primers were used (except for MYCN, which lead to nonspecific results).
The expression level of each protein-coding gene/miRNA was normalized to GAPDH/SNORD48 expression, respectively, as determined by the delta cycle threshold (Ct) method, where ΔCt = (CtGene−CtRef). For the visualization of DE genes, heat-maps were generated using heatmap.2 from gplots,Citation36 version 3.0.1R package, by using unsupervised hierarchical clustering (complete linkage) and 1-correlation as the distance method. miRNA expression data analysis and visualization were performed using the ddCtCitation42 R package, version 1.26.0. Since we did not have a normal cerebellum sample, we calculated the median Ct of all samples for each miRNA; this median was used as the calibrator for the ddCt package analysis. To determine a significant difference between Group 3 and Group 4, we performed a two-tail t-test, assuming equal variances. For the WNT and SHH subgroups, no test was performed due to the small number of samples.
Results
Expression profiling of mRNA
Primary tumor samples were obtained from 18 children diagnosed with MB. qPCR analysis was performed to classify the MB into one of the four subgroups based on Kunder et al.Citation41 Of the 18 samples, two samples fitted with the WNT subgroup, two belonged to subgroup SHH, seven patients were classified as subgroup 3, and seven others as subgroup 4 (Figure S1). The distribution of MB subtypes according to the children’s age, gender, and histology type (classic or desmoplastic; none were large cell anaplastic) is shown in , respectively. shows representative histological images of the classic and desmoplastic MB types. Out of the 18 tumors, nine (one from the WNT subgroup, one from the SHH subgroup, two from subgroup 3, and five from subgroup 4) () were subjected to whole-transcriptome RNA-seq (). Since the additional nine samples were collected at a later stage of the study, they were included only in the RT-qPCR validation step.
Figure 1 (A) Demographic distribution of the subgroups in the present cohort. Subgroup distribution with respect to the (B) age at diagnosis, (C) gender, (D) histological variants. Number of tumors is noted in each category. Histological images of the medulloblastoma types: (E) classic (patient no 13, Table S1) and (F) desmoplastic (patient no 2, Table S1). Magnification: 10×.
Abbreviations: SHH, sonic hedgehog; WNT, wingless-type.
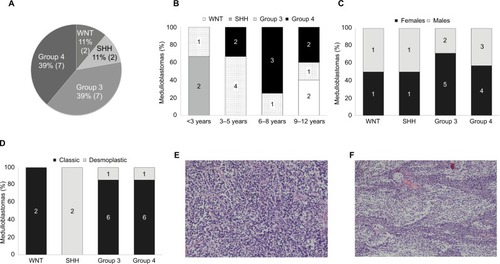
Figure 2 Heat-map showing differential expression of protein-coding genes in the nine tumor tissues, according to (A) qPCR analysis (−ΔCT) and (B) RNA-seq analysis (log CPM). Graphically displayed results of unsupervised hierarchical clustering. (C) Hierarchical clustering of the genes across the different subgroups using ANOVA (FDR <0.05). Patient symbols are detailed in Table S1. (D) Expression heat-map of the differently expressed genes between Group 4 and other MB subgroups (FDR <0.05). The values were taken from the public data set GSE37385 (Group 3=46, Group 4=188).
Abbreviations: qPCR, quantitative PCR; MB, medulloblastoma; RNA-seq, RNA sequencing; CPM, counts per million; ANOVA, analysis of variance; FDR, false discovery rate; SHH, sonic hedgehog; WNT, wingless-type.
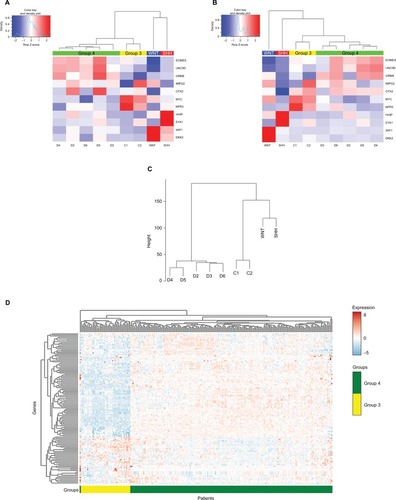
The number of sequenced reads ranged from 35 to 50 million per sample. The overall read mapping rate was 96.37%–97.72% (Table S5). In total, 14,095–15,718 expressed genes (CPM >2) were found in each MB subgroup, with 12,391 genes that were common to all subgroups. Group 3 displayed the highest number of uniquely expressed genes (Figure S2A). An unsupervised hierarchical clustering based on expressed mRNAs revealed a clear separation from Group 4, which clustered separately from the other MB tissues (data not shown). Linear model analysis identified 500 DE genes between the four subgroups (false discovery rate [FDR] <0.05). Hierarchical clustering using these genes segregates the tumor tissues into the different subgroup clusters (). Due to the low number of replicates available for SHH, WNT, and Group 3, we defined a statistical model to compare subgroup 4 against the other three subgroups. This test revealed 165 DE genes (Table S6) – 87 upregulated and 78 downregulated. The expression of these DE genes was visualized across the 234 tumor tissues found in the GSE37385Citation40 data set (Group 3=46, Group 4=188) (). As can be seen in , these genes can distinguish between Group 3 and Group 4 in the large and independent GSE37385 cohort, emphasizing the ability of our analysis to correctly detect differences in gene expression despite the small size of the cohort in our study.
Gene ontology and pathway analysis of the DE genes in Group 4 tumors revealed downregulation of the WNT signaling pathway. In addition, Group 4 tumors were characterized by an overrepresentation of pathways involved in cancer and neuronal development (Table S7). Top canonical signaling pathways overrepresented in MB Group 4 subgroup, as identified by IPA, are described in .
Table 1 Canonical pathway analysis of genes differentially expressed between Group 4 and the other subgroups of medulloblastoma
Expression profiling of miRNAs was performed on the same nine MB samples that were subjected to RNA-seq to investigate the differences between miRNA expression profiles within MB subgroups. The total number of sequencing reads obtained was in the range of 12–33 million reads per sample. After filtering, sequencing reads with lengths between 15 and 28 nucleotides represented 40%–77% of the total number of reads initially obtained. Around half of the reads mapped to miRNAs precursors (30%–65%), using the Smith–Waterman algorithm implemented in miRExpress.Citation37
There were 867 miRNAs identified in at least a single MB sample; from those, 592 were identified across all samples. These originated from 687 precursors, of which 285 precursors had both the 5p and 3p strands expressed, and 402 miR-NAs were from only one strand (either 5p or 3p), such that there were no evident traces of the other hairpin arm. From the sequencing data, we were able to identify 38 mature miR-NAs that originated from different genomic loci (Table S8). From one mature miRNA (hsa-miR-486), we could identify sequences from both the 5p and 3p strands, derived from two different precursors. These findings provide evidence that both loci of this miRNA would be expressed in MB tumors.
Out of the 867 identified mature miRNAs, 783 were defined as expressed (see “Materials and methods” section) in MB. Of these, 462 were common to all four subgroups (Figure S2B). Of all expressed miRNAs, 19 (2.4%) appeared to be significantly DE between Group 4 and the other studied MB subgroups (FDR <0.05). Hierarchical clustering using these miRNAs segregates tumors into clusters similar to those identified by expression profiling of protein-coding genes (). The observed clusters were supported by a multiscale bootstrap resampling analysis (Figure S3).
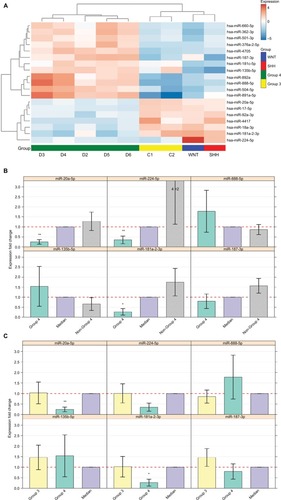
Figure 3 (A) Heat-map showing 19 differentially expressed miRNAs in the nine tumor tissues according to miRNA-seq analysis (FDR <0.05). Patient symbols are keyed to Table S1. Bar chart (with standard deviation error bars) of qPCR expression analysis of miR-135b-5p, miR-181a-2-3p, miR-187-3p, miR-20a-5p, miR-224-5p, and miR-888-5p; in Group 4 (n=5) (B) compared to non-Group 4 (n=11) (C) and compared to Group 3 (n=7). **p-value ≤0.01, *p-value <0.05.
Abbreviations: qPCR, quantitative PCR; miRNA, microRNA; miRNA-seq, microRNA sequencing; FDR, false discovery rate; SHH, sonic hedgehog; WNT, wingless-type.
Out of the 19 DE miRNAs, 10 had no previous indication of having a role in MB in general or in any specific MB subgroup (). Kunder et alCitation41 detected nine miRNAs that could distinguish between the different subgroups; of these, two are found on our list (hsa-miR-135b-5p and hsa-miR-224-5p). Figure S4 presents the hierarchical clustering of our cohort based on the miRNA-seq expression of Kunder’s nine miRs.
Table 2 Differentially expressed miRNAs involved in MB subgroup 4 according to miRNA-seq analysis (FDR <0.05)
A qPCR analysis was performed for a selected set of six miRNAs harboring the highest expression level, which can potentially distinguish between Group 4 and non-Group 4 samples. Three of the selected miRs – hsa-miR-181a-2-3p, hsa-miR-187-3p, and hsa-miR-888-5p – had no previous indication of being involved in MB (). The qPCR expression analysis of these selected potential markers () was carried out for 16 MB samples (Table S1). Three miRs – hsa-miR-20a-5p, miR-181a-2-3p, and hsa-miR-224-5p – exhibited a significant expression difference (p-value =0.0008, 0.003, and 0.03, respectively), making them good candidates to serve as specific Group 4 markers (). Since subgroup merging can bias the expression toward a specific subgroup, we repeated the analysis, but this time observing Group 4 and Group 3 separately (). As can be seen, the tested miRs have a unique expression pattern in Group 4 that is different from Group 3; two miRs – miR-20a-5p and miR-181a-2-3p – were statistically significant (p-value =0.01 and 0.017, respectively) and can be used to distinguish between these two subgroups.
Integrated analysis of miRNA and mRNA expression
To understand the functional significance of regulated miR-NAs in MB, we performed an integrated analysis to identify inverse miRNA–mRNA expression.
Among the significantly DE miRNAs identified in Group 4, five (miR-135b-5p, miR-181a-2-3p, hsa-miR-18a-3p, miR-4417, and hsa-miR-501-3p) were inversely correlated with seven DE validated and predicted target genes (RUNX2, DGKG, GPR12, LHX5, FREM3, GPRIN2, and KCTD9) ( and ).
Table 3 DE miRNAs and their targeted DE genes that exhibit inverse expression in Group 4
Figure 4 (A) Inverse correlation of miRNA and mRNA expression in Group 4. Nodes in red are upregulated and green color shows downregulation. Relationship label keys: E, expression (includes metabolism/synthesis for chemicals); LO, localization; PP, protein–protein binding; miT, microRNA targeting; I, inhibition; L, molecular cleavage (includes degradation for chemicals); PD, protein–DNA binding; RB, regulation of binding; UB, ubiquitination. (B) Expression levels of seven predicted target genes having inverse expressions to the differentially expressed miRNAs in Group 4 compared to SHH or Group 3 (p-value according to t-test analysis). The expression values were taken from the public data set GSE37385 (Group 4=188, Group 3=46, SHH=51).
Abbreviations: SHH, sonic hedgehog; miRNAs, microRNAs; mRNA, messenger RNA.
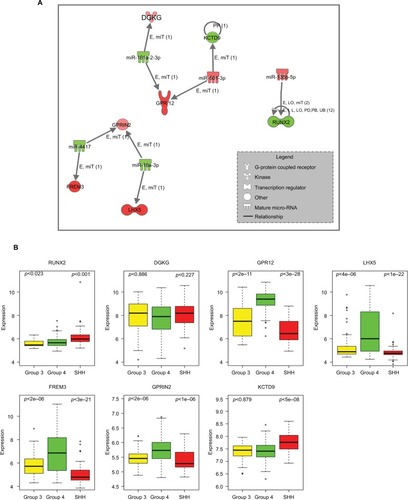
The expression of these targeted genes across the 285 tumor tissues found in the GSE37385Citation40 data set (Group 4=188, Group 3=46, SHH =51) was visualized (). A t-test analysis comparing Group 4 and Group 3 tumors resulted in five genes with significant differential expression (p-value <0.05) – RUNX2, GPR12, LHX5, FREM3, and GPRIN2. As can be seen in , there is an agreement between gene expression in the public data set and those found in our cohort. Predicted upstream and downstream effects of activation or inhibition of the DE miRNAs and their target genes according to the Ingenuity core analysis and molecular activity predictor revealed their involvement in cellular development, cellular growth and proliferation, and connective tissue development and function (Table S9, Figure S5).
Discussion
In recent years, the expression of specific genes has become the standard for MB subtyping. Indeed, recent recommendations of the World Health Organization include the use of personalized genetic markers as an integral part of MB tumor assessment.Citation43 The uses of these genetic markers carry both the diagnostic and the prognostic information of tumors with histologically similar appearance. Different experimental protocols are already employed in clinical trials for the different MB subgroups.
Using integrated analysis of paired miRNA and mRNA expression from MB tumors belonging to different subgroups, we identified novel miRNAs exhibiting a unique expression signature in Group 4. These miRNAs may, in the future, be tested for their capabilities to serve as Group 4 biomarkers to improve diagnosis. In contrast to previous studies, which focused on specific sets of miRNAs that had usually been extracted from formalin-fixed paraffin-embedded (FFPE) tissues (reviewed in a study by Gupta et al),Citation5 we performed an unbiased, genome-wide analysis involving the sequencing of the whole set of miRNA and mRNA molecules extracted from fresh frozen tissues. Although assessing the amount of tumor present in the tissue is imprecise with fresh frozen tissues, frozen samples are preferable to FFPE samples for molecular analysis, such as RNA purification. FFPE preparation methods affect the integrity of molecular data and often contain degraded RNA. The quality of the purified RNA in fresh frozen tissues is significantly higher than in FFPE, allowing an accurate estimation of gene expression.
The classification of our cohort into the different subgroups revealed that the distribution is in agreement with what is known from the literature, with Group 4 and Group 3 being the most common MB subgroups in children.Citation44 Whole-transcriptome expression analysis identified both known and novel genes characterizing the different MB subgroups. Specifically, out of the DE genes in Group 4, we detected an upregulation of SIX6 (Table S6), a homeobox encoding gene that is involved in the development of the retina and is expressed in the adult retina, hypothalamic and pituitary regions.Citation45 SIX1 and SIX2, two homologs of SIX6, are oncogenes and components of the retinal determination gene network, which promotes proliferation, apoptosis, tumor growth, and metastasis.Citation46 A meta-analysis of the SIX family genes in patients with nonsmall-cell lung cancer shows that elevated expressions of SIX6 promote cell proliferation linked to lymph node metastasis and predicts poor overall survival.Citation47 An upregulation of SIX6 and its homologs in Group 4 is consistent with Group 4 being at moderate risk for the dissemination of the disease. Microfibrillar-associated protein 4 (MFAP4), which is involved in cell adhesion or intercellular interactions,Citation48 was downregulated in Group 4 (Table S6). A meta-analysis of multiple solid tumor-based microarray data sets revealed that downregulation of the MFAP4 gene is part of a common metastases gene signature compared with primary tumors.Citation49 Among the MB groups, Group 3 has the highest incidence of metastatic disease, followed by Group 4,Citation7 characterized by dissemination via the cerebrospinal fluid. Hence, in Group 4 patients, the downregulation of MFAP4 may serve as a prognostic factor at the time of diagnosis.
Although the expression of specific genes is currently used in the clinic to classify the different MB subgroups, discriminating between Group 3 and Group 4 MB is still challenging, which has prompted a debate as to whether these are really two separate subgroupsCitation10 or the same entity.Citation50 Moreover, often, the gene signature used in the clinic cannot differentiate Group 3 from Group 4 and the report the clinician receives may include only a “non-WNT/non-SHH” diagnosis. If Group 3 and Group 4 are indeed different subgroups, additional specific biomarkers are required to distinguish between the two. Here, we applied miRNA-seq to identify miRNA molecules having a specific Group 4 expression profile, which could be tested in the future for their prognostic value.
By using miRNA-seq, we identified 19 molecules that exhibit MB subgroup-specific expression corresponding to Group 4, as compared to the other subgroups. Although 10 out of the 19 DE miRNAs had no previous indication of having a role in MB in general or in a specific MB subgroup, some have a role in other types of cancer, and we could correlate their expression to Group 4. For example, compared with the other subgroups, Group 4 possesses lower expression of miR-181a-2-3p, which was reported to be involved in the oncogenesis of glioma and functions as a tumor suppressor.Citation23 In addition, overexpression of miR-187-3p was detected in Group 4. Since low expression of miR-187-3p has been shown to be tumor suppressing in several cancers,Citation51,Citation52 its higher expression may contribute to the poor outcome of patients with Group 4 MB. Another overexpressed miR in Group 4 is has-miR-660-5p, which has been suggested as a prognostic marker in breast cancer.Citation53
To the extent of our knowledge, nine of the 19 DE miR-NAs were already known to alter their expression in MB in general; however, until now, some have not been attributed to the Group 4 subgroup. These include miR-20a-5p, miR-17-5p, miR-18a-3p, and miR-92a-3p of the miR-17-92 cluster, previously described to be upregulated in SHH tumors, as compared to other subgroups of MB.Citation25 These miRNAs were downregulated in Group 4, as compared to all other subgroups – as a whole or separately.
Finally, according to our miRNA-seq analysis, miRNAs that show a significantly different expression in Group 4 compared with non-Group 4 subgroups, such as miR-20a-5p and miR-181a-2-3p, have the potential to serve as markers to distinguish between these subgroups. In summary, our results support Group 4 as an independent MB subgroup.
One limitation of our study is the low number of sequenced samples. This was due to the low availability of samples at the time they were sent for sequencing. To overcome this limitation, our statistical tests compared the subgroup with the highest number of replicates (Group 4) to all other subgroups together. However, the qPCR miRNA validation was done on the higher number of samples collected over time, allowing for anticipated differences between the separate subgroups. In addition, we validated our mRNA expression results on a larger cohort available from the literature.
The qPCR analysis showed the same trend of expression as found in miRNA-seq for five miRNAs (of which three were statistically significant), while one miRNA deviated from the expected expression. This deviation is probably due to the low expression levels of miRNAs, leading to high biological variability in this tumor. Nevertheless, we demonstrated different expression levels of specific miRNAs, which can distinguish between Group 4 and non-Group 4 MB subgroups. Moreover, miR-20a-5p and miR-181a-2-3p have the potential to serve as specific Group 4 biomarkers.
In this study, the same tumor samples were subjected to both whole-transcriptome mRNA and miRNA-seq, which allowed us to detect potential miRNA-gene target regulations involved in MB biology and to suggest potential miRNA targets for treatment. To the best of our knowledge, there are only two other studies that integrated miRNA and mRNA expression analysis from the same MB tumors.Citation54 Genovesi et alCitation54 used Taqman® fluidic cards with 762 mature miRNAs for expression profiling to compare MB primary tumors to multipotent cerebellar neural stem cells and cell lines. In their analysis, however, the authors did not relate to the defined molecular subgroups. Cho et alCitation55 tested gene expression on 194 samples, of which 98 were also subjected to miRNA expression analysis. They used a bead-based detection system representing 435 miRNAs. Their large cohort allowed them to robustly detect DE miRs, but only from those present on the bead array. Our unbiased sequencing approach – albeit on a much smaller cohort – enabled us to detect novel Group 4-associated miRNAs that were overlooked before. For example, miR-181a-2-3p, which was not included in the miRNA list tested by Cho et al,Citation55 was found to be DE in Group 4 as compared with other subgroups in our analysis.
Our integrated mRNA and miRNA analysis detected inverse expression between miR-135b-5p, which is highly expressed in Group 4, and its downregulated experimentally validated target RUNX2 (). Cells lacking Runx2 escape aging and proliferate faster than osteoblasts expressing Runx2, indicating that Runx2 acts as a growth suppressor.Citation56 Hence, it would be worth testing in future studies whether or not the silencing of miR-135b-5p in Group 4 affects cell proliferation. Another example is miR-18a-3p, which was known to have high expression in the SHH subgroup.Citation25 Here, we show that miR-18a-3p is downregulated in Group 4, as compared to other types. One of the miR-18a-3p upregulated targets is LHX5 (). This gene belongs to the LIM domain (cysteine-rich zinc-binding) protein family, and it was reported to have a regulatory effect in neuronal differentiation and migration during the development of the central nervous system.Citation57 The expression of LIM transcription factors Lhx1 and Lhx5 serves as a marker for Purkinje neurons.Citation58 Purkinje cells provide the signal for the granule cell progenitor, which are thought to give rise to MBCitation59,Citation60 to initiate proliferation by secreting the glycoprotein SHH.Citation61 Since Lhx5 is one of the postmitotic precursors of the Purkinje neuron (between E11 and E14),Citation59 its upregulation may be related to MB development.
Conclusion
Despite the relatively small size of our cohort, our study demonstrates the potential role of miRNA molecules in the classification of MB subgroups. In addition, the regulation of MB-related genes by specific miRNAs suggests these as candidates for molecular-targeted therapy. The recent progress in the delivery of functional miRNA molecules across the blood–brain barrierCitation62 reinforces this concept, making miR-based therapeutics an alternative future strategy for the treatment of this type of cancer. Future studies on larger cohorts will realize the use of miRNA as markers for MB development, prognosis, and treatment.
Acknowledgments
This study was funded by the Zanvyl and Isabelle Krieger Fund, Baltimore, MD (NG-C), the Israel Science Foundation (grant number 1189/12) (NG-C), the Israel Cancer Association (NG-C), and the Levi-Eshkol Fund, Ministry of Science, Technology and Space, Israel (grant number 3-12624), which provided SG’s scholarship. The funding organization had no role in the design or conduct of this research.
Disclosure
The authors report no conflicts of interest in this work.
References
- LouisDNOhgakiHWiestlerODThe 2007 WHO classification of tumours of the central nervous systemActa Neuropathol200711429710917618441
- GajjarAChintagumpalaMAshleyDRisk-adapted craniospinal radiotherapy followed by high-dose chemotherapy and stem-cell rescue in children with newly diagnosed medulloblastoma (St Jude Medulloblastoma-96): long-term results from a prospective, multicentre trialLancet Oncol200671081382017012043
- GershanovSMichowizSToledanoHFluorescence lifetime imaging microscopy, a novel diagnostic tool for metastatic cell detection in the cerebrospinal fluid of children with medulloblastomaSci Rep201771364828623325
- JonesDTWJägerNKoolMDissecting the genomic complexity underlying medulloblastomaNature2012488740910010522832583
- GuptaTShirsatNJalaliRMolecular subgrouping of medulloblastoma: impact upon research and clinical practiceCurr Pediatr Rev201511210611926133181
- CliffordSCLusherMELindseyJCWnt/Wingless pathway activation and chromosome 6 loss characterize a distinct molecular sub-group of medulloblastomas associated with a favorable prognosisCell Cycle20065222666267017172831
- KoolMKorshunovARemkeMMolecular subgroups of medulloblastoma: an international meta-analysis of transcriptome, genetic aberrations, and clinical data of WNT, SHH, Group 3, and Group 4 medulloblastomasActa Neuropathol2012123447348422358457
- TaylorMDNorthcottPAKorshunovAMolecular subgroups of medulloblastoma: the current consensusActa Neuropathol2012123446547222134537
- RamaswamyVTaylorMDMedulloblastoma: from myth to molecularJ Clin Oncol201735212355236328640708
- CavalliFMGRemkeMRampasekLIntertumoral heterogeneity within medulloblastoma subgroupsCancer Cell201731673775428609654
- NorthcottPAKorshunovAPfisterSMTaylorMDThe clinical implications of medulloblastoma subgroupsNat Rev Neurol20128634035122565209
- Herrera-CarrilloEBerkhoutBDicer-independent processing of small RNA duplexes: mechanistic insights and applicationsNucleic Acids Res20174518103691037928977573
- DaugaardIHansenTBBiogenesis and function of ago-associated RNAsTrends Genet201733320821928174021
- LeeYAhnCHanJThe nuclear RNase III Drosha initiates microRNA processingNature2003425695641541914508493
- LundEGüttingerSCaladoADahlbergJEKutayUNuclear export of microRNA precursorsScience20043035654959814631048
- KnightSWBassBLA role for the RNase III enzyme DCR-1 in RNA interference and germ line development in Caenorhabditis elegansScience200129355382269227111486053
- ChendrimadaTPGregoryRIKumaraswamyETRBP recruits the Dicer complex to Ago2 for microRNA processing and gene silencingNature2005436705174074415973356
- HutvagnerGSimardMJArgonaute proteins: key players in RNA silencingNat Rev Mol Cell Biol200891223218073770
- JanssonMDLundAHMicroRNA and cancerMol Oncol20126659061023102669
- LambJThe connectivity map: using gene-expression signatures to connect small molecules, genes, and diseaseScience200631357951929193517008526
- LinSGregoryRIMicroRNA biogenesis pathways in cancerNat Rev Cancer201515632133325998712
- HeLThomsonJMHemannMTA microRNA polycistron as a potential human oncogeneNature2005435704382883315944707
- ShiLChengZZhangJhsa-mir-181a and hsa-mir-181b function as tumor suppressors in human glioma cellsBrain Res2008123618519318710654
- BirksDKBartonVNDonsonAMHandlerMHVibhakarRForemanNKSurvey of microRNA expression in pediatric brain tumorsPediatr Blood Cancer201156221121621157891
- NorthcottPAFernandez-LAHaganJPThe miR-17/92 polycistron is up-regulated in sonic hedgehog-driven medulloblastomas and induced by N-myc in sonic hedgehog-treated cerebellar neural precursorsCancer Res20096983249325519351822
- UzielTKarginovFVXieSThe miR-17~92 cluster collaborates with the Sonic Hedgehog pathway in medulloblastomaProc Natl Acad Sci U S A200910682812281719196975
- WeeraratneSDAmaniVTeiderNPleiotropic effects of miR-183~96~182 converge to regulate cell survival, proliferation and migration in medulloblastomaActa Neuropathol2012123453955222402744
- MurphyBLObadSBihannicLSilencing of the miR-17-92 cluster family inhibits medulloblastoma progressionCancer Res201373237068707824145352
- BaiAHCMildeTRemkeMMicroRNA-182 promotes leptomeningeal spread of non-sonic hedgehog-medulloblastomaActa Neuropathol2012123452953822134538
- GokhaleAKunderRGoelADistinctive microRNA signature of medulloblastomas associated with the WNT signaling pathwayJ Cancer Res Ther20106452152921358093
- AndrewsSBabraham BioinformaticsFastQC. A quality control tool for high throughput sequence data2015 Available from: http://www.bioinformatics.babraham.ac.uk/projects/fastqc/Accessed October 12, 2014
- TrapnellCPachterLSalzbergSLTopHat: discovering splice junctions with RNA-SeqBioinformatics20092591105111119289445
- AndersSPylPTHuberWHTSeq – a Python framework to work with high-throughput sequencing dataBioinformatics201531216616925260700
- RobinsonMDMcCarthyDJSmythGKedgeR: a bioconductor package for differential expression analysis of digital gene expression dataBioinformatics201026113914019910308
- RitchieMEPhipsonBWuDLIMMA powers differential expression analyses for RNA-sequencing and microarray studiesNucleic Acids Res2015437e4725605792
- WarnesGRBolkerBBonebakkerLgplots: Various R Programming Tools for Plotting Data20091 Available from: http://cran.r-project.org/package=gplotsAccessed January 31, 2018
- WangW-CLinF-MChangW-CLinK-YHuangH-DLinN-SmiRExpress: analyzing high-throughput sequencing data for profiling microRNA expressionBMC Bioinformatics200910132819821977
- SchepANKummerfeldSKiheatmapr: interactive complex heatmaps in RJ Open Source Software2017216359
- SuzukiRShimodairaHPvclust: an R package for assessing the uncertainty in hierarchical clusteringBioinformatics200622121540154216595560
- NorthcottPAShihDJHPeacockJSubgroup-specific structural variation across 1,000 medulloblastoma genomesNature20124887409495622832581
- KunderRJalaliRSridharEReal-time PCR assay based on the differential expression of microRNAs and protein-coding genes for molecular classification of formalin-fixed paraffin embedded medulloblastomasNeuro Oncol201315121644165124203893
- ZhangJDBiczokRRuschhaupMThe ddCt algorithm for the analysis of quantitative real-time PCR (qRT-PCR)2015 Available from: http://bioconductor.org/packages/release/bioc/html/ddCt.htmlAccessed January 31, 2018
- LouisDNPerryAReifenbergerGThe 2016 World Health Organization classification of tumors of the central nervous system: a summaryActa Neuropathol2016131680382027157931
- GajjarAJRobinsonGWMedulloblastoma-translating discoveries from the bench to the bedsideNat Rev Clin Oncol2014111271472225348790
- YarizKOSakalarYBJinXA homozygous SIX6 mutation is associated with optic disc anomalies and macular atrophy and reduces retinal ganglion cell differentiationClin Genet201587219219524702266
- LiuYHanNZhouSThe DACH/EYA/SIX gene network and its role in tumor initiation and progressionInt J Cancer201613851067107526096807
- HammermanPSLawrenceMSVoetDComprehensive genomic characterization of squamous cell lung cancersNature2012489741751952522960745
- KasamatsuSHachiyaAFujimuraTEssential role of microfibrillar-associated protein 4 in human cutaneous homeostasis and in its photoprotectionSci Rep2011116422355679
- DavesMHHilsenbeckSGLauCCManT-KMeta-analysis of multiple microarray datasets reveals a common gene signature of metastasis in solid tumorsBMC Med Genomics2011415621736749
- WilliamsonDLindseyJCHicksDThe Transcriptional Landscape of Medulloblastoma: Group 3 and Group 4 Tumours Comprise a Single Clinically Significant Expression ContinuumProceedings of the 17th International Symposium on Pediatric Neuro-Oncology (ISPNO)Liverpool, UK12–15 June 2016OxfordOxford University Press2016
- MulraneLMaddenSFBrennanDJmiR-187 is an independent prognostic factor in breast cancer and confers increased invasive potential in vitroClin Cancer Res201218246702671323060431
- ZhaoJLeiTXuCMicroRNA-187, down-regulated in clear cell renal cell carcinoma and associated with lower survival, inhibits cell growth and migration though targeting B7-H3Biochem Biophys Res Commun2013438243944423916610
- KrishnanPGhoshSWangBNext generation sequencing profiling identifies miR-574-3p and miR-660-5p as potential novel prognostic markers for breast cancerBMC Genomics201516173526416693
- GenovesiLACarterKWGottardoNGGilesKMDallasPBIntegrated analysis of miRNA and mRNA expression in childhood medulloblastoma compared with neural stem cellsPLoS One201169e2393521931624
- ChoYJTsherniakATamayoPIntegrative genomic analysis of medulloblastoma identifies a molecular subgroup that drives poor clinical outcomeJ Clin Oncol201129111424143021098324
- PratapJGalindoMZaidiSKCell growth regulatory role of Runx2 during proliferative expansion of preosteoblastsCancer Res200363175357536214500368
- ZhaoYHermeszEYarolinMCWestphalHGenomic structure, chromosomal localization and expression of the human LIM-homeobox gene LHX5Gene20002601–29510111137295
- MoralesDHattenMEMolecular markers of neuronal progenitors in the embryonic cerebellar anlageJ Neurosci20062647122261223617122047
- RousselMFHattenMECerebellum development and medulloblastomaCurr Top Dev Biol20119423528221295689
- MarinoSMedulloblastoma: developmental mechanisms out of controlTrends Mol Med2005111172215649818
- PolkinghornWRTarbellNJMedulloblastoma: tumorigenesis, current clinical paradigm, and efforts to improve risk stratificationNat Clin Pract Oncol20074529530417464337
- TivnanAMcDonaldKLCurrent progress for the use of miRNAs in glioblastoma treatmentMol Neurobiol201348375776823625340
- BraoudakiMLambrouGIGiannikouKMicrorna expression signatures predict patient progression and disease outcome in pediatric embryonal central nervous system neoplasmsJ Hematol Oncol2014719625551588