
Abstract
Purpose
Collectin subfamily member 10 (COLEC10) encodes for collectin liver 1 (CL-L1), which is highly expressed in normal liver. Nevertheless, the association between COLEC10 and the prognosis of patients with hepatocellular carcinoma (HCC) remains unclear. To address this question, the prognostic value of COLEC10 expression in HCC was explored in this study.
Patients and methods
Data from The Cancer Genome Atlas were used to compared transcriptional levels of COLEC10 in HCC samples and samples from healthy controls. In addition, COLEC10 mRNA and protein expression levels were analyzed in HCC tissue samples from Chinese patients and matched adjacent nontumorous tissue samples, by quantitative reverse-transcription polymerase chain reaction and immunohistochemistry, respectively. The prognostic value of COLEC10 was further examined using the Gene Expression Profiling Interactive Analysis online tool.
Results
Both the mRNA and protein levels of COLEC10 were found to be downregulated in HCC tissues compared with normal controls. Survival analysis indicated that decreased mRNA and protein levels of COLEC10 were related with shorter overall survival in patients with HCC. In addition, univariate and multivariate analysis demonstrated that COLEC10 is an independent prognostic factor for overall survival of HCC patients.
Conclusion
Together, the results suggest that decreased expression of COLEC10 may predict poor overall survival in patients with HCC.
Introduction
There were around 782,500 newly diagnosed liver cancer cases and 745,500 deaths from this disease globally during 2012, with the astonishing fact that half of the new cases and deaths occurred in China.Citation1 Hepatocellular carcinoma (HCC), the most common pathological type of liver cancer, has high rates of recurrence and metastasis.Citation2 Therefore, effective methods for the early detection and prognosis of HCC are important. Biological markers for HCC are not yet sufficiently effective in the areas of screening, early diagnosis, and therapeutic evaluation. There is therefore an urgent need to identify and establish new biomarkers for HCC.
Collectin subfamily member 10 (COLEC10) encodes for collectin liver 1 (CL-L1), which belongs to the C-lectin family. The lectins participate in complement activation by neutralizing or agglutinating the microorganisms.Citation3 Like most C-lectins, CL-L1 possesses classic collagen-like domains and carbohydrate recognition sequences. However, CL-L1 is distinguished from other family members by its unique chromosomal and subcellular localization. COLEC10 is found on chromosome 8q, rather than chromosome 10q, where most human collectins are located.Citation3,Citation4 Moreover, previous studies have shown that CL-L1 is localized in the cytoplasm, whereas most collectins are secreted proteins.Citation3,Citation5 These characteristics indicate that COLEC10 may be a special collectin and function differently from other family members. In 2013, a complex consisting of collectin kidney 1 (CL-11) and CL-L1 was found to bind to mannose-associated serine proteases (MASPs) and promote the complement cascade.Citation6 Subsequent reports revealed that serum levels of CL-L1 were increased during head-down tilted bed rest and acute liver failure.Citation7,Citation8 By contrast, in patients with systemic lupus erythematosus and in critically ill children, serum levels of CL-L1 were lower than in healthy controls.Citation9,Citation10 Recently, mutation of COLEC10 has been found in 3MC syndrome patients, leading to craniofacial dysmorphism in children,Citation11 indicating that CL-L1 may have functions beyond stimulating complement cascade.
In this study, we characterized the expression of COLEC10 in HCC by analyzing the data from the Gene Expression Profiling Interactive Analysis (GEPIA) database and via immunohistochemistry (IHC). Further, we evaluated the prognostic function of COLEC10 in HCC patients. The results showed that COLEC10 may be a promising biomarker for the prognosis in HCC.
Methods
The Cancer Genome Atlas profiling data sets
The GEPIA online tool (http://gepia.cancer-pku.cn/detail.php?gene=&clicktag=survival#iframe) was used to produce a box plot of COLEC10 transcriptional expression. The gene name was set as “COLEC10,” and “liver hepatocellular carcinoma (LIHC)” datasets was then selected. The P-value cut-off was set as 0.01. The result was normalized and log2-scaled using GEPIA’s online analysis tool.
In addition, HCC data sets from 434 patients in The GEPIA database (http://cancergenome.nih.gov) were used to explore the relationship between COLEC10 expression and survival time in HCC patients. Kaplan–Meier survival plots were obtained using the GEPIA online tool.
Patients and tissues
Eighty four pairs of HCC tumor samples and nontumor samples were collected at Sun Yat-Sen University Cancer Center, People’s Republic of China, from 2003 to 2009, for use in quantitative real-time polymerase chain reaction (qRT-PCR) analysis. Also obtained from Sun Yat-Sen University Cancer Center were tissue microarrays containing 136 pairs of formalin-fixed paraffin-embedded HCC samples and nontumor counterparts from adjacent tissues. The tissue microarrays had been constructed as described previously.Citation12 All patients were definitively diagnosed with HCC by 2 independent pathologists, and none of them had received preoperative treatments before surgery. In this study, no patients received preoperative treatments before surgery. Complete clinicopathologic data and follow-up information were gathered from the medical records of every patient.
Ethics statement
The research was approved by the institutional review board of Sun Yat-Sen University Cancer Center, and written informed consent was obtained from each patient involved in the study.
All the procedures performed in this study involving human participants were in accordance with the approved guidelines and the principles expressed in the Helsinki Declaration of 1975, which was revised in 2008.
Cell lines and culture conditions
Eight HCC cell lines (BEL7402, Hep3B, H2P, H2M, PLC8024, QSG7701, QGY7703, and SMMC7721) and 1 immortalized liver cell line (LO2) were cultured in Dulbecco’s Modified Eagle’s Medium with 10% newborn calf serum (Gibco BRL, Grand Island, NY, USA). All cells were incubated at 37°C in a humidified chamber containing 5% CO2.
qRT-PCR
Fresh HCC and adjacent nontumor samples were stored at −80°C after surgery. Total RNA was extracted from the samples using TRIzol reagent (Invitrogen, Carlsbad, CA, USA) and then reverse-transcribed using a rapid RT-PCR Kit (Tiangen, Beijing, People’s Republic of China) according to the manufacturer’s instructions. qRT-PCR was carried out to determine the transcriptional expression of COLEC10 using a SYBR Green PCR Kit (Roche Diagnostics, Risch-Rotkreuz, Switzerland) and Light-Cycler480 384-well PCR system (Roche Diagnostics). β-actin was used as a control. The primers for COLEC10 and β-actin are as follows:
COLEC10 forward primer: 5′-TTGCTCGGCTCAAGACATCTAT-3′
COLEC10 reverse primer: 5′-GAACACCCGAAAGAAGCCAC-3′
β-actin forward primer: 5′-TGGCACCCAGCACAATGAA-3′
β-actin reverse primer: 5′-CTAAGTCATAGTCCGCCTAGAAGCA-3′
Western blot analysis
Western blot was carried out in line with the standard protocol using anti-CL-L1 antibody (1:1,000; Novus, St. Louis, MO, USA), Catalog: H00010584-M01 and anti-β-actin antibody (1:2,000; CST, Danvers, MA, USA, Catalog: #3700).
IHC staining
IHC staining was carried out as described previously.Citation13 The microarray slides were incubated with primary polyclonal antibodies against CL-L1 antibody (1:100; Novus). The avidin–biotin–peroxidase method was used to visualize immunoreactivity and hematoxylin was used as the counterstain. A semiquantitative scoring system was used to score the immunostained slides as described previously.Citation13 Based on receiver operating characteristic curves analyses, the optimum cutoff value for CL-L1 was 6, so a staining score of 6 or less was classified as low expression, and a score of >6 was designated as high expression.
Statistical analysis
Statistical analyses were carried out using SPSS version 16.0 (SPSS Inc., Chicago, IL, USA). Paired Student’s t-test was used in comparisons of COLEC10 mRNA levels between HCC tissue samples and their paired nontumor counterparts. The χ2 test or Fisher’s exact test was used to evaluate correlations between CL-L1 expression and clinicopathological parameters. Differences were considered significant when the P-value was <0.05.
Results
COLEC10 expression was lower in HCC
The transcription levels of COLEC10 in 369 HCC tissues and 160 normal liver samples were analyzed using the GEPIA database and its online analysis tool. The box plot indicated that COLEC10 was significantly downregulated in HCC compared to normal controls (P<0.01, ). To validate this result, qRT-PCR was conducted to measure the COLEC10 mRNA levels in 84 HCC samples and paired nontumor counterparts. Downregulation of COLEC10 was detected in 60/84 (71.4%) of HCC tissue samples when compared with their matched nontumor tissues (defined as a twofold decrease). The average transcriptional expression of COLEC10 in HCC was significantly lower compared with that in the nontumor tissue (2.29 versus 0.63, respectively, P<0.0001, paired Student’s t-test; ). The protein levels of CL-L1 were investigated using Western blot analysis in 8 HCC cell lines and 1 immortalized liver cell line (LO2). CL-L1 was detected in small amounts in the Huh7 and QSG7701 cell lines and was barely detected in the other HCC cell lines, whereas it was detected strongly in the LO2 cell line ().
Figure 1 COLEC10 was downregulated in patients with HCC.
Notes: (A) Comparison of COLEC10 expression in 369 HCC tissue samples with that of 160 normal living tissues using the GEPIA database. *P<0.05. (B) Dot plots of COLEC10 mRNA expression in HCC and matched adjacent nontumor specimens from 84 cases. β-actin was used as an endogenous control. P<0.0001, paired t-test. (C) CL-L1 protein expression in 9 HCC cell lines and 1 immortalized liver cell line (LO2). β-actin was used as an endogenous control. (D) Representative images of CL-L1 IHC staining in HCC and normal liver tissues.
Abbreviations: COLEC10, collectin subfamily member 10; GEPIA, Gene Expression Profiling Interactive Analysis; HCC, hepatocellular carcinoma; IHC, immunonhistochemistry.
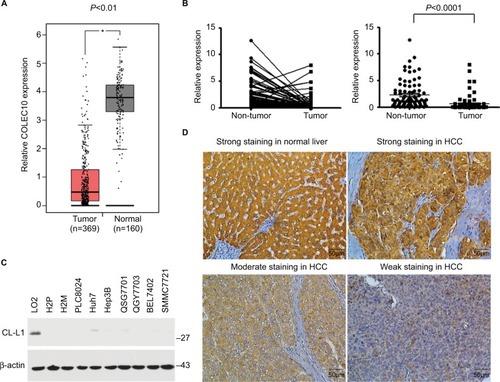
Tissue microarrays containing 136 pairs of HCC tissue samples and nontumor tissue sample counterparts were examined for CL-L1 expression by IHC. The protein was observed to be localized in the cytoplasm of normal liver cells and HCC cells (). Compared with normal liver tissue, HCC tissue showed weaker staining for CL-L1 by varying degrees (). Lower CL-L1 expression was detected in 97 of 136 (71.3%) HCC tissue samples compared with the matched nontumor tissue samples.
Correlations between CL-L1 expression and clinicopathological features
IHC staining was carried out to explore the potential prognostic value of CL-L1 expression in HCC. One hundred thirty-six immunostained HCC tissue samples were classified into 2 groups: high expression (score >6, n=56) and low expression (score ≤6, n=80). shows the correlations between CL-L1 expression and clinicopathological parameters. As shown in , this study consisted of 56 patients aged <50 years and 80 patients aged ≥50 years (P=0.113). Decreased CL-L1 expression was significantly associated with vascular invasion (P=0.013) and surrounding invasion (P=0.003). These results indicate that there may be a negative correlation between CL-L1 expression and HCC progression.
Table 1 Association of CL-L1 expression with clinicopathological features in HCCs
Prognostic value of COLEC10 in HCC
Kaplan–Meier analysis indicated that decreased CL-L1 expression was clearly correlated with poorer survival outcomes (log-rank test, P=0.006, ). The 3, 5, and 8-year survival rates in the low-expression group were 41.3%, 7.5%, and 0%, respectively, compared with 62.5%, 37.5%, and 1.7%, respectively, in the high-expression group (log-rank test, P<0.001). Univariate analysis showed that hepatitis B virus surface antigen (P=0.032), α-fetoprotein (P=0.008), tumor number (P=0.001), vascular invasion (P<0.001) and decreased COLEC10 expression (P=0.007) were significant predictors of overall survival in HCC (). Multivariate analysis indicated that tumor number (P=0.037), vascular invasion (P<0.001), and decreased COLEC10 expression (P=0.001) were independent predictive factors for poor outcomes in HCC patients ().
Table 2 Univariate and multivariate analysis
Figure 2 (A) Kaplan–Meier analysis of the relationship between overall survival and CL-L1 expression, (B) the prognostic effect of the COLEC10 mRNA level in HCC from GEPIA database.
Notes: n(high): Samples with expression level higher than the median of TPM (transcripts of per million) are considered as the high-expression cohort. n(low): Samples with expression level lower than the median of TPM are considered the low-expression cohort.
Abbreviations: COLEC10, collectin subfamily member 10; GEPIA, Gene Expression Profiling Interactive Analysis; HCC, hepatocellular carcinoma; HR, hazard ratio; TPM, transcripts per million.
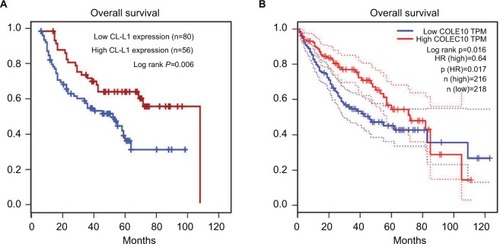
The prognostic role of COLEC10 in HCC was then investigated using an online tool (http://gepia.cancer-pku.cn/detail.php). Survival curves were plotted for 434 HCC patients. Patients with high COLEC10 mRNA levels were found to have longer overall survival compared with those with low COLEC10 mRNA levels (P=0.016, hazard ratio =0.64, ).
Discussion and conclusion
Collectins act as sensors for the innate immunity and trigger complement cascade by binding to particular ligands on microorganisms or altered mammalian cells.Citation14 Although most collectins exist as circulating proteins produced by hepatocytes, the product of the COLEC10, CL-L1, has recently been reported as a cytoplasmic protein present in hepatocytes. COLEC10 is located on chromosome 8q rather than on chromosome 10q as with other human collectin genes.Citation15 These findings suggest CL-L1 may exhibit different features and functions from the other collectins.
During the last decade, CL-L1 has been observed to have similarities to collectin 11 (CL-11) in terms of genomic organization and protein structure. First, there is a high degree of similarity between the transcripts of COLEC10 and COLEC11: 6 exons of COLEC11 have similar arrangements to those of COLEC10 and encode similar sequences. Second, CL-L1 and CL-11 both structurally have a N-terminal, a collagenous region, a neck region, and a carbohydrate recognition domain of 125 amino acids.Citation16 Third, mutations in COLEC11 and COLEC10 were successively identified as the causes of 3MC syndrome.Citation17,Citation18 A heteromeric complex formed by CL-L1 and CL-11 has been shown to mediate complement activation by interacting with MASPs. Originally it was believed that CL-11 was a secreted protein, whereas CL-L1 was cytoplasmic.Citation5 In 2013, researchers found CL-L1 was copurified with CL-11 from blood circulation.Citation6 This provided strong evidence that CL-L1 can also be secreted as soluble protein in the plasma. The highest expression of COLEC10 mRNA was observed in hepatocytes.Citation3 In our study, CL-L1 was observed in the cytoplasm but not the extracellular space around normal hepatocytes and HCC cells. In addition, CL-L1 staining was stronger in normal liver tissue compared with HCC samples. The question of whether decreased COLEC10 expression is a driver factor or concomitant phenomenon in the development of HCC remains to be answered.
CL-11 and CL-L1 both take part in the activation of complement system. However, their carbohydrate recognition domain displays different affinities for saccharides: CL-11 tends to bind to L-fucose and D-mannose, whereas CL-L1 interacts with D-fucose, N-acetylglucosamine and sometimes D-galactose.Citation16 This indicates the collectins may participate in response to different infectious diseases.
Polymorphisms in COLEC11 and COLEC10 are related to 3MC syndrome, a developmental disorder characterized by facial deformity, cognitive dysfunction, hearing loss, and vesicorenal abnormity.Citation17,Citation18 COLEC11 was found to be strongly expressed in embryonic murine craniofacial cartilages and to guide neural crest cell movement.Citation19 Similarly, COLEC10 was shown to be expressed in craniofacial tissues during development and to serve as a cellular chemoattractant to regulate cell migration.Citation18 These results imply that CL-L1 has similar functions to CL-11 not only in immune system but also in embryogenesis.
In conclusion, this is the first study to examine the expression of COLEC10 in HCC. Our findings showed that COLEC10 is downregulated in HCC. We also found that the low expression of CL-L1 was significantly associated with vascular invasion and surrounding invasion of HCC patients. COLEC10 was identified as a new potential biomarker, the low expression of which predicts worse outcomes in patients with HCC. Thus, COLEC10 may serve as a novel predictive marker for the prognosis of patients with HCC.
Author contributions
B Zhang performed the qRT-PCR and Western blot analysis and wrote the manuscript; H Wu carried out the analysis of GEPIA database and statics analysis. All authors contributed toward data analysis, drafting and critically revising the paper and agree to be accountable for all aspects of the work.
Disclosure
The authors report no conflicts of interest in this work.
References
- TorreLABrayFSiegelRLFerlayJLortet-TieulentJJemalAGlobal cancer statistics, 2012CA Cancer J Clin20156528710825651787
- ChenWZhengRBaadePDCancer statistics in China, 2015CA Cancer J Clin201666211513226808342
- OhtaniKSuzukiYEdaSMolecular cloning of a novel human collectin from liver (CL-L1)J Biol Chem199927419136811368910224141
- KawaiTSuzukiYEdaSMolecular cloning of mouse collectin liver 1Biosci Biotechnol Biochem200266102134214512450124
- HowardMFarrarCASacksSHStructural and functional diversity of collectins and ficolins and their relationship to diseaseSemin Immunopathol2017401758528894916
- HenriksenMLBrandtJAndrieuJPHeteromeric complexes of native collectin kidney 1 and collectin liver 1 are found in the circulation with MASPs and activate the complement systemJ Immunol2013191126117612724174618
- KelsenJSandahlTDStormLFrings-MeuthenPDahlerupJFThielSChanges in the levels of mannan-binding lectin and ficolins during head-down tilted bed restAviat Space Environ Med20148580581125199121
- LaursenTLSandahlTDStoySUS Acute Liver Failure Study GroupCirculating mannan-binding lectin, M-, L-, H-ficolin and collectin-liver-1 levels in patients with acute liver failureLiver Int201535375676325203057
- TroldborgAThielSJensenLCollectin liver 1 and collectin kidney 1 and other complement-associated pattern recognition molecules in systemic lupus erythematosusClin Exp Immunol2015182213213826154564
- IngelsCVanhorebeekIDereseIThe pattern recognition molecule collectin-L1 in critically ill childrenPediatr Res201680223724327057739
- Bayarri-OlmosRHansenSHenriksenMLGenetic variation of COLEC10 and COLEC11 and association with serum levels of collectin liver 1 (CL-L1) and collectin kidney 1 (CL-K1)PLoS One2015102e011488325710878
- LiJZhangBZQinYRCD68 and interleukin 13, prospective immune markers for esophageal squamous cell carcinoma prognosis predictionOncotarget2016713155251553826771842
- ZhangBLiMHuangPGuanXYZhuYHOverexpression of ubiquitin specific peptidase 14 predicts unfavorable prognosis in esophageal squamous cell carcinomaThorac Cancer20178434434928509417
- KourtzelisIRafailSThe dual role of complement in cancer and its implication in anti-tumor therapyAnn Transl Med201641426527563652
- AxelgaardEJensenLDyrlundTFInvestigations on collectin liver 1J Biol Chem201328832234072342023814060
- SelmanLHansenSStructure and function of collectin liver 1 (CL-L1) and collectin 11 (CL-11, CL-K1)Immunobiology2012217985186322475410
- RooryckCDiaz-FontAOsbornDPMutations in lectin complement pathway genes COLEC11 and MASP1 cause 3MC syndromeNat Genet201143319720321258343
- MunyeMMDiaz-FontAOcakaLCOLEC10 is mutated in 3MC patients and regulates early craniofacial developmentPLoS Genet2017133e100667928301481
- UrquhartJRobertsRde SilvaDExploring the genetic basis of 3MC syndrome: findings in 12 further familiesAm J Med Genet A2016170A51216122426789649