
Abstract
Background
The aim of this investigation was to identify candidate single nucleotide polymorphisms (SNPs) and molecular pathways associated with tumor protein p53 (TP53) expression status in hepatitis B virus (HBV)-related hepatocellular carcinoma (HCC), clarify their potential mechanisms, and generate SNP-to-gene to pathway hypothesis.
Materials and methods
Identify candidate Causal SNPs and Pathways (ICSNPathway) was used to perform pathway analysis based on the results of our previous genome-wide association study of TP53 expression status in 387 HBV-related HCC patients.
Results
Through the ICSNPathway analysis, we identified 18 candidate SNPs and 10 candidate pathways that are associated with TP53 expression status in HBV-related HCC. The strongest mechanism involved the modulation of major histocompatibility complex, class II, DP beta 1 (human leukocyte antigen [HLA]-DPB1-rs1042153), major histocompatibility complex, class II, DQ beta 1 (HLA-DQB1-rs1130399, HLA-DQB1-rs1049056, HLA-DQB1-rs1049059, and HLA-DQB1-rs1049060), and major histocompatibility complex, class II, DR beta 1 (HLA-DRB1-rs35445101). SNPs consequently affected regulatory roles in all the candidate pathways except hematopoietic cell lineage pathways. Association analysis using the GSE14520 data set, Gene Multiple Association Network Integration Algorithm, and Search Tool for the Retrieval of Interacting Genes/Proteins suggests that all genes of the candidate SNPs were associated with TP53. Survival analysis showed that the collagen type VI alpha 3 chain (COL6A3) rs111231885 and COL6A3-rs113155945 and COL6A3 block 4 CC haplotypes with TP53 negative status may have protective effects in HBV-related HCC patients after hepatectomy.
Conclusion
Our pathway analysis identified 18 candidate SNPs and 10 candidate pathways that were associated with TP53 expression status in HBV-related HCC. Among these candidate SNPs, the genetic variation of COL6A3 may be a potential prognostic biomarker of HBV-related HCC.
Introduction
Liver cancer is the third leading cause of cancer death in China, with an age-standardized 5-year relative survival rate of 10.1%.Citation1,Citation2 The majority of liver cancer cases are hepatocellular carcinoma (HCC).Citation3 A high prevalence of hepatitis B virus (HBV) infection and aflatoxin B1 exposure are the main factors of HCC in the Guangxi province of China.Citation4–Citation6 Previous studies have demonstrated that the tumor protein p53 (TP53) mutation is frequently found in HBV-related HCC in patients of Guangxi province.Citation7–Citation10 Therefore, in the Guangxi region, there is a representative population in which the associations between HBV infection and the TP53 gene in HCC can be investigated.
Hepatocarcinogenesis is driven by the interaction of genetic and environmental factors.Citation11,Citation12 Genome-wide association studies (GWAS) can be used to identify associations between specific single nucleotide polymorphisms (SNPs) and complex diseases or other traits.Citation13 The roles of the corresponding genes or proteins in the context of the pathway might be altered by trait-related SNPs. Identify candidate Causal SNPs and Pathways (ICSNPathway) is an analytical framework for the comprehensive interpretation of GWAS data by integrating linkage disequilibrium (LD) analysis, functional SNP annotation, and pathway-based analysis (PBA) and can be used to derive the mechanism hypothesis of SNP→gene→pathway(s) for complex disease studies, including cancer.Citation14 In addition, ICSNPathway also is a tool based on PBA algorithm, which is a method for secondary excavation of GWAS results based on prior biological knowledge on gene function and biological metabolic pathways.Citation14 By using the PBA algorithm, more information about the pathway and gene sets with same functions which are associated with the diseases or traits from GWAS results could be obtained.
Our previous study has identified several SNPs associated with TP53 expression status in HBV-related HCC in patients of Guangxi by using the GWAS approach.Citation15 In the present study, we further investigated candidate SNPs and molecular pathways associated with TP53 expression status in HBV-related HCC by using the ICSNPathway web server based on the result of our previous GWAS.
Materials and methods
Study population and GWAS data
Our study was approved by the Ethics Committee of the First Affiliated Hospital of Guangxi Medical University with an ethics approval number of 2015 (KY-E-032).Citation15 Written informed consent was obtained from all the participants enrolled in the study. The primary GWAS data set was extracted from our previous study.Citation15 Clinicopathological characteristics and prognosis of the HBV-related HCC patients, genotyping, quality control, and GWAS analysis methods have been described and published in our earlier article.Citation15 A total of 403 patients with serum tests that were HBV surface antigen positive and newly diagnosed with HCC by pathological examination in the First Affiliated Hospital of Guangxi Medical University between 2001 and 2013 were included.Citation15 TP53 staining in HCC tumor tissues was detected by immunohistochemistry.Citation15 The SNPs were genotyped by an Illumina Human Exome BeadChip 12 v1-1 system (Illumina Inc, San Diego, CA, USA). Quality control standards were set as follows: samples were excluded if they had 1) an overall genotyping rate of <95%; 2) ambiguous gender; 3) genome-wide identity by-descent >0.1875; 4) outliers in principal component analysis (PCA) for ancestry and population stratification. SNPs had to meet the following criteria: 1) a call rate of >95%; 2) a Hardy–Weinberg equilibrium P>1×10⁻⁶; 3) a minor allele frequency >0.01.Citation15 PCA for ancestry and population stratification suggest that no or mild population stratification was found in the current study population, and similar results were observed in our previous study.Citation15 A total of 387 patients with 28,952 SNPs passed the quality control filters and were included in further investigations.
Identification of candidate SNPs and pathways
The ICSNPathway (http://icsnpathway.psych.ac.cn, accessed February 20, 2017) web server contains a two-stage analysis: 1) preselect candidate SNPs by LD analysis and functional SNP annotation based on the most significant SNPs and 2) annotate the biological mechanisms for the preselected candidate SNPs by using PBA.Citation14 A complete list of GWAS SNP P-values was input for ICSNPathway analysis. The parameters used in the ICSNPathway were 1) threshold to specify the most significant SNPs: P-value <1×10⁻²; 2) Hap-Map population: Han Chinese in Beijing, China; 3) LD cut-off: r2>0.8; 4) distance for searching LD neighborhoods: 200 kb; 5) rule of mapping SNPs to genes: 500 kb upstream and downstream of gene; 6) pathway/gene set database: Kyoto Encyclopedia of Genes and Genomes; 7) number of genes in each pathway/gene set: minimum 5 and maximum 100; and 8) false discovery rate cutoff for PBA: 0.1.
Association analysis
Based on the results of the ICSNPathway analysis, haplotype analysis among the candidate SNPs was calculated using Haploview version 4.2 (Broad Institute of MIT and Harvard, Cambridge, MA, USA).Citation16 Regional LD plots of the candidate SNPs were generated by SNP Annotation and Proxy Search (SNAP) (http://archive.broadinstitute.org/mpg/snap, accessed February 20, 2017), a tool used for the identification and annotation of proxy SNPs using HapMap.Citation17 Genotype and haplotype distribution of the candidate SNPs in different TP53 expression status groups were determined using a binary logistic regression model. Co-expression analysis of the TP53 gene and the genes of candidate SNPs was performed using GSE14520, a Chinese HBV-related HCC mRNA expression chip data set obtained from Gene Expression Omnibus (https://www.ncbi.nlm.nih.gov/geo, accessed February 20, 2017).Citation18,Citation19 In order to eliminate the batch effect of the expression chip, we only included the Affymetrix HT Human Genome U133A Array data set (Thermo Fisher Scientific, Waltham, MA, USA) of GSE14520 in the co-expression analysis. Gene Multiple Association Network Integration AlgorithmCitation20,Citation21 (GeneMANIA; http://genemania.org, accessed February 20, 2017) and Search Tool for the Retrieval of Interacting Genes/ProteinsCitation22,Citation23 (STRING; http://string.embl.de/, accessed February 20, 2017) web servers were used for investigating the gene–gene and protein–protein interactions (PPIs) among genes of the candidate SNPs, respectively.
Survival analysis
We further analyzed the association of the candidate SNPs and clinical outcomes. The TP53 expression status and the candidate SNP interactions were analyzed using a joint effects survival analysis. In addition, we also analyzed haplotypes of the candidate SNPs.
Statistical analysis
Pearson correlation coefficient was used to assess co-expression correlation. The odds ratio (OR) and the corresponding 95% confidence interval (CI) of the binary logistic regression model were used to estimate the relative risk of TP53 expression status in HBV-related HCC. Univariate analysis between clinical features and overall survival (OS) were studied using the Kaplan–Meier method with the log-rank test. Cox proportional hazards regression analysis was used to calculate the crude and adjusted hazard ratio (HR) and 95% CI in univariate and multivariate analyses, with adjustment for age, gender, race, body mass index (BMI), smoking status, drinking status, Barcelona Clinic Liver Cancer (BCLC) stage, cirrhosis, radical resection, antiviral therapy, status of tumor capsule, regional invasion, and portal vein tumor thrombus (PVTT). A value of P<0.05 was considered statistically significant. All the statistical analyses were conducted with SPSS version 20.0 software (IBM Corporation, Armonk, NY, USA).
Results
Candidate SNPs and pathways
Using the P-values of the 28,952 GWAS SNPs as input data, the ICSNPathway identified 18 SNPs as candidate SNPs () and 10 pathways as candidate pathways () that were associated with TP53 expression status in HBV-related HCC. All of the candidate SNPs were non-synonymous coding SNPs, and the alteration of four SNPs (desmoglein 3 [DSG3]-rs16961975, keratin 35 (KRT35)-rs2071601, KRT35-rs743686, and keratin 36 (KRT36)-rs2301354) was deleterious. The strongest mechanism involved the modulation of major histocompatibility complex, class II, DP beta 1 (human leukocyte antigen [HLA]-DPB1-rs1042153), major histocompatibility complex, class II, DQ beta 1 (HLA-DQB1-rs1130399, HLA-DQB1-rs1049056, HLA-DQB1-rs1049059, and HLA-DQB1-rs1049060) and major histocompatibility complex, class II, DR beta 1 (HLA-DRB1-rs35445101), consequently affecting their regulatory roles in all the candidate pathways except the hematopoietic cell lineage pathway. The second strongest hypothetical biological mechanism was that SNPs of major histocompatibility complex, class I, C (HLA-C-rs1131096 and HLA-C-rs1130838) influence the regulatory role of cell adhesion molecules (CAMs), autoimmune thyroid disease, allograft rejection, antigen processing and presentation, type I diabetes mellitus, and graft-versus-host disease pathways. Other multiple mechanisms presented in and indicated that alterations in candidate SNPs of collagen type VI alpha 3 chain (COL6A3)-rs111231885 and COL6A3-rs113155945, desmoglein 3 (DSG3)-rs16961975, keratin 32 (KRT32)-rs3744786), keratin 35 (KRT35)-rs2071601 and KRT35-rs743686, and keratin 36 (KRT36)-rs2301354 affect their regulatory roles in cell communication, whereas legumain (LGMN)-rs118128989 alterations affected the antigen processing and presentation pathway and interleukin 6 receptor (IL6R)-rs2228145, interleukin 7 receptor (IL7R)-rs6897932 alterations affected the hematopoietic cell lineage pathway.
Table 1 Candidate SNPs identified from ICSNPathway analysis
Table 2 Candidate pathways identified from ICSNPathway analysis
Association analysis
In the output of candidate SNPs, KRT32-rs3744786 and KRT35-rs2071601 were not present in the original GWAS result. So, only 16 candidate SNPs and their corresponding genes were included in further association and survival analysis. Four haplotype blocks were detected in the haplotypes analysis (block 1 pairwise r2=0.992, constituted by HLA-C-rs1130838 and HLA-C-rs1131096; block 2 pairwise r2=0.121–1.0, constituted by HLA-DRB1-rs35445101, HLA-DQB1-rs1130399, HLA-DQB1-rs1049060, HLA-DQB1-rs1049059, and HLA-DQB1-rs1049056; block 3 pairwise r2=0.973, constituted by KRT35-rs743686 and KRT36-rs2301354; block 4 pairwise r2=0.755, constituted by COL6A3-rs111231885 and COL6A3-rs113155945; ). Distribution of candidate SNPs in different TP53 expression status patients is shown in Table S1. After adjusting for age, gender, race, BMI, smoking status, drinking status, BCLC stage, cirrhosis, radical resection, antiviral therapy, status of tumor capsule, regional invasion, and PVTT, all the SNPs were significantly associated with TP53 expression status in HBV-related HCC. Association analysis in four haplotypes demonstrated that GT in block 1, AGTCC and GATCC/other haplotypes in block 2, GA/other haplotypes in block 3, and TT/other haplotypes in block 4 had significantly decreased risk of TP53 expression status in HBV-related HCC, compared to patients with TC, AGAGA, AG, and CC (), respectively.
Table 3 Haplotype distribution of the candidate SNPs in patients with different TP53 expression status
Figure 1 Haplotype association of the candidate SNPs and co-expression heat map for the TP53 gene and corresponding genes of the candidate SNPs.
Notes: (A) Patterns of LD plots for 16 candidate SNPs. (B) Co-expression heat map between TP53 and corresponding genes of the candidate SNPs.
Abbreviations: SNP, single nucleotide polymorphism; TP53, tumor protein p53; LD, linkage disequilibrium.
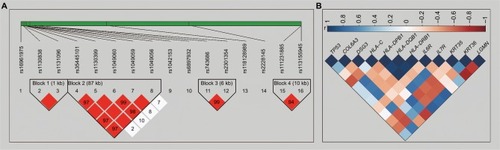
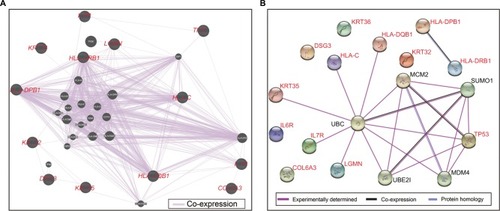
Co-expression analysis in HBV-related HCC expression profile data set from the GSE14520 cohort revealed that the TP53 gene has a significantly weak negative correlation with HLA-C (r=−0.322, P<0.001), IL6R (r=−0.132, P=0.007), and KRT36 (r=−0.186, P<0.001), whereas it had a positive correlation with COL6A3 (r=0.238, P<0.001), HLA-DPB1 (r=0.115, P=0.018), HLA-DQB1 (r=0.176, P=0.0003), and LGMN (r=0.157, P=0.001) at the mRNA level in HBV-related HCC of GSE14520; the co-expression heat map is shown in . The remaining genes were not significantly correlated with TP53 at the mRNA level. Gene and gene co-expression interaction networks constructed by GeneMANIA demonstrated that all the genes of the candidate SNPs exist in a complex gene–gene co-expression interaction network and are directly or indirectly associated with TP53 (). In addition, PPIs determined experimentally and constructed by STRING showed that HLA-DQB1, HLA-C, KRT35, IL7R, and LGMN were associated with TP53 through ubiquitin C (UBC) ().
Figure 2 Gene–gene and protein–protein interaction networks.
Notes: (A) Gene–gene interaction networks constructed by GeneMANIA. (B) Protein–protein interaction networks constructed by STRING.
Abbreviations: GeneMANIA, Gene Multiple Association Network Integration Algorithm; STRING, Search Tool for the Retrieval of Interacting Genes/Proteins; TP53, tumor protein p53; UBC, ubiquitin C; HLA-DPB1, major histocompatibility complex, class II, DP beta 1; HLA-DQB1, major histocompatibility complex, class II, DQ beta 1; HLA-DRB1, major histocompatibility complex, class II, DR beta 1; HLA-C, major histocompatibility complex, class I, C; COL6A3, collagen type VI alpha 3 chain; DSG3, desmoglein 3; KRT32, keratin 32; KRT35, keratin 35; KRT36, keratin 36; LGMN, legumain; IL6R, interleukin 6 receptor; IL7R, interleukin 7 receptor.
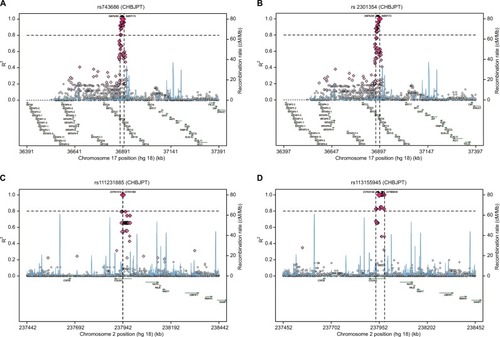
Detailed regional LD plots of the four haplotype blocks of the candidate SNPs were generated by SNAP. Regional LD plots for four SNPs of HLA-DQB1 in block 2 are shown in , whereas the regional LD plot of HLA-DRB1-rs35445101 in block 2 was not available on the SNAP website. Regional LD plots of block 3 () and block 4 () are shown in , whereas the regional LD plot for block 1 of HLA-C-rs1131096 and HLA-C-rs1130838 was not available on the SNAP website. Regional LD plot for these SNPs indicated that there were strong LD loci of these blocks detectable in the region nearby them.
Figure 3 Regional LD plots of block 2 (HLA-DQB1).
Notes: Regional LD plots of (A) HLA-DQB1-rs1049056, (B) HLA-DQB1-rs1049059, (C) HLA-DQB1-rs1049060, and (D) HLA-DQB1-rs1130399.
Abbreviations: LD, linkage disequilibrium; HLA-DQB1, major histocompatibility complex, class II, DQ beta 1; CHB, chronic hepatitis B.
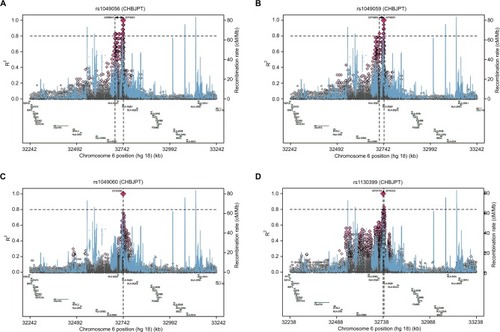
Figure 4 Regional LD plots of block 3 (KRT35 and KRT36) and block 4 (COL6A3).
Notes: Regional LD plots of (A) KRT35-rs743686, (B) KRT36-rs2301354, (C) COL6A3-rs111231885, and (D) COL6A3-rs113155945.
Abbreviations: LD, linkage disequilibrium; KRT35, keratin 35; KRT36, keratin 36; COL6A3, collagen type VI alpha 3 chain.
Survival analysis
Survival analysis was used to further investigate the associations between the candidate SNPs and haplotypes with HBV-related HCC prognosis. Clinicopathological characteristics and prognosis information of patients with HBV-related HCC have been described and published in an earlier articleCitation15 and shown in . Survival analysis of COL6A3-rs111231885 showed that patients with the T allele had a shorter median survival time (MST) than those with the C allele (51 vs 33 months for CC vs TT/TC, log-rank P=0.012; Table S2). After adjusting for age, gender, race, BMI, smoking status, drinking status, BCLC stage, cirrhosis, radical resection, antiviral therapy, status of tumor capsule, regional invasion, and PVTT in the Cox proportional hazards regression model, patients with the T allele had a significantly increased risk of death compared to those with the C allele (adjusted P=0.043, HR=1.64, 95% CI=1.015–2.647; Table S2). Similar results were also observed with COL6A3-rs113155945; patients with the TT genotype had a significantly increased risk of death compared to the CC genotype (adjusted P=0.047, HR=4.281, 95% CI=1.017–18.022; Table S2). In addition, joint effects analysis was also used to explore the SNPs and TP53 interaction in HBV-related HCC prognosis. TP53-negative patients with the COL6A3-rs111231885 T allele carriers had a significantly increased risk of death (adjusted P=0.034, HR=1.994, 95% CI=1.052–3.778; Table S3) and a poor clinical outcome (MST: 33 vs 68 months for TT/TC vs CC, log-rank P=0.031; Table S3) in HBV-related HCC, compared to TP53-negative patients with C allele carriers. No other genotypes were significantly associated with OS in single and joint effects analysis.
Table 4 Clinicopathological characteristics of patients with HBV-related HCC after data quality control
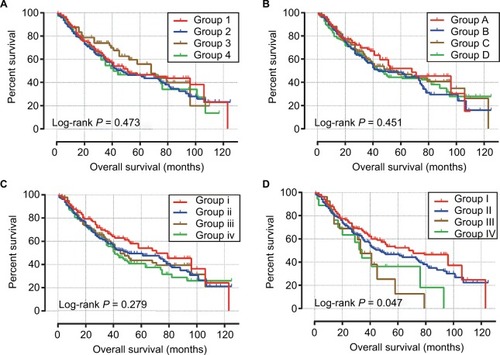
Survival analysis for haplotypes of candidate SNPs is shown in , and indicated that patients with TT/other haplotypes in block 4 had a significantly shorter OS (MST: 33 vs 51 months for TT/other haplotypes vs CC, log-rank P=0.019; , ). Multivariate analyses of the Cox proportional hazards regression model suggest that patients with TT/other haplotypes in block 4 had increased risk of death in HBV-related HCC (adjusted P=0.07, HR=1.450, 95% CI=0.970–2.167; ), with a critically significant P-value, compared to patients with CC haplotypes. Joint effects analysis () indicated that TP53-negative patients with TT/other haplotypes in block 4 had a significantly poor prognosis (MST: 33 vs 68 months for TT/other haplotypes vs CC haplotypes, log-rank P=0.047; , ) and increased risk of death in HBV-related HCC (adjusted P=0.047, HR=1.713, 95% CI =1.006–2.918; ), compared to TP53-negative patients with CC haplotypes. No other haplotypes were significantly associated with OS in single or joint effects analysis.
Table 5 Survival analysis of different haplotypes
Table 6 Joint effects survival analysis of different haplotypes and TP53 expression status
Figure 5 Survival curves of different haplotypes.
Notes: OS stratified by (A) block 1 haplotypes, (B) block 2 haplotypes, (C) block 3 haplotypes, (D) block 4 haplotypes.
Abbreviations: OS, overall survival.
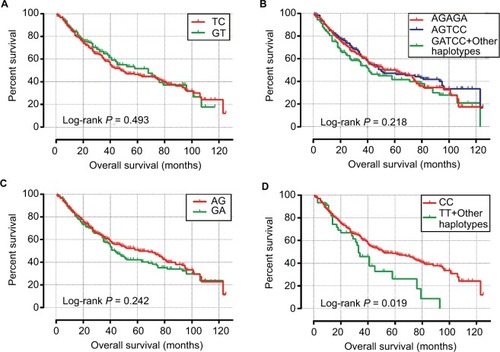
Figure 6 Joint effects survival analysis of different haplotypes and TP53 expression status.
Notes: OS stratified by (A) block 1 haplotypes and TP53 expression status, (B) block 2 haplotypes and TP53 expression status, (C) block 3 haplotypes and TP53 expression status, (D) block 4 haplotypes and TP53 expression status.
Abbreviations: OS, overall survival; TP53, tumor protein p53.
Discussion
The GWAS approach is increasingly being used to discover the association between genes and disease. However, most GWAS have focused on SNPs with high statistical significance, whereas many other SNPs have received little attention and the full potential of these data have not been fully exploited.Citation24,Citation25 Therefore, it is necessary to perform in-depth data mining with GWAS results. Genome-wide pathway analysis can investigate the GWAS SNPs through a SNP→gene→pathway approach to discover the overrepresented pathways in the GWAS data, which would consider rare variants, multi-omics, and interactions. In the current study, ICSNPathway analysis identified 18 candidate SNPs and 10 candidate pathways that are associated with TP53 expression status in HBV-related HCC. Five hypothetical biological mechanisms can be obtained from ICSNPathway analysis.
The strongest hypothetical biological mechanism found that the candidate SNPs of HLA-DPB1, HLA-DQB1, and HLA-DRB1 affected their regulatory roles in all the candidate pathways except hematopoietic cell lineage pathway. The major histocompatibility complex class II molecule is a heterodimer consisting of an alpha (DQA) and a beta chain (DQB), both anchored in the membrane. Previous studies have demonstrated that HLA-DPB1 polymorphisms were significantly associated with the risk of HBV infection susceptibility,Citation26,Citation27 whereas the distribution of the SNPs genotype frequencies was similar in HCC and chronic hepatitis B patients.Citation26,Citation28 A case–control study that compared persistence and natural clearance of HBV infection in a population indicated that the HLA-DPB1-rs9277535 A allele has a major effect on the risk of persistent HBV infection.Citation29 Subsequently, another study also reported that HLA-DPB1-rs9277535 was significantly related to HBV infection risks and increased HBV clearance possibility in a dose-dependent manner.Citation30 Furthermore, the polymorphisms of another HLA class II molecule, HLA-DQB1, were also associated with the development of chronic HBV infection and liver cirrhosis,Citation31 as well as the risk factor of HCC.Citation32,Citation33 In addition, our previous study also showed that HLA-DQB1 polymorphisms have a prognosis predictive value in HBV-related HCC patients undergoing hepatic resection.Citation34 Similar genetic susceptibility research on HLA-DRB1 also demonstrated that polymorphisms in the HLA-DRB1 gene were significantly associated with HCC risk, HBV infection, and progression from CHB to HCC.Citation35–Citation38
The second strongest mechanism was that a candidate SNP of HLA-C-rs1131096 and HLA-C-rs1130838 influenced the regulatory role of CAMs, autoimmune thyroid disease, allograft rejection, antigen processing and presentation, type I diabetes mellitus, and graft-versus-host disease pathways. HLA-C belongs to the HLA class I heavy chain paralogues and its genetic variation can influence the risk of HBV-related HCC development;Citation39 furthermore, HLA-C*15 is also an important host immunogenetic factor that negatively associates with hepatitis C virus viral load in chronic hepatitis C patients.Citation40
Studies of major histocompatibility complex class I and II gene polymorphisms demonstrate a risk factor for hepatitis virus and HCC. In the current study, our findings suggest that genetic variation in HLA-DPB1, HLA-DQB1, HLA-DRB1, and HLA-C were associated with TP53 expression status in HBV-related HCC. These results contribute to a better understanding of the heritability of HLA-DPB1, HLA-DQB1, HLA-DRB1, and HLA-C in HBV-related HCC and subsequently provide hypotheses to clarify their potential mechanisms in HBV and HCC genetic susceptibility.
In the remaining genes with candidate SNPs, we only found that IL6R and IL7R were associated with HCC among the previous studies, whereas associations between the other genes and human HCC have not been reported. IL6R encodes a subunit of the IL6R complex, and its dysregulation is related to the pathogenesis of many diseases, including cancer. A study by Deng et al revealed that the IL6R-rs6684439 T allele is associated with a lower susceptibility of HBV-related HCC in the Guangxi population,Citation41 whereas miR-451 plays a suppressive role in tumor angiogenesis via the regulation of the IL6R-signal transducer and activator of transcription 3-vascular endothelial growth factor signaling pathway.Citation42 Research by Midorikawa et al confirms that IL7R is downregulated in well-differentiated tumor tissue in HCC and can serve as a predictor gene of HCC dedifferentiation.Citation43 Our results contribute to a better understanding of genes associated with different HBV-related HCC subgroups.
Our association analysis demonstrated that seven genes with candidate SNPs were correlated to TP53 at the HBV-related HCC mRNA level, whereas PPI networks showed that five genes with candidate SNPs were associated with TP53 via UBC through experiments. However, the GeneMANIA gene–gene interaction networks showed complex co-expression networks among those genes, and all genes were directly or indirectly related to the TP53 gene. In the present study, we confirmed that LGMN and TP53 are positively correlated at the mRNA level in HBV-related HCC based on the GSE14520 data set, and our bioinformatics analysis by GeneMANIA also suggests that LGMN and TP53 were co-expressed via the TAP1 gene, whereas LGMN was also related to TP53 via the UBC gene in the PPI networks that were constructed by STRING. A study by Murthy et al has reported that LGMN was significantly upregulated in tumor tissue and its low expression showed a better prognosis in colorectal cancer (CRC); meanwhile, it has a positive correlation with TP53.Citation44 LGMN expression and its enzyme activity can also be regulated by TP53, and knockdown experiments suggest that LGMN and TP53 have a positive correlation in HCT116 cells.Citation45 Our bioinformatics analysis also suggests that IL7R is associated with TP53 in GeneMANIA and PPI networks, and IL7/IL7R prevents apoptosis by regulating bcl-2 expression and the TP53 pathway in A549 and human bronchial epithelial cells.Citation46 Among the 10 candidate pathways, CAMs and cell communication pathways were the most common hypothetical biological mechanisms that involved the majority of candidate SNPs. CAMs play an important role in cell communicationCitation47 and are associated with HCC diagnosis and survival prediction.Citation48,Citation49 Our findings suggest a novel hypothetical biological mechanism between CAMs and TP53 expression status in HBV-related HCC.
Survival analysis in the current study indicates that the C allele of COL6A3-rs111231885 and COL6A3-rs113155945, and COL6A3 block 4 CC haplotypes with TP53 negative status significantly decrease the risk of death in HBV-related HCC patients after hepatectomy. Previous studies have confirmed that high COL6A3 expression was significantly associated with poor prognosis and its mutation can be used for survival prediction in CRC.Citation50,Citation51 Furthermore, COL6A3 was markedly upregulated in the tumor tissue of gastric cancer,Citation52,Citation53 pancreatic cancer,Citation54,Citation55 and CRCCitation50,Citation56 and can serve as a potential diagnostic biomarker in these cancers. This evidence suggests that COL6A3 may be a potential diagnosis and prognosis marker in CRC and may serve as an oncogene of CRC. Our findings demonstrate that several SNPs of COL6A3 have a prediction value for HBV-related HCC prognosis and provide insight into the clinical utility of HBV-related HCC prognosis. Once validated, COL6A3 may be used for prognosis prediction and decision-making in HCC management.
There were limitations in our study that need to be recognized. First, our study evaluates the association between TP53 expression status and candidate SNPs using the GWAS approach, and validates the association between the genes of the candidate SNPs and TP53 using the Gene Expression Omnibus data set, GeneMANIA, and STRING bioinformatics tools that lack confirmation by in vivo and in vitro experiments. Second, all patients in the present study were exclusively from a Guangxi population of HBV-related HCC; therefore, in order to generalize our findings, additional external validation in cohorts from other ethnic populations is necessary to confirm our results.
Despite these limitations, our study is the first to explore the association between the SNPs and molecular pathways associated with TP53 expression status in HBV-related HCC by using the genome-wide association pathway analysis approach, and that might have etiology or clinical implications.
Conclusion
Genome-wide association pathway analysis in the current study identified 18 candidate SNPs and 10 candidate pathways that are associated with TP53 expression status in HBV-related HCC and generated five novel SNP-to-gene to pathway hypotheses. These results contribute to a better understanding of the heritability of HBV-related HCC in different TP53 expression subgroups and provide evidence for personalized treatment strategies of different TP53 expression subgroups in HBV-related HCC patients. Additional in vivo and in vitro experimental studies will be necessary to elucidate the role of these pathways in different TP53 expression subgroups of HBV-related HCC. Among these candidate SNPs, the C allele of COL6A3-rs111231885 and COL6A3-rs113155945, and COL6A3 block 4 CC haplotypes with TP53 negative status may have protective effects in HBV-related HCC patients after hepatectomy and can serve as a potential prognostic biomarker. Further well-designed and larger sample size studies are needed to validate the associations between COL6A3 genetic variation and HBV-related HCC prognosis.
Acknowledgments
This work was supported in part by the National Natural Science Foundation of China (no. 81560535, 81072321, 30760243, 30460143, and 30560133), 2009 Program for New Century Excellent Talents in University, Guangxi Natural Science Foundation (no. GuiKeGong 1104003A-7), Guangxi Health Ministry Medicine Grant (Key-Scientific Research-Grant Z201018), and Self-raised Scientific Research Fund of the Health and Family Planning Commission of Guangxi Zhuang Autonomous Region (Z2016318). We also acknowledge the support offered by the National Key Clinical Specialty Programs (General Surgery and Oncology) and the Key Laboratory of Early Prevention and Treatment for Regional High-Incidence-Tumor (Guangxi Medical University), Ministry of Education, China. The authors thank Prof Minhao Peng, Lequn Li, Xiao Qin, Kaiyin Xiao, Xigang Chen, Bin Chen, Zhixiong Su, Ming Su, Zhang Wen, Jingning Lu, Ning Peng, and Hai Zhu, from the Department of Hepatobiliary Surgery, First Affiliated Hospital of Guangxi Medical University, for providing part of the HCC samples for this study. Thanks also go to Prof Xue Qin (Department of Clinical Laboratory, First Affiliated Hospital of Guangxi Medical University) for providing patient’s serum AFP assay results, and Prof Zengnan Mo (Center for Genomic and Personalized Medicine, Guangxi Medical University) for help in the GWAS analysis. We would like to acknowledge the assistance offered by researcher Jiaquan Li and Ying Gui from Guangxi Medical University for their contribution to specimen management. In addition, we also would like to acknowledge the contributors of GSE14520 (https://www.ncbi.nlm.nih.gov/geo/query/acc.cgi?acc=GSE14520) for sharing their data set on open access. We thank our reviewers for helpful comments on this article.
Disclosure
The authors report no conflicts of interest in this work.
References
- ChenWZhengRBaadePDCancer statistics in China, 2015CA Cancer J Clin201666211513226808342
- ZengHZhengRGuoYCancer survival in China, 2003–2005: a population-based studyInt J Cancer201513681921193025242378
- El-SeragHBRudolphKLHepatocellular carcinoma: epidemiology and molecular carcinogenesisGastroenterology200713272557257617570226
- SchweitzerAHornJMikolajczykRTKrauseGOttJJEstimations of worldwide prevalence of chronic hepatitis B virus infection: a systematic review of data published between 1965 and 2013Lancet2015386100031546155526231459
- QiLNLiLQChenYYGenome-wide and differential proteomic analysis of hepatitis B virus and aflatoxin B1 related hepatocellular carcinoma in Guangxi, ChinaPLoS One2013812e8346524391771
- LiuZMLiLQPengMHHepatitis B virus infection contributes to oxidative stress in a population exposed to aflatoxin B1 and high-risk for hepatocellular carcinomaCancer Lett2008263221222218280645
- YuLLiuXHanCXRCC1 rs25487 genetic variant and TP53 mutation at codon 249 predict clinical outcomes of hepatitis B virusrelated hepatocellular carcinoma after hepatectomy: a cohort study for 10 years’ follow upHepatol Res201646876577426519348
- SternMCUmbachDMYuMCLondonSJZhangZQTaylorJAHepatitis B, aflatoxin B(1), and p53 codon 249 mutation in hepatocellular carcinomas from Guangxi, People’s Republic of China, and a meta-analysis of existing studiesCancer Epidemiol Biomarkers Prev200110661762511401911
- QiLNBaiTChenZSThe p53 mutation spectrum in hepatocellular carcinoma from Guangxi, China: role of chronic hepatitis B virus infection and aflatoxin B1 exposureLiver Int2015353999100924461059
- LongXDMaYHuangHDYaoJGQuDYLuYLPolymorphism of XRCC1 and the frequency of mutation in codon 249 of the p53 gene in hepatocellular carcinoma among Guangxi population, ChinaMol Carcinog200847429530017849423
- FaraziPADePinhoRAHepatocellular carcinoma pathogenesis: from genes to environmentNat Rev Cancer20066967468716929323
- LlovetJMZucman-RossiJPikarskyEHepatocellular carcinomaNat Rev Dis Primers201621601827158749
- ManolioTAGenomewide association studies and assessment of the risk of diseaseN Engl J Med2010363216617620647212
- ZhangKChangSCuiSGuoLZhangLWangJICSNPathway: identify candidate causal SNPs and pathways from genome-wide association study by one analytical frameworkNucleic Acids Res201139Web Server issueW437W44321622953
- LiaoXHanCQinWGenome-wide association study identified PLCE1-rs2797992 and EGFR-rs6950826 were associated with TP53 expression in the HBV-related hepatocellular carcinoma of Chinese patients in GuangxiAm J Transl Res2016841799181227186304
- BarrettJCFryBMallerJDalyMJHaploview: analysis and visualization of LD and haplotype mapsBioinformatics200521226326515297300
- JohnsonADHandsakerREPulitSLNizzariMMO’DonnellCJde BakkerPISNAP: a web-based tool for identification and annotation of proxy SNPs using HapMapBioinformatics200824242938293918974171
- RoesslerSLongELBudhuAIntegrative genomic identification of genes on 8p associated with hepatocellular carcinoma progression and patient survivalGastroenterology2012142495796622202459
- RoesslerSJiaHLBudhuAA unique metastasis gene signature enables prediction of tumor relapse in early-stage hepatocellular carcinoma patientsCancer Res20107024102021021221159642
- Warde-FarleyDDonaldsonSLComesOThe GeneMANIA prediction server: biological network integration for gene prioritization and predicting gene functionNucleic Acids Res201038Web Server issueW214W22020576703
- MostafaviSRayDWarde-FarleyDGrouiosCMorrisQGeneMANIA: a real-time multiple association network integration algorithm for predicting gene functionGenome Biol20089Suppl 1S4
- SzklarczykDFranceschiniAWyderSSTRING v10: protein–protein interaction networks, integrated over the tree of lifeNucleic Acids Res201543Database issueD447D45225352553
- von MeringCHuynenMJaeggiDSchmidtSBorkPSnelBSTRING: a database of predicted functional associations between proteinsNucleic Acids Res200331125826112519996
- RamananVKShenLMooreJHSaykinAJPathway analysis of genomic data: concepts, methods, and prospects for future developmentTrends Genet201228732333222480918
- ElbersCCvan EijkKRFrankeLUsing genome-wide pathway analysis to unravel the etiology of complex diseasesGenet Epidemiol200933541943119235186
- PosuwanNPayungpornSTangkijvanichPGenetic association of human leukocyte antigens with chronicity or resolution of hepatitis B infection in Thai populationPLoS One201491e8600724465836
- KimYJKimHYLeeJHA genome-wide association study identified new variants associated with the risk of chronic hepatitis BHum Mol Genet201322204233423823760081
- DonaldsonPTHoSWilliamsRJohnsonPJHLA class II alleles in Chinese patients with hepatocellular carcinomaLiver200121214314811318984
- AkgolluEBilginRAkkizHAssociation between chronic hepatitis B virus infection and HLA-DP gene polymorphisms in the Turkish populationVirus Res201723261228119119
- YuLChengYJChengMLQuantitative assessment of common genetic variations in HLA-DP with hepatitis B virus infection, clearance and hepatocellular carcinoma developmentSci Rep201551493326462556
- LiuCChengBAssociation of polymorphisms of human leucocyte antigen-DQA1 and DQB1 alleles with chronic hepatitis B virus infection, liver cirrhosis and hepatocellular carcinoma in ChineseInt J Immunogenet200734537337817845309
- El-ChennawiFAAufFAMetwallySSMosaadYMEl-WahabMATawhidZEHLA-class II alleles in Egyptian patients with hepatocellular carcinomaImmunol Invest200837766167418821214
- De ReVCaggiariLTalaminiRHepatitis C virus-related hepatocellular carcinoma and B-cell lymphoma patients show a different profile of major histocompatibility complex class II allelesHum Immunol200465111397140415556690
- LiuXYuLHanCPolymorphisms of HLA-DQB1 predict survival of hepatitis B virus-related hepatocellular carcinoma patients receiving hepatic resectionClin Res Hepatol Gastroenterol201640673974727288300
- ShiYZhaiWWangBGenetic susceptibility of eight nonsynonymous polymorphisms in HLA-DRB1 gene to hepatocellular carcinoma in Han ChineseOncotarget2016749809358094227821814
- JiangDKMaXPWuXGenetic variations in STAT4, C2, HLA-DRB1 and HLA-DQ associated with risk of hepatitis B virus-related liver cirrhosisSci Rep201551627826538132
- LiSQianJYangYGWAS identifies novel susceptibility loci on 6p21.32 and 21q21.3 for hepatocellular carcinoma in chronic hepatitis B virus carriersPLoS Genet201287e100279122807686
- JinYJShimJHChungYHRelationship of HLA-DRB1 alleles with hepatocellular carcinoma development in chronic hepatitis B patientsJ Clin Gastroenterol201246542042622499074
- PanNJiangWSunHKIR and HLA loci are associated with hepatocellular carcinoma development in patients with hepatitis B virus infection: a case-control studyPLoS One2011610e2568221998681
- TsengKCTsengCWHsiehYHEffect of human leukocyte antigen class I and II alleles on hepatitis C viral load among chronic hepatitis C patients in Southern TaiwanHum Immunol201374897898223628398
- DengYLiMWangJSusceptibility to hepatocellular carcinoma in the Chinese population: associations with interleukin-6 receptor polymorphismTumour Biol20143576383638824668548
- LiuXZhangAXiangJLvYZhangXmiR-451 acts as a suppressor of angiogenesis in hepatocellular carcinoma by targeting the IL-6R-STAT3 pathwayOncol Rep20163631385139227461244
- MidorikawaYTsutsumiSTaniguchiHIdentification of genes associated with dedifferentiation of hepatocellular carcinoma with expression profiling analysisJpn J Cancer Res200293663664312079511
- MurthyRVArbmanGGaoJRoodmanGDSunXFLegumain expression in relation to clinicopathologic and biological variables in colorectal cancerClin Cancer Res20051162293229915788679
- YamaneTMuraoSKato-OseITranscriptional regulation of the legumain gene by p53 in HCT116 cellsBiochem Biophys Res Commun2013438461361823942113
- LiuZHWangMHRenHJInterleukin 7 signaling prevents apoptosis by regulating bcl-2 and bax via the p53 pathway in human non-small cell lung cancer cellsInt J Clin Exp Pathol20147387088124695377
- LinhardtRJToidaTRole of glycosaminoglycans in cellular communicationAcc Chem Res200437743143815260505
- IliazRAkyuzUTekinDRole of several cytokines and adhesion molecules in the diagnosis and prediction of survival of hepatocellular carcinomaArab J Gastroenterol201617416416727916547
- ShimizuYMinemuraMTsukishiroTSerum concentration of intercellular adhesion molecule-1 in patients with hepatocellular carcinoma is a marker of the disease progression and prognosisHepatology19952225255317543436
- QiaoJFangCYChenSXStroma derived COL6A3 is a potential prognosis marker of colorectal carcinoma revealed by quantitative proteomicsOncotarget2015630299292994626338966
- YuJWuWKLiXNovel recurrently mutated genes and a prognostic mutation signature in colorectal cancerGut201564463664524951259
- XieXLiuXZhangQYuJOverexpression of collagen VI α3 in gastric cancerOncol Lett2014751537154324765172
- SunHIdentification of key genes associated with gastric cancer based on DNA microarray dataOncol Lett201611152553026870242
- ArafatHLazarMSalemKTumor-specific expression and alternative splicing of the COL6A3 gene in pancreatic cancerSurgery2011150230631521719059
- KangCYWangJAxell-HouseDClinical significance of serum COL6A3 in pancreatic ductal adenocarcinomaJ Gastrointest Surg201418171524002763
- SnezhkinaAVKrasnovGSZaretskyARDifferential expression of alternatively spliced transcripts related to energy metabolism in colorectal cancerBMC Genomics201617Suppl 14101128105922