
Abstract
Purpose
Epithelial cell transforming sequence 2 (ECT2) is a guanine nucleotide exchange factor, which is involved in cell division regulation and cell cycle modulation. Recent evidence indicates that ECT2 is overexpressed in many human cancers. However, the exact prognostic value of ECT2 in lung cancer has not been elucidated.
Patients and methods
In the current study, we performed correlation and prognosis analyses using public databases and conducted immunohistochemical staining in tissue microarrays, using samples from 204 lung cancer patients with survival data.
Results
We found that the expression of ECT2 was markedly increased in lung cancer tissues compared with normal tissues. Moreover, we demonstrated that the expression of ECT2 was related to tumor cell differentiation degree, TNM stage, lymph node metastasis, and prognosis in non-small-cell lung cancer (NSCLC). A correlation analysis indicated that ECT2 levels were significantly correlated with proliferating cell nuclear antigen (PCNA) levels in NSCLC. Furthermore, Kaplan–Meier analyses revealed that high ECT2 expression was associated with unfavorable overall survival (OS) and progression-free survival (PFS) in NSCLC patients.
Conclusion
Taken together, these results indicate that the overexpression of ECT2 contributes to tumor invasion and progression, suggesting that ECT2 is a potential prognostic marker for NSCLC patients.
Introduction
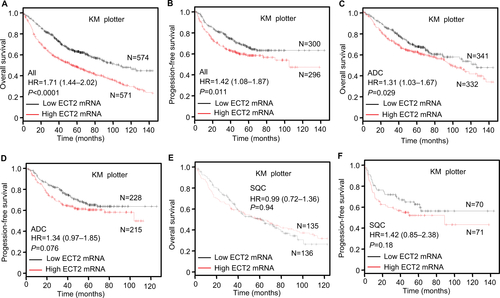
Non-small-cell lung cancer (NSCLC) including lung adenocarcinoma (ADC), lung squamous cell carcinoma (SQC) and large cell carcinoma, is the most common pathological type of lung cancer and is one of the leading causes of cancer-related death worldwide.Citation1 Activation of KRAS is most frequent oncogenic driver for ADC, and a recent study identified that epithelial cell transforming sequence 2 (ECT2)-dependent rRNA synthesis is required for KRAS-driven lung ADC.Citation2 ECT2, a guanine nucleotide exchange factor (GEF), was originally reported to regulate cell division via Rho signaling pathways, and interaction between ECT2 and the plasma membrane during anaphase is required and sufficient for cytokinesis.Citation3 Recent evidence has indicated that ECT2 is overexpressed in various human cancers and is related to tumor cell differentiation, TNM stage, lymph node metastasis, and prognosis. For example, Wang et alCitation4 found that high expression of ECT2 predicted a poor prognosis and may play a critical role in breast cancer. Chen et alCitation5 reported that high ECT2 expression was an independent prognostic factor for osteosarcoma and can upregulate the metastatic capacity of osteosarcoma cells. Jin et alCitation6 found that ECT2 was significantly associated with the degree of histological differentiation, invasion depth, lymph node metastasis, distant metastasis, TNM stage and overall survival rate in gastric cancer patients. Sano et alCitation7 reported that the expression of ECT2 was markedly increased in poorly differentiated gliomas compared with well differentiated gliomas, and a high level expression of ECT2 predicted poor survival. A mechanistic study indicated that knockdown of ECT2 can inhibit Rac1 activity and block the growth, invasion and tumorigenicity of lung ADC cells.Citation8 In summary, ECT2 has been shown to play an important oncogenic role in many human cancers. However, the precise role of ECT2 in lung cancer progression and prognosis is not well defined. To explore the functions of ECT2, we carried out an analysis based on Kaplan–Meier plotted datasets, which indicated that patients with higher mRNA levels of ECT2 had poor overall survival (hazard ratio [HR] =1.71, 95% CI: 1.44–2.02, P<0.0001) (Figure S1 A) and progression-free survival (HR =1.42, 95% CI: 1.08–1.87, P=0.011) (Figure S1 B). Furthermore, we investigated the effect of ECT2 mRNA levels on the prognosis of ADC and SQC. We found that high ECT2 expression in ADC was an unfavorable prognostic element for overall survival (HR =1.31, 95% CI: 1.03–1.67, P=0.029) (Figure S1 C) and progression-free survival (HR =1.34, 95% CI: 0.97–1.85, P=0.076) (Figure S1 D). However high ECT2 expression could not serve as a predictor for overall survival (HR =0.99, 95% CI: 0.72–1.36, P=0.94) and progression-free survival (HR =1.42, 95% CI: 0.85–2.38, P=0.18) among the SQC population (Figure S1 E, F). In summary, these analyses indicated high ECT2 mRNA expression predicted poor survival in NSCLC. To validate the conclusion from the Kaplan–Meier plotter, we conducted a comprehensive study to investigate the relationship between ECT2 expression and clinical pathological features through a systematic mRNA expression analysis based on open database and immunohistochemical staining.
Materials and methods
Online analysis tool
Kaplan–Meier survival curves with a log-rank test were calculated and plotted using the analysis tool which is available online at: http://kmplot.com. The background database downloaded from GEO (https://www.ncbi.nlm.nih.gov/geo/) offers gene expression data, relapse-free and overall survival information. A total of 2,437 lung cancer patients were divided into two groups according to the expression levels of ECT2, and then the Kaplan–Meier survival curves were downloaded from the website and adjusted in Adobe Illustrator CS6.
Human lung cancer tissue array
Three commercial human lung cancer tissue microarrays (TMAs) were purchased, including one BC041115c (Alena-bio, Xi’an, China) and two HlugA180Su05 (Outdo biobank, Shanghai, China). Patient personal information was blocked and the study protocol was approved by the Ethics Committee of the Tongji Hospital of Huazhong University of Science and Technology. BC041115c includes 10 cases of normal lung tissues, 4 cases of lung atypical carcinoid tissues, 48 cases of ADC, 40 cases of SQC, 8 cases of small cell carcinoma and 3 cases of large cell carcinoma. HlugA180Su05 includes 94 cases of ADC with 87 matched adjacent lung tissues, with survival follow-up data covering 5–10 years.
Immunohistochemical staining quantification analysis
Immunohistochemical staining was carried out with the three TMAs using a two-step standard protocol by the Bios Biotech.Citation9,Citation10 A polyclonal anti-ECT2 antibody (catalog no. 07–1364; Millipore Corporation, Billerica, MA, USA, 1:150) and an anti-PCNA antibody (catalog no. ab18197; Abcam, Cambridge, UK, 1:1500) were utilized for the immunohistochemistry. Immunohistochemical scoring was assessed by two experienced pathologists without clinicopathological information of the patients according to the Fromowitz Standard.Citation11 The product of intensity and the proportion of positively stained cancer cells in each whole tissue sample was used to represent the protein levels of ECT2. The staining intensity was scored as 0 (no staining), 1 (weak staining, light yellow), 2 (moderate staining, yellow brown) and 3 (strong staining, brown). The proportions of stained tumor cells were identified as 1 (0%–25% positive cells), 2 (26%–50% positive cells), 3 (51%–75% positive cells) and 4 (76%–100% positive cells).Citation12
Meta-analysis of the expression of ECT2 using published gene expression omnibus (GEO) databases
We carried out a comprehensive search of relevant GEO databases to assess the mRNA expression of ECT2 through ArrayExpress and Oncomine, as previously described.Citation13,Citation14 The dataset met the following criteria: 1) the dataset concerned human NSCLC; 2) the mRNA expression of ECT2 was measured in the dataset; 3) the clinical outcomes of patients were shown in the dataset; 4) the sample capacity was more than 50; 5) only the latest and most complete datasets were included when several databases shared common patients. A total of 21 independent NSCLC microarray databases were enrolled in this systematic analysis (). Statistical analysis was performed based on the guidelines of meta-analysis of observational studies. The Stata software package (version 12.0) was employed to perform the meta-analysis.
Table 1 Microarray databases detailing the mRNA expression of ECT2 (these databases were included in the meta-analysis)
Survival analysis based on immunohistochemical scoring
Based on the immunohistochemical scoring for 94 ADC patients, an overall survival curve was constructed using SPSS and univariate analyses were conducted through Cox regression, which yielded an HR and 95% CI. The cutoff value for ECT2 was the median expression.
The correlation analysis of ECT2 and PCNA
The immunohistochemical (IHC) scores for ECT2 and PCNA for the same tissue arrays (HlugA180Su05) were analyzed to evaluate the correlation between ECT2 and PCNA protein expression. Two public GEO databases, GSE4342Citation15 and GSE32474,Citation16 consisting of NSCLC cell lines, and three databases, GSE31210,Citation38 GSE68465Citation46 and GSE30219,Citation37 containing the highest number of NSCLC patients of the 21 databases, were analyzed to evaluate the correlation between the mRNA expression of ECT2 and PCNA.
Statistical analysis
Expression analysis and correlation analyses were calculated using GraphPad Prism 5.0 and SPSS 20 statistical software. The difference between groups was evaluated using Student’s t-test and one-way analysis of variance (ANOVA). A two-tailed P-value <0.05 was considered statistically significant.
Results
ECT2 expression was significantly increased in various subtypes of lung cancer compared with normal lung tissues
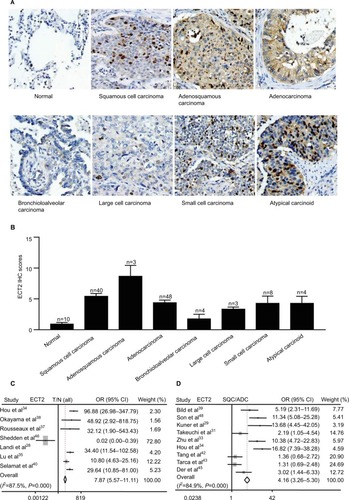
We compared ECT2 expression in several subtypes of lung cancer and normal lung tissues through IHC staining and representative images of the IHC staining are shown in . The average score for normal, SQC, adenosquamous carcinoma, ADC, bronchioloalveolar carcinoma, large cell carcinoma, small cell carcinoma and atypical carcinoid was 0.90±0.28, 5.43±0.46, 8.67±1.76, 4.38±0.44, 1.75±0.75, 3.33±0.33, 4.25±1.10 and 4.25±1.82, respectively (). The average scores for all lung cancer subtypes were 4–5 fold higher than those of normal samples, and the adenosquamous carcinoma samples exhibited the highest abundance of ECT2 compared with the other lung cancer subtypes (). The results also showed that ECT2 expression was higher in SQC than in ADC tissues, but the difference was not statistically significant (P=0.1029). The correlation between ECT2 protein expression in TMAs and the clinicopathological features of 202 lung cancer patients is shown in . A meta-analysis indicated that expression of ECT2 mRNA in NSCLC tissue was higher than in normal tissue (pooled odds ratio [OR] =7.87, 95% CI: 5.57–11.11, P=0.000, and I2=87.5%) (). Furthermore, we investigated the difference in ECT2 mRNA expression between ADC and SQC and found that the ECT2 mRNA expression of SQC was higher than that of ADC (pooled OR =4.16, 95% CI: 3.26–5.30, P=0.000, and I2=84.9%) ().
Table 2 Correlation between ECT2 expression and the clinicopathological features of 202 lung cancer patients on TMAs (BC041115c and HlugA180Su05)
Figure 1 ECT2 was enriched in various subtypes of lung cancer.
Notes: (A) Representative images of IHC staining of normal, squamous cell carcinoma, adenosquamous carcinoma, adenocarcinoma, bronchioloalveolar carcinoma, large cell carcinoma, small cell carcinoma, and atypical carcinoid; (B) quantitative IHC scores of ECT2 in various lung cancer subtypes; (C) meta-analysis of ECT2 mRNA expression in tumors vs normal; (D) meta-analysis of ECT2 mRNA expression in SQC vs ADC.
Abbreviations: ECT2, epithelial cell transforming sequence 2; IHC, immunohistochemical; T, tumor; N, normal; OR, odds ratio; ADC, adenocarcinoma; SQC, squamous cell lung cancer.
The expression level of ECT2 was associated with cancer progression and prognosis in NSCLC
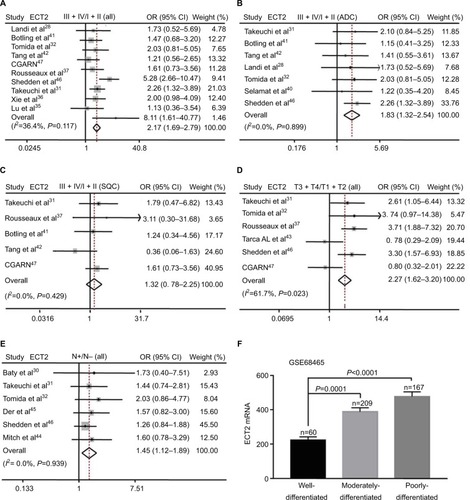
Based on the immunohistochemical scoring of the Hlu-gA180Su05 and BC041115c tissue microarrays, we found the immunohistochemical scores of tumor tissues were significantly higher than those of matched adjacent tissues (P<0.0001) (). Moreover, we compared the protein level of ECT2 in lung cancer tissues with clinical-pathological parameters. The protein level of ECT2 in lung cancer was significantly and positively correlated with clinicopathological parameters including TNM stage, tumor cell differentiation, tumor size, and lymph node metastasis (). We also used a meta-analysis to examine the relationship between the mRNA level of ECT2 and clinical-pathological characteristics. The patients were divided into ECT2 high and low subgroups based on the median ECT2 mRNA expression values. The level of ECT2 mRNA expression in patients with stage III and IV NSCLC was higher than in patients with stage I and II NSCLC (pooled OR =2.17, 95% CI: 1.69–2.79, P=0.117, and I2=36.4%) (). Meanwhile, the level of ECT2 mRNA expression in ADC patients showed a similar trend and the patients with stage III and IV was higher than patients with stage I and II (pooled OR =1.83, 95% CI: 1.32–2.54, P=0.899, and I2=0.0%) (). The ECT2 mRNA expression in stage III and IV NSCLC was higher compared with stage I and II NSCLC in SQC, but the difference was not statistically significant (pooled OR =1.32, 95% CI: 0.78–2.25, P=0.429, and I2=0.0%) (). The ECT2 mRNA expression of T3 and T4 was higher compared with T1 and T2 in NSCLC (pooled OR =2.27, 95% CI: 1.62–3.20, P=0.023, and I2=61.7%) (). The ECT2 mRNA expression of lymph node-positive patients was higher than that of lymph node-negative patients in NSCLC (pooled OR =1.45, 95% CI: 1.12–1.89, P=0.939, and I2=0.0%) (). Because the clusters with histological differentiation information were poor, we used GSE68465 to test the ECT2 mRNA expression in patients with different degrees of cell differentiation. The results showed that the ECT2 mRNA expression of the poorly differentiated group was remarkably higher than that in the well differentiated group (P<0.0001) and that of the moderately differentiated group was also higher than that of the well differentiated group (P=0.0001) (). In summary, the protein and mRNA expression of ECT2 were correlated with clinical-pathological characteristics in NSCLC.
Figure 2 Protein level of ECT2 was associated with cancer progression and prognosis.
Notes: (A) Representative images and IHC scores of ECT2 in tumor vs matched adjacent tissue; (B) various stages; (C) various degrees of tumor cell differentiation; (D) various tumor sizes; (E) lymph node positive vs lymph node negative. N−, lymph node negative; N+, lymph node positive.
Abbreviations: ECT2, epithelial cell transforming sequence 2; IHC, immunohistochemical.
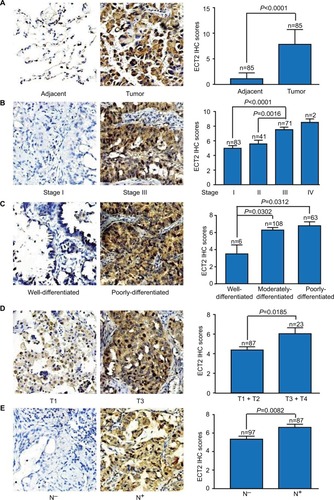
Figure 3 mRNA level of ECT2 was associated with cancer progression and prognosis.
Notes: (A) Meta-analysis of ECT2 mRNA expression at stage III + IV vs I + II; (B) stage III + IV vs I + II in ADC; (C) stage III + IV vs I + II in SQC; (D) tumor size T3 + T4 vs. T1 + T2; (E) lymph node positive vs lymph node negative; (F) the mRNA expression of ECT2 at different degrees of tumor cell differentiation in GSE68465. N−, lymph node negative; N+, lymph node positive.
Abbreviations: ECT2, epithelial cell transforming sequence 2; IHC, immunohistochemical staining; CGARN, Cancer Genome Atlas Research Network; OR, odds ratio; ADC, adenocarcinoma; SQC, squamous cell lung cancer.
High ECT2 expression predicted poor survival in NSCLC
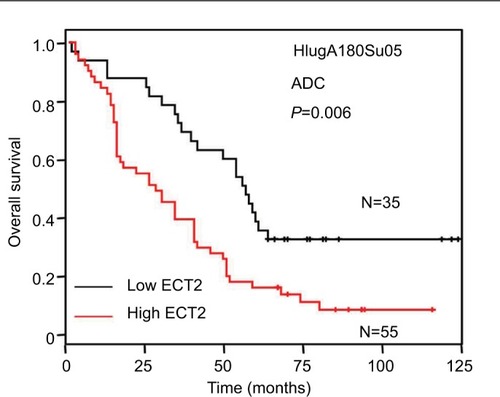
To evaluate the prognostic value of ECT2 in NSCLC, we first investigated the association between ECT2 protein expression and overall survival using a Cox univariate regression analysis. A TMA consisting of 94 ADC patients was divided into ECT2 high and low subgroups following the immunohistochemical staining score of 3–4 vs 1–2. The median overall survival (OS) time of the ECT2 high group was 29±5.561 months, while that of the low group was 56±3.548 months (P=0.006) (). A Cox univariate regression analysis between the cumulative overall survival rates and clinicopathological factors demonstrated that ECT2 expression (HR =2.010, 95% CI: 1.204–3.355, P=0.008), lymph node metastasis (HR =2.672, 95% CI: 1.541–4.633, P=0.000) and TNM stage (HR =2.658, 95% CI: 1.483–4.765, P=0.001) were prognostic factors for overall survival in ADC patients. We performed a forward variable-selection procedure and found the ECT2 expression was a statistically significant independent prognostic factor for the OS of ADC patients (HR =0.406, 95% CI: 0.226–0.727, P=0.002) ().
Table 3 ECT2 expression in ADC is an independent prognostic factor for ADC patients (HlugA180Su05)
Figure 4 Overexpression of ECT2 protein predicted poor survival.
Notes: Kaplan–Meier curve of patients with low or high ECT2 expression in ADC. Median level of IHC scores was used to divide patients into subgroups;
Abbreviations: ECT2, epithelial cell transforming sequence 2; HR, hazard ratio; ADC, adenocarcinoma; IHC, immunohistochemical staining.
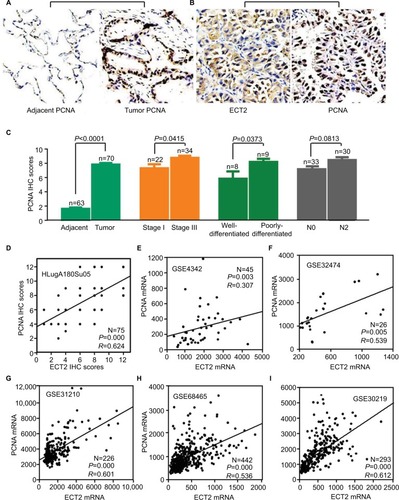
ECT2 expression was correlated with that of PCNA
Based on the immunohistochemical scoring for PCNA, we found that the protein levels of PCNA in ADC were significantly higher than those in matched adjacent normal lung tissue (P<0.0001), and they were positively correlated with clinicopathological parameters including TNM stage, tumor cell differentiation, tumor size, and metastasis (). An immunohistochemical analysis of PCNA and ECT2 for the same tissue microarray (HlugA180Su05) showed that ECT2 protein expression was positively correlated with that of PCNA (R=0.624, P=0.000) (). Public datasets GSE4342, GSE32474, GSE31210, GSE68465 and GSE30219 containing 45 NSCLC cell lines, 26 NSCLC cell lines, 226 patients, 442 patients and 293 patients, respectively, were interrogated to assess the association between ECT2 and PCNA. The results showed that ECT2 mRNA expression was positively correlated with that of PCNA in GSE4342 (R=0.307, P=0.003) (), GSE32474 (R=0.539, P=0.005) (), GSE31210 (R=0.601, P=0.000) (), GSE68465 (R=0.536, P=0.000) () and GSE30219 (R=0.612, P=0.000) ().
Figure 5 ECT2 expression correlated with PCNA expression.
Notes: (A) Representative images of IHC staining of PCNA; (B) representative images of IHC staining of PCNA and ECT2 in the same lung cancer tissues; (C) IHC scores of PCNA in lung cancer; (D) the correlation between ECT2 and PCNA based on protein expression; (E) based on the mRNA level of the GSE4342 cell line; (F) GSE32474 cell line; (G) GSE31210 cell line; (H) GSE68465 cell line; (I) GSE30219 cell line. N−, lymph node negative; N+, lymph node positive.
Abbreviations: IHC, immunohistochemical staining; PCNA, proliferating cell nuclear antigen; ECT2, epithelial cell transforming sequence 2; HR, hazard ratio; ADC, adenocarcinoma; SQC, squamous cell lung cancer.
Discussion
Recent targeted therapies of driver genes have achieved surprising outcomes in lung cancer.Citation17 However, only a small fraction of patients can benefit from precision medicine. Searching for new biomarkers is still a key subject for lung cancer research. Besides the well-characterized oncogenes RAS, epidermal growth factor receptor (EGFR), and MET, and the tumor suppressor gene p53, several novel genes or pathways have been identified as being involved in the malignant behavior of lung cancer and its prognosis, such as dachshund family transcription factor 1 (DACH1)-SIX homeobox 1 (SIX1) and kelch like ECH associated protein 1 (KEAP1) /nuclear factor, erythroid 2 like 2 (NRF2) signals.Citation18–Citation23 With the identification of more driving genes and biomarkers, precise treatment options for individual patients based on the distinction of morphological and molecular features is expected.
ECT2 is a guanine nucleotide exchange factor for the Rho family of GTPases (Rho, Cdc42 and Rac), and was originally identified as a gene that can transform mouse fibroblasts.Citation24 ECT2 is an important link between the cell cycle machinery and Rho signaling pathways involved in the regulation of cell division, and the exchange function relies on its phosphorylation during G2 and M phases.Citation3 Our data show that ECT2 expression in various lung cancer subtypes is significantly higher than that in normal tissues and its expression was associated with TNM stage, tumor cell differentiation, tumor size and metastasis, indicating that ECT2 plays an important role in the initiation and progression of lung cancer. We also investigated the relationship between ECT2 protein and mRNA expression and survival. A multivariate Cox regression analysis demonstrated that ECT2 overexpression in ADC was an independent prognostic factor. The current study revealed that ECT2 was a key factor in the progression of NSCLC and predicted poor prognosis. The high expression of ECT2 was related to the proliferation, survival and invasion of lung cancer cells, which contributed to the prognosis of NSCLC. These results are in agreement with those of prior studies of the role of ECT2 in breast cancer, osteosarcoma, gastric cancer and glioma.Citation4–Citation7
We also examined the expression of PCNA in ADC and found that it was positively correlated with clinicopathological parameters including TNM stage, tumor cell differentiation, tumor size, and metastasis, supporting the previous study showing that PCNA is expressed in proliferating cells, and is an important factor for the initiation of cell proliferation.Citation25,Citation26 Until now, no studies have reported a correlation between ECT2 and PCNA. In the current study, we demonstrated the ECT2 expression is positively correlated with PCNA expression in ADC at both the protein and mRNA level, suggesting that ECT2 is an important factor in the regulation of NSCLC cell division. The expression level of ECT2 may be a useful biomarker to predict proliferation and aggression in NSCLC. Moreover, high ECT2 expression predicts a shorter survival time, indicating that ECT2 expression may serve as a prognostic marker for NSCLC patients.
As a common GEF for the Rho GTPase family, ECT2 can catalyze guanine nucleotide exchange on RhoA, Rac1, and Cdc42 in vitro.Citation3,Citation27 Therefore, gene therapy to abolish ECT2 activity may restrain the Rac1/RhoA/Cdc42 signaling pathways, which may provide an effective approach to block Rho GTPase activity and reverse a malignant phenotype.
One interesting finding is that ECT2 expression in SQC is higher than that in ADC, but ECT2 levels did not significantly affect the OS of SQC cancer patients, suggesting that ECT2 may play a different function in ADC compared with SQC. Therefore, further study of the molecular mechanism of ECT2 in ADC and SQC should provide valuable information. In addition, immunohistochemical staining of lung tissue specimens indicated that ECT2 is expressed both in the cytoplasm and nucleus of lung cancer cells, while ECT2 is only weakly expressed in the nucleus of healthy lung tissue, which supports previous findings that ECT2 is mislocalized to the cytoplasm to activate Rac1 for transformed growth.Citation8 Therefore exploring the transport of the ECT2 protein from the nucleus to the cytoplasm and blocking the translocation process of ECT2 may have potential therapeutic value.
Conclusion
This study demonstrated that ECT2 expression in various lung cancer subtypes is significantly higher than in normal tissues and its expression was positively related to TNM stage, tumor cell differentiation, tumor size, and metastasis in NSCLC. In the current study, we have reported for the first time that the expression of ECT2 is positively correlated with that of PCNA in lung cancer at the protein and mRNA level. ECT2 overexpression is an unfavorable prognostic factor predicting poor disease-free survival and overall survival for NSCLC patients, especially in ADC, and may serve as a potential prognostic indicator and biomarker for NSCLC patients.
Acknowledgments
This study was supported by the National Natural Science Foundation of China (grant No. 81572608, 81172422, and 81874120) and the Wuhan Science and Technology Bureau (grant No. 2017060201010170).
Supplementary materials
Figure S1 Overexpression of ECT2 mRNA predicted poor survival.
Notes: Kaplan–Meier curve of patients with low or high ECT2 expression. Median of mRNA expression was used to divide patients into subgroups. (A) Overall survival; (B) progression-free survival; (C) overall survival in ADC; (D) progression-free survival in ADC; (E) overall survival in SQC; (F) progression-free survival in SQC.
Abbreviations: ECT2, epithelial cell transforming sequence; HR, hazard ratio; ADC, adenocarcinoma; SQC, squamous cell lung cancer.
Author contributions
XB carried out the experiments and drafted the manuscript. MY, SY and XX participated in data collection, analysis and IHC scoring; XZ and KW designed the study, evaluated the results, and revised the manuscript. All authors contributed toward data analysis, drafting and critically revising the paper and agree to be accountable for all aspects of the work.
Disclosure
The authors report no conflicts of interest in this work.
References
- SiegelRLMillerKDJemalACancer statistics, 2017CA Cancer J Clin201767173028055103
- JustilienVAliSAJamiesonLEct2-dependent rRNA synthesis is required for KRAS-TRP53-driven lung adenocarcinomaCancer Cell201731225626928110998
- TatsumotoTXieXBlumenthalROkamotoIMikiTHuman ECT2 is an exchange factor for Rho GTPases, phosphorylated in G2/M phases, and involved in cytokinesisJ Cell Biol1999147592192810579713
- WangHKLiangJFZhengHXXiaoHExpression and prognostic significance of ECT2 in invasive breast cancerJ Clin Pathol201871544244529051317
- ChenZLiuJZhangYRole of epithelial cell transforming sequence 2 (ECT2) in predicting prognosis of osteosarcomaMed Sci Monit2017233861386828794404
- JinYYuYShaoQUp-regulation of ECT2 is associated with poor prognosis in gastric cancer patientsInt J Clin Exp Pathol20147128724873125674238
- SanoMGenkaiNYajimaNExpression level of ECT2 proto-oncogene correlates with prognosis in glioma patientsOncol Rep20061651093109817016598
- JustilienVFieldsAPEct2 links the PKCiota-Par6alpha complex to Rac1 activation and cellular transformationOncogene200928413597360719617897
- XuHWuKTianYCD44 correlates with clinicopathological characteristics and is upregulated by EGFR in breast cancerInt J Oncol20164941343135027499099
- ChuQHanNYuanXDACH1 inhibits cyclin D1 expression, cellular proliferation and tumor growth of renal cancer cellsJ Hematol Oncol201477325322986
- FromowitzFBViolaMVChaoSras p21 expression in the progression of breast cancerHum Pathol19871812126812753315956
- WuKYuSLiuQBaiXZhengXWuKThe clinical significance of CXCL5 in non-small cell lung cancerOnco Targets Ther2017105561557329200871
- XuHXWuKJTianYJHxXKjWExpression profile of SIX family members correlates with clinic-pathological features and prognosis of breast cancer: a systematic review and meta-analysisMedicine20169527e408527399099
- LiuQLiATianYThe expression profile and clinic significance of the SIX family in non-small cell lung cancerJ Hematol Oncol20169111927821176
- ColdrenCDHelfrichBAWittaSEBaseline gene expression predicts sensitivity to gefitinib in non-small cell lung cancer cell linesMol Cancer Res20064852152816877703
- PfisterTDReinholdWCAgamaKTopoisomerase I levels in the NCI-60 cancer cell line panel determined by validated ELISA and microarray analysis and correlation with indenoisoquinoline sensitivityMol Cancer Ther2009871878188419584232
- PolitiKHerbstRSLung cancer in the era of precision medicineClin Cancer Res201521102213222025979927
- LiuQYuSZhaoWQinSChuQWuKEGFR-TKIs resistance via EGFR-independent signaling pathwaysMol Cancer20181715329455669
- GovindanRDingLGriffithMGenomic landscape of non-small cell lung cancer in smokers and never-smokersCell201215061121113422980976
- LiuQLiAYuSTianYDACH1 antagonizes CXCL8 to repress tumorigenesis of lung adenocarcinoma and improve prognosisJ Hematol Oncol20181115329636079
- MimaeTOkadaMHagiyamaMUpregulation of notch2 and six1 is associated with progression of early-stage lung adenocarcinoma and a more aggressive phenotype at advanced stagesClin Cancer Res201218494595522190591
- RomeroRSayinVIDavidsonSMKeap1 loss promotes Kras-driven lung cancer and results in dependence on glutaminolysisNat Med201723111362136828967920
- TianYLiuQHeXEmerging roles of Nrf2 signal in non-small cell lung cancerJ Hematol Oncol201691426922479
- MikiTSmithCLLongJEEvaAFlemingTPOncogene ect2 is related to regulators of small GTP-binding proteinsNature199336264194624658464478
- GuoJLGuSQLiYZhangXYEvaluation of clinical significance of endoglin expression during breast cancer and its correlation with ER and PCNAEur Rev Med Pharmacol Sci201721235402540729243782
- MalkasLHHerbertBSAbdel-AzizWA cancer-associated PCNA expressed in breast cancer has implications as a potential biomarkerProc Natl Acad Sci U S A200610351194721947717159154
- MansourMHauptSChanALThe E3-ligase E6AP represses breast cancer metastasis via regulation of ECT2-rho signalingCancer Res201676144236424827231202
- LandiMTDrachevaTRotunnoMGene expression signature of cigarette smoking and its role in lung adenocarcinoma development and survivalPLoS One200832e165118297132
- KunerRMuleyTMeisterMGlobal gene expression analysis reveals specific patterns of cell junctions in non-small cell lung cancer subtypesLung Cancer2009631323818486272
- BatyFFacompréMKaiserSGene profiling of clinical routine biopsies and prediction of survival in non-small cell lung cancerAm J Respir Crit Care Med2010181218118819833826
- TakeuchiTMinamiYIijimaTCharacteristics of loss of heterozygosity in large cell neuroendocrine carcinomas of the lung and small cell lung carcinomasPathol Int200656843443916872437
- TomidaSTakeuchiTShimadaYRelapse-related molecular signature in lung adenocarcinomas identifies patients with dismal prognosisJ Clin Oncol200927172793279919414676
- ZhuCQDingKStrumpfDPrognostic and predictive gene signature for adjuvant chemotherapy in resected non-small-cell lung cancerJ Clin Oncol201028294417442420823422
- HouJAertsJden HamerBGene expression-based classification of non-small cell lung carcinomas and survival predictionPLoS One201054e1031220421987
- LuTPTsaiMHLeeJMIdentification of a novel biomarker, SEMA5A, for non-small cell lung carcinoma in nonsmoking womenCancer Epidemiol Biomarkers Prev201019102590259720802022
- XieYXiaoGCoombesKRRobust gene expression signature from formalin-fixed paraffin-embedded samples predicts prognosis of non-small-cell lung cancer patientsClin Cancer Res201117175705571421742808
- RousseauxSDebernardiAJacquiauBEctopic activation of germline and placental genes identifies aggressive metastasis-prone lung cancersSci Transl Med20135186186ra166
- OkayamaHKohnoTIshiiYIdentification of genes upregulated in ALK-positive and EGFR/KRAS/ALK-negative lung adenocarcinomasCancer Res201272110011122080568
- BildAHYaoGChangJTOncogenic pathway signatures in human cancers as a guide to targeted therapiesNature2006439707435335716273092
- SelamatSAChungBSGirardLGenome-scale analysis of DNA methylation in lung adenocarcinoma and integration with mRNA expressionGenome Res20122271197121122613842
- BotlingJEdlundKLohrMBiomarker discovery in non-small cell lung cancer: integrating gene expression profiling, meta-analysis, and tissue microarray validationClin Cancer Res201319119420423032747
- TangHXiaoGBehrensCA 12-gene set predicts survival benefits from adjuvant chemotherapy in non-small cell lung cancer patientsClin Cancer Res20131961577158623357979
- TarcaALLauriaMUngerMStrengths and limitations of micro-array-based phenotype prediction: lessons learned from the IMPROVER Diagnostic Signature ChallengeBioinformatics201329222892289923966112
- RaponiMZhangYYuJGene expression signatures for predicting prognosis of squamous cell and adenocarcinomas of the lungCancer Res200666157466747216885343
- DerSDSykesJPintilieMValidation of a histology-independent prognostic gene signature for early-stage, non-small-cell lung cancer including stage IA patientsJ Thorac Oncol201491596424305008
- Director’s Challenge Consortium for the Molecular Classification of Lung AdenocarcinomaSheddenKTaylorJMGene expression-based survival prediction in lung adenocarcinoma: a multi-site, blinded validation studyNat Med200814882282718641660
- Cancer Genome Atlas Research NetworkComprehensive genomic characterization of squamous cell lung cancersNature2012489741751952522960745
- LeeESSonDSKimSHPrediction of recurrence-free survival in postoperative non-small cell lung cancer patients by using an integrated model of clinical information and gene expressionClin Cancer Res200814227397740419010856