
Abstract
Introduction
Although remarkable progress has been made to determine the prognosis of patients with colorectal cancer (CRC), it is inadequate to identify the subset of high-risk TNM stage II and stage III patients that have a high potential of developing tumor recurrence and may experience death. In this study, we aimed to develop biomarkers as a prognostic signature for the clinical outcome of CRC patients with stage II and stage III.
Materials and methods
We performed a systematic and comprehensive discovery step to identify recurrence-associated genes in CRC patients through publicly available GSE41258 (n=253) and GSE17536 (n=107) datasets. We subsequently determined the prognostic relevance of candidate genes in stage II and III patients and developed a triple-biomarker for predicting RFS in GSE17536, which was later validated in an independent cohort GSE33113 dataset (n=90).
Results
Based upon mRNA expression profiling studies, we identified 45 genes which differentially expressed in recurrent vs non-recurrent CRC patients. By using Cox proportional hazard models, we then developed a triple-marker model (THBS2, SERPINE1, and FN1) to predict prognosis in GSE17536, which successfully identified poor prognosis in stage II and stage III, particularly high-risk stage II CRC patients.
Discussion
Notably, we found that our triple-marker model once again predicted recurrence in stage II patients in GSE33113. Kaplan–Meier survival analysis demonstrated that patients with high scores have a poor outcome compared to those with low scores. Our triple-marker model is a reliable predictive tool for determining prognosis in CRC patients with stage II and stage III, and might be able to identify high-risk patients that are candidates for more targeted personalized clinical management and surveillance.
Introduction
Colorectal cancer (CRC) is the third most common cancer worldwide. Despite 60% of TNM stage II and stage III patients presenting with a resectable disease at the time of diagnosis, ~50% of such patients who undergo curative surgery or 20% who are treated post-surgically with adjuvant chemotherapy, eventually relapse and experience a metastatic disease.Citation1–Citation3 This clinical challenge indicates the current TNM staging system is inadequate at predicting the risk for tumor recurrence, leading to potential under or over-treatment of a subset of patients with colorectal cancer.
Currently, 5-fluorouracil (5FU)-based adjuvant chemotherapy remains regular treatment for stage III CRC patients and some high risk stage II CRC patients, which improves survival rates bŷ20%.Citation4,Citation5 For stage III patients, 30%–40% of patients do not experience recurrence in 5 years even when left untreated, while about 40% patients with adjuvant treatment still suffered from relapse and eventually die, suggesting such subsets of patients need more intensive chemotherapy. On the other hand, for stage II patients, only patients who present with high-risk clinical features received adjuvant chemotherapy. Unfortunately, about 20% of clinical “low-risk” patients experience tumor recurrence.Citation6,Citation7 Collectively, these findings highlight an urgent need for better novel and robust prognostic biomarkers that can guide treatment decisions in CRC patients with stage II and stage III pathological progress.
The Gene Expression Omnibus (GEO) database is an international public repository that archives and freely distributes microarray, next-generation sequencing, and other forms of high-throughput functional genomics data submitted by the research community. By integrating the mRNA expression profile and clinical outcome, we can obtain novel prognostic biomarkers for stage II and stage III CRC patients. In this study, we performed a systematic and comprehensive identification of recurrence-specific genes that are differentially expressed in recurrent tumor and non-recurrent tumor, followed by determining their combinatorial efficiency in predicting recurrence free survival by analyzing their expression in multiple, independent cohorts of patients with CRC.
Materials and methods
Public datasets
We used the Affymetrix dataset which is publicly available in the GEO database with available clinical information as originally research.Citation8 The GSE41258 dataset consists of colorectal cancer patients with liver metastasis or lung metastasis.Citation9 The biological specimens we used in this study included liver metastasis (n=47), lung metastasis (n=20), and primary colon adenocarcinomas (n=186). The GSE17536 dataset included 177 patients with CRC disease collected at the Moffitt Cancer Center (Tampa, FL, USA), and it was used to define the molecular classification.Citation10,Citation11 Since our study focused on stage II and stage III patients, only such patients were selected (stage II n=52, stage III n=55). The GSE33113 dataset included a set of 90 American Joint Committee on Cancer (AJCC) stage II patients that underwent intentionally curative surgery in the Academic Medical Center (AMC) in Amsterdam, the Netherlands.Citation12 All the data contain complete clinical information for the differential gene expression and recurrence-free survival (RFS) analysis ().
Table 1 Clinicopathological characteristics of GEO datasets used in this study
Discovery of differentially expressed genes
The differentially expressed genes were defined as genes differentially expressed in lung metastasis and primary cancer tissues; liver metastasis and primary cancer tissues; recurrent tumors and non-recurrent tumors. All the comparisons were performed by GEO2R. GEO2R performs comparisons on original submitter-supplied processed data tables using the GEOquery and limma R packages from the Bioconductor project. The differentially expressed genes were determined by adjusted P<0.05 (Benjamini & Hochberg [false discovery rate]).
Pathway analysis
Enrichr pathway analysis was used for functional annotation of recurrence-associated genes.
Statistical analysis
All statistical analyses were performed using Medcalc version 12.3, or GraphPad Prism version 6.0. We conducted receiver operating characteristic (ROC) curves and calculated the area under the ROC curves (AUC) to evaluate the predictive power of candidate genes for prognosticating CRC patients. For the RFS analysis, we defined the probability that patients remained free of tumor recurrence as the first event. Data were analyzed from the date of surgery to the time of the first event or the date on which data were censored, according to the Kaplan–Meier method, and the curves were compared using the log-rank test. To develop a triple-marker and determining patient survival, we used Cox’s proportional hazard regression models and obtained a risk score derived from this prediction model. We categorized patients into high-score and low-score value groups based on the median cutoff value. All P-values were 2-sided, and those <0.05 were considered statistically significant.
Results
Identification of candidate genes for CRC recurrence
The metastatic spread of tumor cells is one of the most common causes of recurrence in colorectal cancer patients. Elucidation of specific gene expression pattern of metastatic colonies may provide useful insights into development of recurrence markers. GSE41258 dataset includes gene expression microarray data from primary colon adenocarcinomas, liver metastasis and lung metastasis tissues. To find metastatic-specific markers, we initially compared gene expression profile between primary cancer tissues and tissues from liver or lung metastatic sites as indicated in the flow chart of the study design (). Interestingly, lung metastasis vs primary comparison analysis revealed 7,084 differentially expressed genes (adjusted P-value <0.05), while liver metastasis vs primary comparison showed 10,502 differentially expressed genes (adjusted P-value <0.05). More importantly, we found 3,501 overlapping genes in both comparison groups, highlighting their important role in tumor metastasis and potential targets for recurrence prediction.
Figure 1 The flow chart of the analysis design in this study.
Abbreviations: CRC, colorectal cancer; AJCC, American Joint Committee on Cancer.
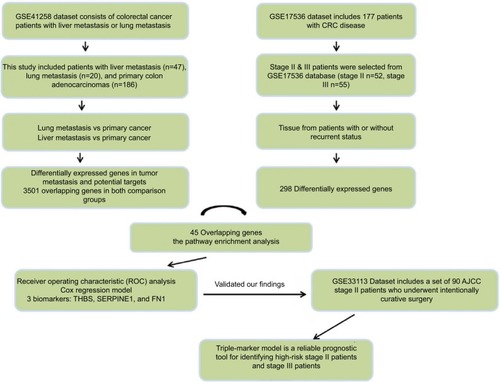
To confirm our assumption that these metastatic-specific markers could serve as recurrence prediction biomarkers, we enrolled a testing cohort (GSE17536) which only involved stage II and III patients. We compared gene expression profile in tissues from patients with or without recurrent status. The comparison analysis showed 298 differentially expressed genes (adjusted P-value <0.05), and 45 of these genes overlapped with the above metastatic-specific markers (). The pathway enrichment analysis showed the biological function of these genes is mainly involved in the inflammatory response,Citation13,Citation14 focal adhesion, epidermal growth factor (EGF)/epidermal growth factor receptor (EGFR) pathway, extracellular matrix (ECM), and membrane receptors, implying these genes might be important for recurrent colorectal tumors to acquire metastatic capacity (). In order to narrow down this list further, we thereafter selected the ten most differentially expressed genes (CYP1B1, ITGBL1, THBS2, VCAN, BGN, SERPINE1, ECM2, TWIST1, FN1, and CAV2) according to fold change which were significantly up-regulated in recurrent tumor compared to non-recurrent tumor (), implicating their potential relevance in determining the clinical outcome of stage II and III CRC patients.
Figure 2 Discovery of recurrence-associated genes.
Notes: (A) The 45 candidates overlapped with lung metastasis-specific genes and liver metastasis-specific genes. (B) Enrichr pathway analysis was used for functional annotation of recurrence-associated genes. (C) Heatmaps showed the top 10 differential genes between recurrent tumors and non-recurrent tumors in the GSE17536 dataset.

Development of a triple-biomarker model to predict RFS in stage II and III patients
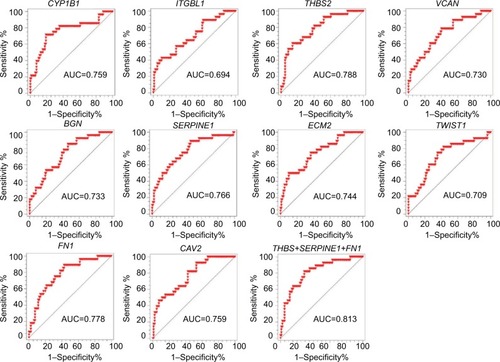
We subsequently performed ROC analysis of the top 10 candidates to evaluate the prediction accuracy of recurrent or non-recurrent CRC in the GSE17536 dataset. As shown in , each candidate showed good prediction power, with an AUC from 0.694 to 0.788. Moreover, we observed three genes THBS2, SERPINE1, and FN1 demonstrated higher AUC values compared to the other genes. Therefore, we aimed to combine these three biomarkers to improve the prediction ability. By using Cox regression method, we built a recurrence prediction model based on this triple-biomarker. As expected, our triple-marker model significantly improved prediction ability of individual genes (AUC=0.813; ). Importantly, the AUC value had no significant difference between three single genes, but all had significance when compared with the three gene biomarker panel (P<0.05).
Figure 3 The prediction power of individual genes and triple-marker for predicting tumor recurrence.
Notes: The ROC analysis was used for the discrimination between recurrence-free and recurrence or death cases.
Abbreviations: AUC, area under the ROC curve; ROC, Receiver operating characteristic.
Performance evaluation of the triple-biomarker model in the testing cohort
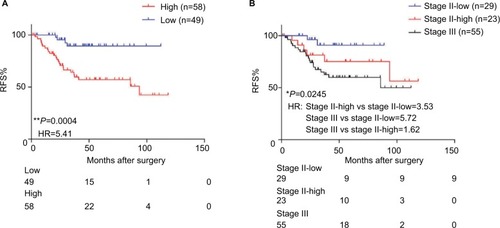
To test whether our triple-biomarker model could identify patients at high risk or low risk of poor outcomes, we calculated the risk-score of each patient based on Cox regression model. We divided patients into high-score and low-score groups based on the cutoff value (the median value of all patients’ risk scores). It is of note that the high-score group had a worse prognosis compared to patients in the low-risk group (HR=5.41, P=0.0004; ). As mentioned previously, it is of clinical relevance to identify patients at high risk for stage II. Accordingly, when we split stage II patients into low- and high-score groups, our triple-marker model clearly showed that stage II patients with higher vs lower risk score values had a poorer prognosis (HR=3.53, P=0.0245; ). Surprisingly, when we compared high-score stage II and stage III patients, the two groups yielded similar survival curves, suggesting our triple-marker is able to identify the high risk stage II group which has the same prognosis as the stage III group. Collectively, these results indicate that our newly developed triple-marker model could successfully segregate high- vs low-risk patients with stage II and stage III pathological progress.
Figure 4 The predictive performance of the triple-marker in GSE17536.
Notes: (A) The Kaplan–Meier analysis was used to estimate the prognosis of the low- and high-score groups in stage II and III patients. (B) Kaplan–Meier survival analysis was used to estimate low-score stage II, high-score stage II and stage III groups (*P<0.05; **P<0.01).
Abbreviations: RFS, recurrence-free survival; HR, hazard ratio; ROC, Receiver operating characteristic.
Independent validation of the triple-biomarker model to identify high-risk stage II patients
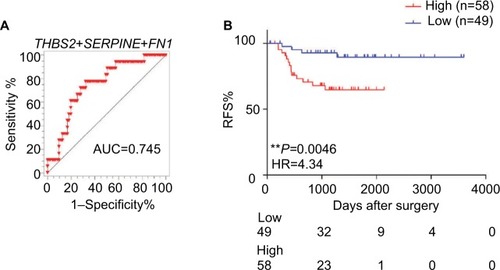
To further confirm the results obtained for the triple markers in the testing cohort, we validated our findings in another independent cohort of 107 stage II CRC patients. We also calculated the risk score of each patient based on this triple-maker regression model. We divided all the patients into low-and high-score groups according to the median cutoff value. Consistent with our previous results, we found that our triple markers once again showed good predictive performance in stage II patients (). Furthermore, the Kaplan–Meier survival analysis demonstrated that patients with high scores have poor outcome compared to those with low scores (HR=4.34, P=0.0046; ), highlighting that our triple-marker is indeed a promising and reliable prognostic tool for identifying high-risk stage II patients, which has important implications for their clinical management.
Figure 5 The predictive performance of the triple-marker in GSE33113.
Notes: (A) The ROC analysis was used for the discrimination between recurrence-free and recurrence or death cases. (B) Kaplan–Meier curve estimates the association of triple markers and the survival of patients. (*P<0.05; **P<0.01).
Abbreviations: RFS, recurrence-free survival; HR, hazard ratio.
Discussion
In this study, we have first performed a systematic discovery step, followed by development and validation of a novel triple-marker (THBS2, SERPINE1, and FN1) aimed at predicting potential clinical outcomes for stage II and stage III CRC patients. Through our logical discovery, test and validation step, we provide data that our triple markers could successfully identify risk in CRC patients, particularly stage II patients, with a good predictive performance.
Based on the GSE41258 dataset, we first identified metastatic-specific markers, finding 3,501 overlapping genes in both comparison groups (lung metastasis vs primary cancer and liver metastasis vs primary cancer), suggesting these genes may serve as recurrence biomarkers. By using a testing cohort (GSE17536), we found 45 genes, which overlapped with metastatic-specific markers, and are significantly up-regulated in tissues from recurrent patients. More importantly, these 45 genes were involved in metastasis-related processes such as inflammatory response, focal adhesion, EGF/EGFR pathway, ECM, and membrane receptors. To narrow down the candidates, we selected the top 10 most differentially expressed genes (CYP1B1, ITGBL1, THBS2, VCAN, BGN, SERPINE1, ECM2, TWIST1, FN1, and CAV2) according to fold change. When we evaluated the prediction power of each gene to discriminate recurrence and non-recurrence by ROC analysis, we found THBS2, SERPINE1, and FN1 showed the highest AUC values. Therefore, we selected these genes to constitute a triple-marker model to predict RFS in stage II and stage III patients.
The biological function of these identified genes selected for our triple-marker model has been investigated previously. Thrombospondins (THBS2) is a multifunction alglycoprotein released from various types of cell.Citation15 THBS2 contributes to carcinogenesis since THBS2 exerts its diverse biological effects such as angiogenesis, cell motility, apoptosis, cytoskeletal organization by binding with ECM proteins and cell surface receptors.Citation16–Citation19 Notably, THBS2 is known to activate transforming growth factor-β1 (TGF-β1) signaling, which promotes metastasis.Citation20 A recent study shows that overexpression of THBS2 correlated with poor OS and RFS in CRC patients, which is consistent with our results.Citation21 SERPINE1 expression has been shown to be associated with tumor cell migration and invasion through the activation of the PI3K-Akt pathway.Citation22–Citation24 Furthermore, SERPINE1 pro-migratory effect has been associated with LRP1 interaction, which in turn stimulates the Jak/Stat pathway.Citation25 SERPINE1 may also contribute to tumor aggressiveness by promoting tumor angiogenesis.Citation26,Citation27 FN1 has long been considered as an epithelial–mesenchymal transition (EMT) marker and is associated with angiogenesis and metastasis.Citation28,Citation29 Genes with lower AUC may significantly complement the model, however, we are more inclined to select biomarkers which are up-regulated in recurrent tumors compared to non-recurrent tumors such as THBS1, SERPINEE1, and FN1. Nonetheless, our triple makers play an important biological role in tumor metastasis, highlighting their clinical application in predicting recurrence in CRC patients.
We thereafter built a Cox regression model based on these triple markers. In GSE17536, our markers successfully showed high-score patients had a worse prognosis compared to patients in the low-risk group. Considering the clinical importance to identify high-risk stage II patients, we tested whether our triple markers could predict high-risk stage II patients. Accordingly, when we split stage II patients into low-and high-score groups based on our triple markers, our triple-marker clearly showed that stage II patients with higher- vs lower-risk score values had a poor prognosis. Notably, the high risk stage II patients and stage III patients yielded similar survival curves. To further confirm the results obtained for the triple markers in the testing cohort, we validated our findings in another independent cohort of 107 stage II CRC patients. In agreement with our earlier studies, patients with high scores had poor outcomes compared to those with low scores, suggesting our triple-marker is a reliable prognostic tool for identifying high-risk stage II patients, which has important implications for their clinical management.
Limitations
In regard to potential limitations, our current study is retrospective in nature, and our results must be validated in future, prospective, multi-center clinical trials. In addition, some of the clinical parameters such as vascular invasion or number of analyzed lymph nodes were not recorded or evaluated in GEO datasets, which may be easier to address in a future well-defined patient cohort.
Conclusion
We provide compelling evidence that our newly developed triple-marker model can effectively stratify stage II and III CRC patients into high- and low-risk groups based upon clinical outcomes, thereby adding significant prognostic value to the currently used clinicopathological risk factors used for such purposes. If validated in future studies, such a triple-marker model potentially offers tremendous clinical value in directing personalized treatment regimens and clinical management of patients with stage II and III CRC.
Disclosure
The authors report no conflicts of interest in this work.
References
- ObrandDIGordonPHIncidence and patterns of recurrence following curative resection for colorectal carcinomaDis Colon Rectum199740115249102255
- O’ConnellMJCampbellMEGoldbergRMSurvival following recurrence in stage II and III colon cancer: findings from the ACCENT data setJ Clin Oncol200826142336234118467725
- AndréTBoniCNavarroMImproved overall survival with oxaliplatin, fluorouracil, and leucovorin as adjuvant treatment in stage II or III colon cancer in the MOSAIC trialJ Clin Oncol200927193109311619451431
- GrahamJSCassidyJAdjuvant therapy in colon cancerExpert Rev Anticancer Ther20121219910922149436
- CarethersJMSystemic treatment of advanced colorectal cancer: tailoring therapy to the tumorTherap Adv Gastroenterol2008113342
- AndréTBoniCMounedji-BoudiafLOxaliplatin, fluorouracil, and leucovorin as adjuvant treatment for colon cancerN Engl J Med2004350232343235115175436
- KueblerJPWieandHSO’ConnellMJOxaliplatin combined with weekly bolus fluorouracil and leucovorin as surgical adjuvant chemotherapy for stage II and III colon cancer: results from NSABP C-07J Clin Oncol200725162198220417470851
- BarrettTTroupDBWilhiteSENCBI GEO: mining tens of millions of expression profiles—database and tools updateNucleic Acids Res200735Database issueD760D76517099226
- ShefferMBacolodMDZukOAssociation of survival and disease progression with chromosomal instability: a genomic exploration of colorectal cancerProc Natl Acad Sci U S A2009106177131713619359472
- SmithJJDeaneNGWuFExperimentally derived metastasis gene expression profile predicts recurrence and death in patients with colon cancerGastroenterology2010138395896819914252
- FreemanTJSmithJJChenXSmad4-mediated signaling inhibits intestinal neoplasia by inhibiting expression of β-cateninGastroenterology20121423e562e571
- KemperKVerslootMCameronKMutations in the Ras-Raf axis underlie the prognostic value of CD133 in colorectal cancerClin Cancer Res201218113132314122496204
- ChenEYTanCMKouYEnrichr: interactive and collaborative HTML5 gene list enrichment analysis toolBMC Bioinformatics20131412823586463
- KuleshovMVJonesMRRouillardADEnrichr: a comprehensive gene set enrichment analysis web server 2016 updateNucleic Acids Res201644W1W90W9727141961
- AdamsJCLawlerJThe thrombospondinsInt J Biochem Cell Biol200436696196815094109
- Iruela-ArispeMLLuqueALeeNThrombospondin modules and angiogenesisInt J Biochem Cell Biol20043661070107815094121
- RisherWCErogluCThrombospondins as key regulators of synaptogenesis in the central nervous systemMatrix Biol201231317017722285841
- BornsteinPThrombospondins function as regulators of angiogenesisJ Cell Commun Signal200933–418920019798599
- ZuborPHatokJMoricovaPGene expression abnormalities in histologically normal breast epithelium from patients with luminal type of breast cancerMol Biol Rep201542597798825407308
- CheonDJTongYSimMSA collagen-remodeling gene signature regulated by TGF-β signaling is associated with metastasis and poor survival in serous ovarian cancerClin Cancer Res201420371172324218511
- QianZZhangGSongGIntegrated analysis of genes associated with poor prognosis of patients with colorectal cancer liver metastasisOncotarget2017815255002551228424419
- PavónMAArroyo-SoleraITéllez-GabrielMEnhanced cell migration and apoptosis resistance may underlie the association between high SERPINE1 expression and poor outcome in head and neck carcinoma patientsOncotarget2015630290162903326359694
- BalsaraRDCastellinoFJPloplisVAA novel function of plasminogen activator inhibitor-1 in modulation of the AKT pathway in wild-type and plasminogen activator inhibitor-1-deficient endothelial cellsJ Biol Chem200628132225272253616785241
- LangloisBPerrotGSchneiderCLRP-1 promotes cancer cell invasion by supporting ERK and inhibiting JNK signaling pathwaysPLoS One201057e1158420644732
- DegryseBNeelsJGCzekayRPAertgeertsKKamikuboYLoskutoffDJThe low density lipoprotein receptor-related protein is a motogenic receptor for plasminogen activator inhibitor-1J Biol Chem200427921225952260415001579
- BajouKNoëlAGerardRDAbsence of host plasminogen activator inhibitor 1 prevents cancer invasion and vascularizationNat Med1998489239289701244
- BajouKPengHLaugWEPlasminogen activator inhibitor-1 protects endothelial cells from FasL-mediated apoptosisCancer Cell200814432433418835034
- SponzielloMRosignoloFCelanoMFibronectin-1 expression is increased in aggressive thyroid cancer and favors the migration and invasion of cancer cellsMol Cell Endocrinol201643112313227173027
- SoikkeliJPodlaszPYinMMetastatic outgrowth encompasses COL-I, FN1, and POSTN up-regulation and assembly to fibrillar networks regulating cell adhesion, migration, and growthAm J Pathol2010177138740320489157