
 ?Mathematical formulae have been encoded as MathML and are displayed in this HTML version using MathJax in order to improve their display. Uncheck the box to turn MathJax off. This feature requires Javascript. Click on a formula to zoom.
Abstract
Introduction
Accurate delineation of targets and organs at risk (OAR) is required to ensure treatment efficacy and minimize risk of normal tissue toxicity with radiotherapy. Therefore, we evaluated the impacts of computed tomography (CT) slice thickness and reconstruction methods on the volume and dose evaluations of targets and OAR.
Patients and methods
Eleven CT datasets from patients with thoracic cancer were included. 3D images with a slice thickness of 2 mm (2–CT) were created automatically. Images of other slice thickness (4–CT, 6–CT, 8–CT, 10–CT) were reconstructed manually by the selected 2D images using two methods; internal tumor information and external CT Reference markers. Structures and plans on 2–CT images, as a reference data, were copied to the reconstructed images.
Results
The maximum error of volume was 84.6% for the smallest target in 10–CT, and the maximum error (≥20 cm3) was 10.1%, 14.8% for the two reconstruction methods, internal tumor information and external CT Reference, respectively. Changes in conformity index for a target of <20 cm3 were 5.4% and 17.5% in 8–CT. Changes on V30 and V40 of the heart were considerable. In the internal tumor information method, volumes of hearts decreased by 3.2% in 6–CT, while V30 and V40 increased by 18.4% and 46.6%.
Conclusion
The image reconstruction method by internal tumor information was less affected by slice thickness than the image reconstruction method by external CT Reference markers. This study suggested that before positioning scanning, the largest section through the target should be determined and the optimal slice thickness should be estimated.
Introduction
The accurate delineation of targets and organs at risk (OAR) is crucial for radiotherapy (RT). Despite the rapid development of image techniques, such as MRI and PET/CT, improving the accuracy of target definitions,Citation1–Citation3 computed tomography (CT) imaging is still the main medical modality in defining targets and OAR for RT.
The slice thickness of a CT image is one of the important factors influencing the definition of targets and OAR.Citation4 Based on a water phantom, Srivastava et al found that the variability of volumes with slice thicknesses was considerable, especially for small volume structures such as 1–3 cm3, and the differences were smaller for larger volumes with a cutoff of about 20 cm3.Citation5 Our previous phantom studies, based on a series of spherical phantoms ranging from 0.02 to 1151 cm3 with slice thicknesses of 1.0, 1.5, 2.0, 2.5, 3.0, 4.0, 5.0, 7.5 and 8.0 mm, showed that the volume of <1 cm3 was underestimated 2%–100% for a slice thickness of ≤5 mm, but overestimated up to 112% for a slice thickness >5 mm for volumes of >1 cm3. The relative error decreased, and it was nearly zero for a slice thickness >100 cm3.Citation6 Prionas et al also performed a similar study and showed that a smaller slice thickness and a larger volume produced a more accurate volume assessment than larger slice thicknesses and smaller volumes.Citation7
The error on the definition of targets and OAR ultimately affects dose evaluation and comparison of treatment plans, since the dose–volume histogram (DVH) relies on computation of doses to certain volumes in a treatment planning system (TPS).Citation8,Citation9 Some radiotherapy technologies employing high gradients of dose, such as intensity-modulated radiotherapy (IMRT) and stereotactic body radiotherapy, are more sensitive to these errors, compared to three-dimensional conformal radiation therapy. Some studies demonstrated that the insufficient delineation of a planning target volume because of target mobility was a contributing factor in local failure after curative radiotherapy of lung cancer.Citation10,Citation11 Similarly, the underestimate or overestimate of targets and OAR caused by different slice thicknesses also affected the treatment efficacy and the quality of life of the patient. For brain tumors, Prabhakar et alCitation12 suggested that a 2.5 mm slice thickness was optimum for tumors <25 cm3 and 5.0 mm was optimum for tumors >25 cm3 in three-dimensional conformal radiation therapy. A study by Caivano et al study recommended 1 or 2 mm slice thicknesses for small targets in stereotactic body radiotherapy, and 4–6 mm for other volumes in three-dimensional conformal radiation therapy or IMRT.Citation13 A similar study was also found on rectal cancer,Citation14 however, a study evaluating slice thicknesses in thoracic cancer was not found.
The purpose of our study is to investigate impacts of CT slice thickness and reconstruction methods on volume evaluation and dosimetric coverage of targets and OAR in IMRT from patients with thoracic cancer, to ensure treatment efficacy and minimize risk of normal tissue toxicity with RT.
Patients and methods
Patient selection
Eleven patients diagnosed with thoracic cancer were randomly recruited for this trial. Ethics approval for this study was obtained from Chongqing Cancer Hospital’s ethics committee, and all patients gave written informed consent. Five of the patients presented with Stage III lung cancer, 4 presented with Stage II and III breast cancer and 2 with Stage II and III esophageal cancer. Their mean age was 55.9±8.9 years old and their mean BMI was 23.1±5.2 kg/m2.
For each patient, a CT image with a slice thickness of 2 mm (2–CT) was obtained with the patient breathing freely by a CT simulator (Brilliance-16, Philips Medical Systems Inc., Cleveland, OH, USA), while patient was immobilized with thermoplastic fixation, to reduce any error introduced by chest wall motion. Then the 2–CT image was transferred to a commercial TPS (Eclipse version 11, Varian Medical Systems Inc., Palo Alto, CA, USA) through the Digital Imaging and Communications in Medicine network. The senior radiation oncologist delineated the targets and OAR in the 2–CT images. To accurately analyze the impact of slice thickness on volume, the gross tumor volume, clinical target volume, and planning target volume were collectively called target volumes (TVs) in the data analysis of this study. The IMRT plans were developed in the 2–CT image with 6-MV photon beams from a linear accelerator (Varian Clinac iX, Varian Medical Systems Inc., Palo Alto, CA, USA). The plan developed in the 2–CT image met the requirement that 95% of prescription doses covered at least 100% of the planning target volumes with acceptable maximum doses.
Image reconstruction
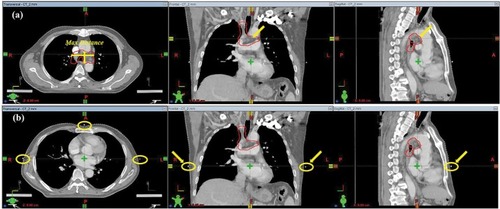
In general, the three-dimensional (3D) images ware created from multiple two-dimensional (2D) images either automatically (using all the patient’s 2D images) or manually (using a range of manually selected 2D images) in accordance with the primary axes of the 2D images. In this study, the 2–CT 3D images ware created automatically using all the patient’s 2D images; 3D images with slice thicknesses of 4, 6, 8, and 10 mm (4–CT, 6–CT, 8–CT, and 10–CT) were reconstructed manually in the selection workspace of Eclipse TPS using a range of manually selected 2D images. When selecting 2D images manually, two methods were adopted; the internal tumor information method and the external CT Reference three markers method. In the internal tumor information method, the layer showing the largest section through the target was selected as the initial layer () and then the alternate selection at a regular spacing up and down was performed. In the external the CT Reference markers method, the layer showing the surface three metal markers was selected as the initial layer () and then the alternate selection at a regular spacing up and down was performed.
Figure 1 Selection of the initial layer, when reconstructing 3D images with slice thickness of 4, 6, 8, and 10 mm.
Notes: (A) Internal tumor information method; the layer showing the largest section through the target; (B) external CT Reference markers method; the layer showing three metal markers.
Abbreviation: CT, computed tomography.
Subsequently, for each series, 4–, 6–, 8–, and 10–CT images were merged with 2–CT image using rigid registration (Offline Review, version 11, Varian Medical Systems Inc., Palo Alto, CA, USA). All the targets and OAR delineated in the 2–CT image were copied, slice by slice, to the reconstructed images to avoid the delineating deviation caused by intra-observer variability. The treatment plans were also copied to the reconstructed images and computed independently.
Plan evaluation
A conformity index, defined in EquationEquation 1(1) ,Citation15,Citation16 was used to measure the target dose conformity.
Statistical analysis
Eleven CT series were obtained, and each series included a 2–CT image created automatically and a sub-series of 4–CT, 6–CT, 8–CT, 10–CT images reconstructed manually. For each sub-series, all the data obtained in reconstructed images were compared with that obtained in the corresponding 2–CT image by using SPSS software version 23 (IBM Armonk, NY, USA).
Results
Volume analysis
Thirty-one irregular TVs were analyzed in this study. These targets were grouped, as shown in . shows all TVs normalized to that in 2–CT images, and shows the statistical variations on volumes with respect to that in 2–CT images.
Table 1 Groups of thirty-one irregular target volumes from eleven patients with thoracic cancer
Figure 2 The TVs in all series for both methods, normalized to that in 2–CT images.
Notes: (A) Targets in the 0–20 cm3 group; (B) targets in the 20–50 cm3 group; (C) targets in the 50–100 cm3 group; (D) targets in the 100–200 cm3 group; (E) targets in the 200–500 cm3 group; (F) targets in the 500–1,000 cm3 group. Here, the internal tumor information method is represented by the solid line with symbols, and the external CT Reference markers method is represented by the dashed line with symbols.
Abbreviations: CT, computed tomography; TVs, target volumes.
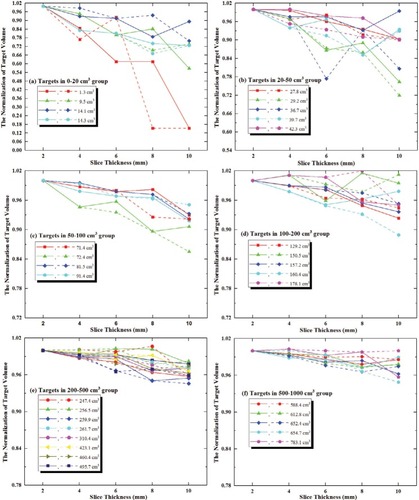
Figure 3 Relative change in TVs with respect to 2–CT images.
Notes: Error bars indicate ± 1 SD. Here, the internal tumor information method is represented by vertical column graph, and the external CT Reference markers method is represented by vertical column graph filled by dense oblique lines.
Abbreviations: CT, computed tomography; TVs, target volumes.
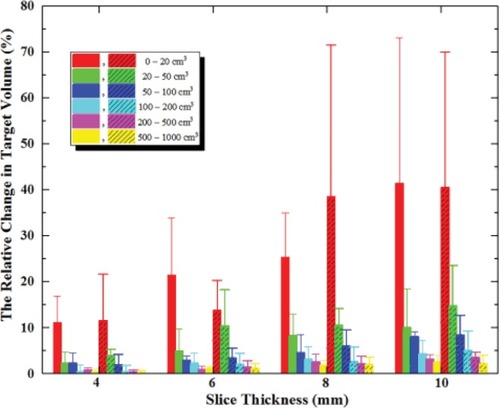
The TV deviations in both methods decreased with increasing slice thickness of CT image, and the change in internal tumor information method was slightly smaller and smoother than that in the external CT Reference markers method, especially for targets of <50 cm3. As shown in , for targets of 1.3 cm3, the volume deviations in 10-CT, 8 -CT and 6-CT were 84.62%, 38.46% and 15.39% in internal tumor information method, and 84.62%, 84.62% and 13.77% in the external CT Reference markers method.
Dose conformity and homogeneity of target
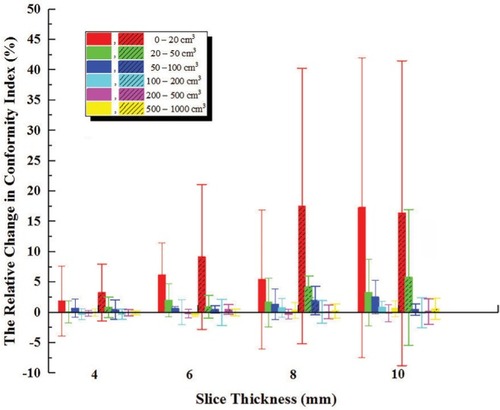
The CI in both methods decreased with increasing slice thickness of CT image, and the change in internal tumor information method was slightly smaller and smoother than that in external CT Reference three markers method. As shown in , the changes in CI of small targets (<20 cm3) were considerable, 5.4%, 17.5% in 8–CT, and 6.1%, 9.2% in 6–CT, for both methods, respectively; for targets of ≥20 cm3, the decrease was <2.0% in 6–CT, <4.3% in 8–CT, and <5.8% in 10–CT.
Figure 4 The relative change in target CI with respect to 2–CT images.
Notes: Error bars indicate ± 1 SD Here, the internal tumor information method is represented by vertical column graph, and the external CT Reference markers method is represented by vertical column graph filled by some dense oblique lines.
Abbreviations: CI, conformity index; CT, computed tomography.
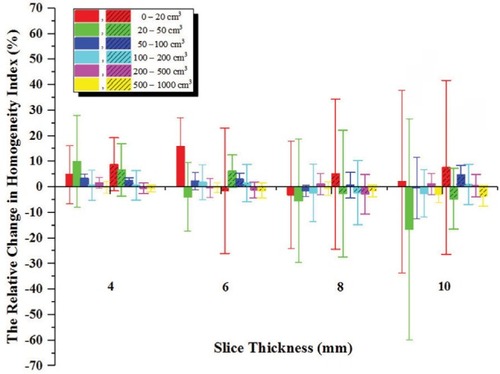
The change in HI was not sensitive to slice thickness and the difference between both methods was irregular, as shown in . For some cases with breast cancer, the change of HI increased with the increase of slice thickness and this value was ≤4.67%. The change in HI was –5.2%–6.08% for lung cancer and –8.33%–8.08% for esophageal cancer.
Figure 5 The relative change in target HI with respect to 2–CT images.
Notes: Error bars indicate ±1 SD. Here, the internal tumor information method is represented by vertical column graph, and the external CT Reference markers method is represented by vertical column graph filled by some dense oblique lines.
Abbreviations: CT, computed tomography; HI, homogeneity index.
OAR sparing
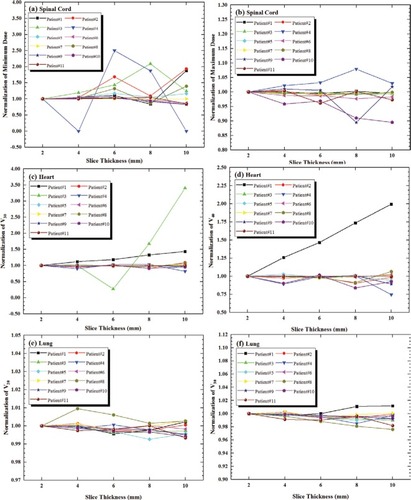
The volumes of spinal cord, lung and heart were 45.7±11.5 cm3 (range of 31.3–62.1 cm3), 2834.1± 860.8 cm3 (range of 1635.0–4285.7 cm3) and 584.3±79.5 cm3 (range of 416.5–722.1 cm3) in 2–CT, respectively. The impacts of slice thickness on the minimum dose of spinal cord, and V30, V40 of heart were considerable, as shown in . For example, in the internal tumor information method, the volume of spinal cord decreased by 7.7% between 2–CT and 10–CT in Patient 1, while its minimum dose increased by 88.1%; for heart, the volume decreased by 3.2% between 2–CT and 6–CT, while the V30 and V40 increased by 18.4% and 46.6%, respectively. The slice thickness had less impact on maximum dose to spinal cord, as shown in . The mean dose of spinal cord increased by an average of 3.1%. The slice thickness had no effect on dose to lung, as shown in . The dose to OAR made no significant difference between both methods.
Figure 6 Doses of spinal cord, heart and lung for eleven patients in internal tumor information method, normalized to doses derived from 2–CT images.
Notes: (A) Minimum dose in spinal cord; (B) maximum dose in spinal cord; (C) V30 in Heart; (D) V40 in Heart; (E) V20 in Lung; (F) V30 in Lung.
Discussion
Prior to this study, the Chongqing Cancer Institute carried out a phantom study and proposed a simple and feasible quality assurance method for estimating the accuracy of margin growth.Citation6 This study investigated irregular TVs in thoracic cancer patients. A considerable variability of TVs between different CT slice thicknesses, especially for small targets, such as 1.3 cm3 tumors, was found; the variation was smaller for larger targets. Our study showed that CT images with slice thickness of <4 mm would be optimum for small targets (<20 cm3) in IMRT of thoracic cancer patients. However, some studies revealed a noise-limited minimum thickness, such as the slice thickness of 1.2 mm superior to 0.6 mm because of increasing dimpling artifacts.Citation18 Similarly, the slice thickness with the range of 0.8–2 mm had no considerable impact on the residual setup error of stereotactic radiosurgery target localization.Citation19 In brain cancer, previous studies suggested 2.5 mm for tumor of <25 cm3 in three-dimensional conformal radiation therapy and 1 or 2 mm in stereotactic body radiotherapy with small targets.Citation12,Citation13 But, the brain tumors were not in any way affected by respiratory motion, and targets of thoracic cancer were different. So, the minimum optimum thickness still needs to be investigated in future work.
The error in volume evaluation ultimately affected the integrity in plan evaluation as well as other radiobiological plan metrics. Our study showed that the conformity index of 95% isodose decreased with increasing slice thickness of CT image and HI was not affected. For OAR, the cardiac events were related to both dose and irradiated volume of heart. The mean V20, V30 and V40 of the contoured whole heart had a considerable impact on the symptomatic cardiac toxicities.Citation20 The incidence of risk increased with a variety of dose parameters.Citation21 Our study showed that V30 and V40 of whole heart were affected by slice thickness of the CT image. Thus, the optimal slice thickness was crucial for the accurate evaluation of these parameters, to the preferable OAR sparing.
The image reconstruction method also affected the volume and dose evaluations. In Srivastava’s study, CT images with different slice thicknesses (1, 2, 3, 5, 10 mm) were obtained by repeating helical scans on a CT simulator.Citation5 In a study by Prionas et al, CT images with greater thicknesses (1.25, 2.50, 5.0 mm) were produced by averaging contiguous thin-slice images (0.625 mm).Citation7 Unlike both studies, we reconstructed a series of 3D images with greater thickness in Eclipse TPS selection workspace using a range of manually selected 2D images, which was similar to that found by Caivano et al.Citation13 However, how to choose the initial layer in the reconstruction process was one concern noticed in our study. We found that the external CT Reference three markers method has the characteristics of instability and randomness, while the internal tumor information method could maximize the tumor outline and make the smaller deviation in volume estimations, especially for tumor volumes of <50 cm3, as well as slightly smaller change in CI. These findings showed a potential improvement in the workflow of scanning CT positioning images to obtain the targets and OAR closest to reality.
In the conventional CT scan for positioning, radiation oncologist positioned one patient and then placed three markers on surface skin or thermoplastic masks according to in-room lasers; an orthophoria topogram was scanned, followed by determining scan range and parameters; afterwards, spiral scanning was performed. Disadvantages of this method are potentially making three markers placed on the different slices, which can cause difficulty in setting the isocenter in TPS, and to potentially lose partial information on the largest section through the target during image reconstruction. An improvement in the workflow was raised in our study. In the improved workflow, the radiation oncologist determined the largest section through the target by reading the orthophoria topogram and then placed three markers on this area. Afterwards, the optimal slice thickness was estimated by tumor size and scan range, to not only ensure three markers on the same slice but also retain the largest section through the tumor during image reconstruction.
The limitation of this study was that the error introduced from chest wall motion in free breathing was not researched. Even so, it was obvious that the optimal slice thickness was crucial for the accurate evaluation of volumes and doses in targets and OAR of thoracic cancer RT.
Conclusion
CT slice thickness and reconstruction methods are important factors that influence the accurate definition of targets and OAR in thoracic cancer RT, except in respiratory motion. This study concludes that a CT slice thickness of <4 mm is suggested for small targets (<20 cm3) in IMRT of thoracic cancer patients, to ensure treatment efficacy and minimize risk of normal tissue toxicity with RT. The reconstruction method by internal tumor information in TPS shows an advantage over the reconstruction by the external CT Reference markers method. An improved scanning workflow for positioning images is proposed to obtain the targets and OAR closest to the reality.
Acknowledgments
This work was supported by the National Natural Science Foundation of China (11575038), the Performance Motivation and Guidance Special Project of Chongqing Science & Technology Commission (cstc2017jxjl130017), the Innovation Project of Social Undertakings and the Livelihood Security Technology of Chongqing Science & Technology Commission (cstc2016shms-ztzx10002).
Disclosure
The authors report no conflicts of interest in this work.
References
- WongKHPanekRBhideSANuttingCMHarringtonKJNewboldKLThe emerging potential of magnetic resonance imaging in personalizing radiotherapy for head and neck cancer: an oncologist’s perspectiveBr J Radiol20179010712016076828256151
- PogsonEMDelaneyGPAhernVComparison of Magnetic Resonance Imaging and Computed Tomography for Breast Target Volume Delineation in Prone and Supine PositionsInt J Radiat Oncol Biol Phys201696490591227788960
- KonertTVogelWMacmanusMPPET/CT imaging for target volume delineation in curative intent radiotherapy of non-small cell lung cancer: IAEA consensus report 2014Radiother Oncol20151161273425869338
- BeneventiSChionneFGobbiGItalianiMRaymondiCQuantitative CT tomography for radiotherapy treatment planning: Calibration phantom and sources of errorRadiotherapy and Oncology1995371S41
- SrivastavaSPChengCWdasIJThe effect of slice thickness on target and organs at risk volumes, dosimetric coverage and radiobiological impact in IMRT planningClin Transl Oncol201618546947926311077
- WangYJinFZhouJLuoHA simple method of evaluating margin-growing accuracy in image-guided radiation therapyBr J Radiol20168910622014063627007180
- PrionasNDRaySBooneJMVolume assessment accuracy in computed tomography: a phantom studyJ Appl Clin Med Phys2010112168180
- OinamASSinghLShuklaADose volume histogram analysis and comparison of different radiobiological models using in-house developed softwareJ Med Phys201136422022922228931
- HernandoMLMarksLBBentelGCRadiation-induced pulmonary toxicity: a dose-volume histogram analysis in 201 patients with lung cancerInt J Radiat Oncol Biol Phys200151365065911597805
- BalterJMTen HakenRKLawrenceTSLamKLRobertsonJMUncertainties in CT-based radiation therapy treatment planning associated with patient breathingInt J Radiat Oncol Biol Phys19963611671748823272
- van Sörnsen de KosteJRLagerwaardFJSchuchhard-SchipperRHDosimetric consequences of tumor mobility in radiotherapy of stage I non-small cell lung cancer–an analysis of data generated using ‘slow’ CT scansRadiother Oncol2001611939911578735
- PrabhakarRGaneshTRathGKImpact of different CT slice thickness on clinical target volume for 3D conformal radiation therapyMed Dosim2009341364119181254
- CaivanoRFiorentinoAPediciniPCalifanoGFuscoVThe impact of computed tomography slice thickness on the assessment of stereotactic, 3D conformal and intensity-modulated radiotherapy of brain tumorsClin Transl Oncol201416550350824052169
- OlssonCThorMLiuMInfluence of image slice thickness on rectal dose-response relationships following radiotherapy of prostate cancerPhys Med Biol201459143749375924936956
- PaddickIA simple scoring ratio to index the conformity of radio-surgical treatment plans. Technical noteJ Neurosurg200093Suppl 3(S3)21922211143252
- JinFWangYWuYZA novel correction factor based on extended volume to complement the conformity indexBr J Radiol2012851016e523e52922128127
- ClausFMijnheerBRaschCReport of a study on IMRT planning strategies for ethmoid sinus cancerStrahlenther Onkol20021781057257612386789
- LalondrelleSSohaibSACastellanoIAMearsDHuddartRKhooVInvestigating the relationship between virtual cystoscopy image quality and CT slice thicknessBr J Radiol20128510161112111722215882
- BricenoJLiHHuangYWenNChettyISU-E-J-30: The Effect of Planning CT Slice Thickness On Evaluation of SRS Target Localization AccuracyMed Phys20154263270
- KonskiALiTChristensenMSymptomatic cardiac toxicity is predicted by dosimetric and patient factors rather than changes in 18F- FDG PET determination of myocardial activity after chemoradiotherapy for esophageal cancerRadiother Oncol20121041727722682539
- WeiXLiuHHTuckerSLRisk factors for pericardial effusion in inoperable esophageal cancer patients treated with definitive chemoradiation therapyInt J Radiat Oncol Biol Phys200870370771418191334