
Abstract
Purpose
This study aimed to investigate the value of shear wave elastography (SWE) for characterization of breast masses in a Chinese population.
Patients and methods
Two thousand two hundred seventy-three women consented to be prospectively enrolled for the characterization of breast masses with ultrasound and SWE. Breast masses were known from symptoms, palpability, and/or previous imaging screening with mammography and/or ultrasound. Correlation of SWE qualitative and quantitative features with malignancy risk and impact on diagnostic performance of combining SWE features were assessed, and the Breast Imaging Reporting and Data System (BI-RADS) scoring was calculated using histopathology as reference.
Results
Data of 2,262 masses (median size: 13 mm; range: 1.3–50) from 2,262 patients (median age: 43 years; range: 18–91) were investigated, of which 752 (33.3%) were malignant. Sensitivity and specificity of BI-RADS diagnosis were 97.5% (733/752) and 54.8% (827/1,510), respectively. By logistic regression, the combination of maximum elasticity (Emax) measurements with BI-RADS assessments increased the area under the receiver operating characteristic curve from 0.908 (95% CI: 0.896–0.920) to 0.954 (95% CI: 0.944–0.962). Using Emax of 30 kPa or lower to selectively downgrade BI-RADS 4a masses to follow-up, and Emax of 160 kPa or higher to selectively upgrade BI-RADS 3 lesions to biopsy, specificity significantly increased from 54.8% (827/1,510) to 66.1% (998/1,510) (P<0.001) while sensitivity decreased nonsignificantly from 97.5% (733/752) to 96.9% (729/752) (P=0.2891). Positive predictive value for biopsy recommendation increased from 51.7% (733/1,417) to 58.7% (729/1,241) (P<0.001).
Conclusion
Adding SWE maximum stiffness to BI-RADS 3 and BI-RADS 4a breast masses in a Chinese population increased significantly the specificity of breast ultrasonography, without significant change in sensitivity.
Introduction
Ultrasonography (US) has become an indispensable tool in breast imaging. Morphologic descriptors of a given lesion seen on grayscale imaging were standardized by the American College of Radiology (ACR) with the Breast Imaging Reporting and Data System (BI-RADS)-US lexicon.Citation1 The major advantages of this system are improved reliability and reproducibility of cancer risk assessment,Citation2,Citation3 high sensitivity (at least 90%), and negative predictive value (NPV; at least 90%) for breast cancer. However, it causes a high incidence of false-positive BI-RADS 4a, which leads to unnecessary biopsy.Citation4,Citation5
Mammography is the imaging modality of preference for breast cancer screening, although its sensitivity may decrease to 30%–48% in women with dense breasts,Citation6,Citation7 leading to insufficient screening accuracy in Asian populations including Chinese.Citation8,Citation9 The Japan Strategic Anti-cancer Randomized Trial (J-START) reported that US could offer a low cost way to increase the detection of early breast cancer.Citation10 Another multicenter randomized trial revealed that US was superior to mammography for breast cancer screening in high-risk Chinese women.Citation11
Breast US elastography has become a routine tool in addition to diagnostic US, enabling an increase in specificity by selectively reconsidering biopsy for low suspicion, BI-RADS 4a lesions.Citation12 US elastographic evaluation has been incorporated into the second edition of the BI-RADS-US lexicon,Citation1,Citation13 and the Korean Society for Ultrasound in Medicine published its guidelines for the use of breast elastography.Citation14
ShearWave™ Elastography (SWE™) is commercially available on the Aixplorer® general purpose ultrasound system (SuperSonic Imagine, Aix-en-Provence, France). SWE can provide qualitative and quantitative elastic information in real time and has proven to be highly reproducible.Citation15
The clinical utility of SWE in ultrasonic diagnosis of breast lesions was demonstrated in previous studies, including the transatlantic BE1 study, the prospective multicenter, multinational study with the largest sample size published so far based on American and European population.Citation16–Citation19 It is concluded that adding SWE features, and especially maximum stiffness evaluation to US grayscale imaging could significantly reduce the number of false-positive cases, leading to a specificity increase from 61.1% to 78.5% without any loss in sensitivity. The clinical utility of SWE for ultrasound diagnosis of breast lesions in Asian populations has only been studied in single-center studies to date. The purpose of this prospective multicenter study was to validate the added value of SuperSonic Imagine SWE as proposed by Berg et al for the characterization of breast masses in a Chinese population.Citation16
Patients and methods
This prospective Health Insurance Portability and Accountability Act (HIPAA)-compliant study protocol (www.clinicaltrials.gov, NCT02226081), funded by SuperSonic Imagine, was approved by Shanghai Fudan Medical University Chinese Ethics Committee (#1405135-3) and conducted from June 2014 to June 2015 in 16 Chinese mainland hospitals. There were 80 investigators in this study who were ultrasound specialists with a minimum experience of 4,000 breast ultrasound cases in the preceding 2 years, and they had a minimum training phase of 20 SWE examinations supervised by SuperSonic Imagine staff.
Ethics, consent, and permission
This study was approved by Shanghai Fudan Medical University Chinese Ethics Committee (#1405135-3). All procedures performed in studies involving human participants were in accordance with the ethical standards of the institutional and national research committee and with the 1964 Declaration of Helsinki and its later amendments or comparable ethical standards. Written informed consent was obtained from all individual participants included in the study.
Consent for publication
Written informed consent for the publication of these details was obtained from all participants.
Patients
Consecutive female patients of at least 18 years of age deriving from diagnosis who gave written informed consent were recruited and received SWE examinations free of charge. Breast lesions classified BI-RADS 2, 3, 4, or 5 had to be visible on ultrasound. Exclusion criteria included inability to give written informed consent, lesions previously treated or biopsied, multiple lesions, pregnant or breastfeeding women, breast lesions classified as BI-RADS 0 or 6, and women with previous ipsilateral breast surgery and/or with breast implants (More details in Supplementary material).
Data collection
Ultrasound examination
Ultrasound examinations were performed on Aixplorer ultrasound imaging system (SuperSonic Imagine) using the SL15-4 transducer in two orthogonal planes by one of two sonographers with over 10 years’ experience in breast imaging. Ultrasound characterization was performed according to the BI-RADS: Ultrasound lexicon.Citation1 Lesion size was defined as the largest dimension of the maximum diameters measured in both scanning planes.
Three SWE acquisitions of three frozen frames were acquired following the manufacturer recommendations in both scanning planes, using the default maximum color scale of 180 kPa (7.7 m/second). Images were evaluated collectively by two principle investigators who were blinded to each other’s findings. Another experienced sonographer was invited to discuss and finally reach a consensus when the two principle investigators did not reach agreement.
Lesion maximum diameter on SWE images was measured encompassing the entire lesion on B-mode images and any stiffness halo immediately adjacent. Qualitative and quantitative SWE features were assessed.Citation16,Citation20
Qualitative features
Qualitative features including SWE shape, SWE shape similarity with B-mode images, SWE homogeneity, and SWE color patterns were recorded (Details in Supplementary material).
SWE shapes of breast lesions were identified as three types, including oval, round, and irregular types. By comparing the SWE shapes with B-mode images, we identified the similarity as very similar, reasonably similar, and dissimilar.
SWE homogeneity was evaluated as very homogeneous, reasonably homogeneous, and not homogeneous, by observing the color distribution inside the lesions and between adjacent areas.
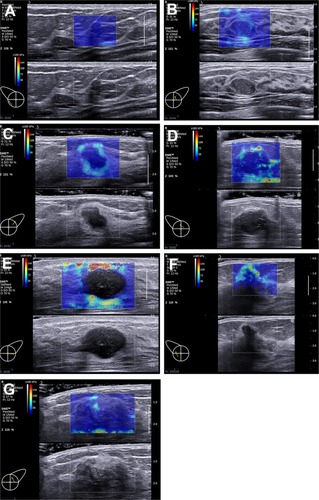
Seven color patterns could be demonstrated in this study including no finding, vertical stripes pattern, rim of stiffness pattern, colored lesion pattern, void center pattern, horseshoe pattern, and spots pattern ().
Figure 1 Seven patterns could be demonstrated on the images acquired in ShearWave™ Elastography (SWE).
Notes: (A) No findings: No difference is observed at the margin of or inside the lesion with the color around the lesion (homogeneously blue). (B) Vertical stripes pattern: A color is observed at the margin of or inside the lesion, which differs from the color around the lesion. The differing color extends beyond the lesion and continues vertically in cords on the cutaneous side and/or the thoracic wall. (C) Rim of stiffness pattern: A localized colored area appears at the margin of the lesion and creates a continuous closed circle. (D) Colored lesion pattern: Colored areas are heterogeneously visible inside the lesion. (E) Void center pattern: There is a lack of SWE signal inside the lesion. The rest of the SWE Box fills correctly. (F) Horseshoe pattern: A localized colored area appears at the margin of the lesion and creates an open circle. (G) Spots pattern: Colored areas are visible above and/or below the lesion.
Quantitative features
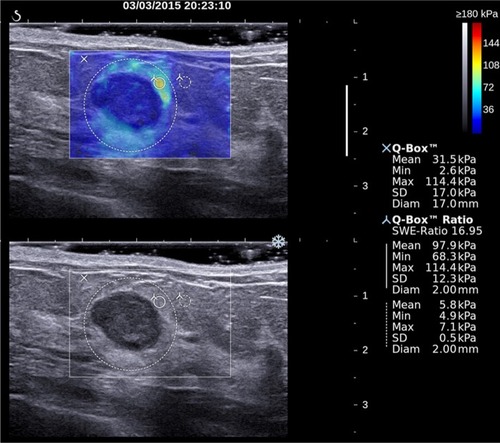
For each of the three SWE acquisitions in both views, elasticity measurements were performed by placing a first built-in “Q-Box™” quantification tool covering as much of the lesion as possible. This Q-Box provided three elasticity measurements: the lesion maximum elasticity value (Emax), the lesion average elasticity (Emean), and the lesion elasticity standard deviation (ESD). Additionally, an elasticity ratio (Eratio) was also calculated between the lesion and subcutaneous fatty tissue, by placing a 2 mm diameter Q-Box over the lesion’s stiffest area (or immediately adjacent to it) and another 2 mm diameter Q-Box over subcutaneous fatty tissue at distance from the lesion (). When needed, the stiffest area on SWE images was identified by gradually lowering the color scale from 180 kPa until the first relevant red area appeared.
Figure 2 Two-dimensional grayscale ultrasound image (bottom) of a breast lesion in a 51-year-old female patient.
Notes: According to morphological signs, the lesion was classified as probably benign (BI-RADS 3). Upper image shows the SWE semitransparent map that overlays the grayscale anatomical image. The largest dotted line circular region of interest (ROI) marked with an “X” was used to quantify global lesion stiffness values, reported on the right-hand side under “XQ-Box™.” The two smallest ROIs were used to calculate the elasticity ratio between the stiffest area within the lesion or surrounding stiffness halo and breast fatty tissue used as a reference. The SWE features of this lesion were suspicious for malignancy. Pathological outcome from breast biopsy was a mixed papillocarcinoma with mixed ductal carcinoma.
Abbreviations: BI-RADS, Breast Imaging Reporting and Data System; SWE, shear wave elastography.
Elasticity measurements were recorded on each of the three SWE acquisitions in both views using the “Q-Box” quantification tool. Maximum, average, and SD of lesion stiffness (lesion Emax, Emean, ESD) were measured with a Q-Box covering as much as lesion SWE map. Elasticity ratio (Eratio) between the lesion and fatty tissue was calculated with the Q-Box ratio tool, using a 2 mm diameter Q-Box over the lesion’s stiffest area (or immediately adjacent) and a second 2 mm diameter Q-Box over subcutaneous fatty tissue at a distance from the lesion (). The maximum and average elasticity values (Emax, Emean) of fatty tissue were also recorded. When needed, the stiffest area on SWE images was identified by gradually lowering the color scale from 180 kPa until the first relevant red area appeared.
Reference standard
BI-RADS 2 lesions were considered benign. All the 152 lesions classified as BI-RADS 2 have been followed up for over 2 years until June 2017. For 695 lesions classified as BI-RADS 3 in this study, final pathological diagnosis was available because all the lesions underwent core-needle biopsy, among which 596 lesions underwent surgery, owing to the medical status of China and patients’ demand for intervention. BI-RADS 4a lesions or higher were core-biopsied under ultrasound guidance according to routine clinical practice. When surgery was performed, pathological results were collected. Ground truth for biopsied lesion was derived from histopathologic results after core biopsy, surgery, or a combination of these. The final diagnosis was determined from fine-needle aspiration (FNA) alone in eight cases, from core biopsy alone in 418 cases and from surgery and/or surgical biopsy alone in 1,381 cases. One lesion underwent FNA followed by core biopsy, another lesion underwent surgery after a positive FNA for malignancy, and 453 lesions received surgery after core biopsy. A total of 935 benign lesions were diagnosed after surgery (62%).
Statistical analysis
SWE variables were compared between benign and malignant lesions. Categorical variables were compared using chi-squared test and chi-squared test for trend, while continuous variables were compared using the Kruskal–Wallis test. For continuous variables (Emax, Emean, ESD, and Eratio), average values were calculated across the three acquisitions in both longitudinal and transverse planes.
The diagnostic value of the combination of the BI-RADS classification with each SWE variable was assessed by stepwise logistic regression, in which a model fit P-value <0.05 was used to identify features that contributed to the prediction of the outcome. The best-performing SWE variable was then selected to implement reclassification of initially BI-RADS 3 and 4a lesions according to reclassification rules proposed by Berg et al.Citation16
Ultrasound tests (original BI-RADS and modified BI-RADS) were considered positive for malignancy for scores 4 and 5 and negative for scores 2 and 3. Diagnostic performances of ultrasound tests [sensitivity, specificity, positive predictive value (PPV), NPV, and accuracy] were calculated and compared using appropriate tests: the McNemar test for comparison of paired proportions and the chi-squared test for unpaired proportions. Aggressive and conservative reclassification rules of BI-RADS 3 and 4a lesions as proposed by Berg et al were also tested (Supplementary material).
Statistical analyses were performed using statistical analysis software MedCalc®, version 14.12.0–64 bit for Windows XP/Vista/7/8 (MedCalc Software bvba), with a P-value of <0.05 indicating statistical significance.
Results
Population description and lesions’ characteristics
Two thousand two hundred seventy-three breast lesions from 2,273 patients were recruited, from which 11 were excluded (nine with missing final pathology, one with no SWE acquisition, and one nonbreast lesion). The final study population consisted of 2,262 patients (median age: 43 years old; IQR: 35–51; range: 18–91), with 2,262 breast lesions, of which 752 were malignant (33.3%). All the 152 lesions classified as BI-RADS 2 had been followed up for over 2 years until June 2017. Characteristics of patients and breast lesions were described in .
Table 1 Description of the study population and lesion characteristics
Diagnostic performance of conventional ultrasound in breast lesions
Malignancy rates in the BI-RADS 2, 3, 4a, 4b, 4c, and 5 categories were 0/152 (0%), 19/694 (2.7%), 87/611 (14.2%), 147/267 (55.1%), 267/301 (88.7%), and 232/237 (99.7%), respectively. The sensitivity, specificity, PPV, and NPV for ultrasound characterization of breast lesions were 97.5% (733/752), 54.8% (827/1,510), 51.7% (733/1,417), and 97.8% (827/846), respectively. The diagnostic accuracy of breast ultrasound was 69% (1,560/2,262).
SWE evaluation
Qualitative SWE features (homogeneity, shape, and dissimilarity of lesion shape between B-mode and SWE imaging) were correlated with increased malignancy risk (). A single SWE pattern was reported in 1,049 (46.4%) lesions, of which 674 (64.3%) lesions were malignant. Patterns “Spots” and “Vertical stripes” failed to predict malignancy (OR 1.18; P=0.3692 and 0.52, P=0.004, respectively); all other patterns were predictive of malignancy: “Rim of stiffness” (OR 20.31; P<0.001), “Horseshoe pattern” (OR 10.61; P<0.001), “Colored lesion” (OR 3.45; P<0.001), and “Void center” (OR 3.45; P<0.001). When no specific SWE pattern was reported, the malignancy rate was low: 59/1,191 (4.95%). A combination of two or more SWE patterns was described in 22 cases (0.9%), of which 19 (86.4%) were malignant. All combinations involving any of “Rim of stiffness,” “Horseshoe,” or “Colored lesion” were highly predictive of malignancy (100%), with 12/12, 7/7, and 6/6 lesions being malignant, respectively.
Table 2 Rates of malignancy according to qualitative shear wave elastography features
All stiffness measurements, including those performed in subcutaneous fat tissue, were significantly higher in breasts with malignant lesions in both scanning planes ().
Table 3 Shear wave elastography measurements performed in both scanning planes in the masses or their surrounding and in the reference fatty tissue
Diagnostic value of SWE variables
The diagnostic value of SWE features alone was described in . When combining SWE variables with original BI-RADS assessment by stepwise logistic regression, SWE homogeneity, SWE shape, “Rim of stiffness” color pattern, as well as all quantitative variables (Emax, Emean, Eratio, and ESD) significantly increased the area under the receiver operating characteristic curve (AUC) (P<0.001) (), among which Emax yielded the highest AUC (0.954).
Table 4 Cutoff value determined by the Youden index and associated performances of SWE feature
Table 5 Impact of combining SWE characteristics with the BI-RADS classification on the global diagnostic performance (AUC) of the BI-RADS classification alone
Confirming reclassification rules for BI-RADS category 3 and 4a lesions
When the conservative reclassification rule defined by BE1 study was applied to this study population,Citation16 using Emax as the reclassifying SWE variable, the sensitivity, specificity, PPV, and NPV of the ultrasound diagnostic test would have changed from 97.5% (733/752) to 96.9% (729/752) (P=0.2891), 54.8% (827/1510) to 66.1% (998/1510) (P<0.001), 51.7% (733/1,416) to 58.7% (729/1,241) (P<0.001), and 97.8% (827/846) to 97.7% (998/1,021) (P=0.883), respectively. Using the more aggressive rule to downgrade the BI-RADS 4a masses would have led to a higher increase in specificity: from 54.8% (827/1,510) to 86.4% (1,305/1,510) (P<0.001), along with a significant decrease in sensitivity: from 97.5% (733/752) to 91.5% (688/752) (P<0.001), and NPV: from 97.8% (827/846) to 95.3% (688/893) (P=0.005) ().
Table 6 Diagnostic performance of combining SWE Emax with the BI-RADS classification according to conservative and aggressive reclassification rule from the BE1 study
Focus on low suspicion masses
Low suspicion masses can be defined as BI-RADS 3 and 4a lesions showing oval shape, circumscribed margins, no posterior shadowing, or any other suspicious feature on gray-scale imaging. A subset of 519 low suspicion masses could be extracted, of which 20 (3.9%) were cancers.
Using BE1 conservative reclassification rule, no cancer would be downgraded from BI-RADS 4a to follow-up nor upgraded from BI-RADS 3 to biopsy. Forty-three percent (43/99) of initial false-positive masses would be properly downgraded to follow-up, while no benign masses would be upgraded to biopsy, increasing nonsignificantly the positive biopsy rate from 9.2% (10/109) to 15.2% (10/66) (P=0.232671). The malignancy rate among BI-RADS 3 low suspicion lesions would decrease nonsignificantly from 2.4% (10/410) to 2.2% (10/453) (P=0.825447).
Discussion
To the best of our knowledge, this study was the first investigation into the clinical use of SWE in a prospective multi-center cross-sectional study in a Chinese population. Previous studies performed in China investigated the diagnostic value of strain elastography for breast lesion characterization,Citation21–Citation23 and only one yielded potential improvement of diagnostic performance of ultrasound by combining elastography information to grayscale evaluation.Citation21 The main findings of SWE in this study were the reduction of false positives and improvement in specificity.
Despite general agreement on diagnostic value of SWE evaluation within ultrasound assessment of breast masses,Citation16,Citation17,Citation19,Citation24–Citation30 consensus on the most valuable SWE feature(s) and cutoff value(s) has not been reached yet.Citation31 Evans et alCitation26 and Chang et alCitation25 proposed to use Emean ≥50 kPa and ≥80.17 kPa as suspicious signs, respectively. In the study by Ko et al,Citation32 the optimal Emean cutoff value (41.6 kPa) was lower than those determined by other published studies on solid breast masses.Citation25,Citation26,Citation28 Other studies demonstrated best diagnostic performance for Emax when combining with the BI-RADS score: Berg et al,Citation16 Lee et al,Citation28 and Yoon et alCitation20 used an Emax of 80–82.8 kPa while Zhou et alCitation30 reported that both an ESD of 6.3 kPa and an Emax of 49.57 kPa had significantly better performance than any other quantitative measurements. Park et alCitation31 demonstrated that Emax provided the best AUC compared with other quantitative parameters and determined the optimal cutoff value to be 45.1 kPa.Citation32
Patterns “Spots” and “Vertical stripes” failed to predict malignancy because they were related with artifact produced by pressure of the probe. Results of this study confirmed that SWE homogeneity, SWE shape, the “Rim of Stiffness” sign, and the “Horse Shoe” pattern were indicative of malignancy risk. Evans et al,Citation26 Tozaki et al,Citation33 and Zhou et alCitation30 showed that the “stiff rim” sign was a predictor of malignancy. Data of this study suggested that lesions presenting with a combination of two SWE patterns (1% of the sample population), including “Rim of Stiffness,” “Horse Shoe,” or “Colored Lesion” patterns, had a 100% malignancy rate. Desmoplastic reaction or infiltrating cancer cells have been proposed as explanations of the “Rim of Stiffness” or the “Horse Shoe.”Citation12,Citation26 As to the other patterns, low shear wave amplitudes and/or noise within malignant lesions have been presented as other possible explanations,Citation32 which might be caused by the attenuation of the shear waves from lesion surrounding tissue.Citation33
Lesion maximum stiffness (Emax) was found to be the best-performing stiffness measurement combined with the BI-RADS score, similar to findings from other experiences.Citation16,Citation17,Citation19,Citation24–Citation30 In this study, we found that the BE1 conservative reclassification ruleCitation16 significantly increased the specificity of breast ultrasound to a slightly higher extent than that observed in the BE1 study (11.3 points from 54.8% to 66.1% compared with 4.6 points from 61.1% to 65.7%, respectively), providing a higher increase in PPV for biopsy recommendation (7 points higher in the BE3 population compared with 3.4 points in the BE1 population). However, the implementation of the BE1 aggressive reclassification rule to the studied Chinese population significantly decreased sensitivity by 6 points (from 97.5% to 91.5%). Therefore, we assume that the BE1 conservative rule is applicable to Chinese population, but not the aggressive rule, which legitimates the fact that both a conservative rule and an aggressive rule were initially developed. This study population could be used in future works to determine specific cutoff values for this population, for example, by randomly splitting it into two independent cohorts, one to determine new cutoffs values and the other to validate such new reclassification rules. As initially suggested by Berg et al,Citation16 the benefit of conservative reclassification rule was confirmed in this study when applied to low suspicion masses. However, because no low suspicion masses initially classified as BI-RADS 3 had stiffness values over 160 kPa, none of the false-negative cases could be upgraded to biopsy by using SWE information.
The different outcome of the BE1 aggressive reclassification rule applied to this study population could be explained by populations’ differences. Increased breast tissue density in Asian patients may be one of the reasons; patients’ median age in this population was lower than the BE1 population (43vs 50 years old), theoretically in line with a younger average age of highest incidence of breast cancer in Asian populations. Palpable masses were more common in this population (70% vs 40%), with an apparently similar malignancy rate among palpable lesions (41% vs 43%, respectively); median Emax values seemed to be lower in this population of benign (30 vs 41 kPa) and malignant (113 vs 179 kPa) lesions. On the contrary, no differences were found for median lesion size and malignancy rates in BI-RADS classes.
The study has some limitations. First, combinations of several SWE features added to BI-RADS classification were not evaluated in this study because such combinations were proved to be useless.Citation16,Citation29 Second, this study design was not comparative, and patients’ management was not prospectively modified as a consequence of SWE evaluation. In such a comparative design, the upfront comparison of the number of biopsies performed, malignancy rates in each of the BI-RADS classes, and number of false negatives and false positives in both arms would probably provide the definitive proof of the benefit of SWE in the ultrasound characterization of breast masses. Third, owing to the patients’ requests, surgeons’ decisions, and the size of masses over 2 cm, there was a high number of BI-RADS 3 masses underwent surgery and finally confirmed as benign.
Conclusion
Results of this study confirmed several aspects of the use of ultrasound and SWE for the characterization of breast lesions in a large Chinese population. The ability of SWE features to improve the diagnostic performances of breast ultrasound, especially maximum stiffness (Emax), was confirmed, in particular in low suspicion masses. It was confirmed that SWE could be used as an additional criterion to reduce false positives of breast ultrasound characterization, and therefore improve diagnostic confidence.
Acknowledgments
We thank the following investigators for the collection of participants’ data: Lin X, Chen Y, Wu C, Chen Q, Peng Y, Luo B, Tang L, Li J, Zheng J, Zhou R, Cui G, Li A, Wang X, Qian L, Zhang J, Wen C. We thank the two PIs (Professor Chang C [Fudan University Shanghai Cancer Center, Shanghai] and Professor Li A [Sun Yat-Sen University Cancer Center, Guangzhou]) for the design and instruction of the study. Finally, we thank the following employees of SuperSonic Imagine for contributing to the definition of the study protocol, for training study investigators, and for ensuring the maintenance of the database: Holly Zheng, Rita Luo, Angelina Zhang, and Joel Gay for the statistical analysis. This work was funded by SuperSonic Imagine (Aix-en-Provence, France).
Supplementary materials
To illustrate the patient selection process in detail, the inclusion and exclusion criteria were supplemented as follows:
Inclusion Criteria
Patients eligible for participation in the study must:
Be female,
Be aged 18 years old or more,
Already known breast lesion that has not been treated or biopsied,
Have been referred to a breast ultrasound because of a breast mass found on at least one of the following examinations: physical palpation, mammography, ultrasound examination, or MRI.
Exclusion Criteria
The following patients must also be excluded:
Women who are unwilling or unable to provide informed consent,
Women whose breast lesions have been managed or treated or biopsied,
Women with breast implants,
Women who are pregnant or breastfeeding,
Women in whom all lesions are diagnostically categorized as Breast Imaging Reporting and Data System (BI-RADS) 0 or 6,
Women with previous ipsilateral breast surgery,
Women with no visible breast mass on ultrasound examination,
Women with multiple lesions,
Women with axillary metastatic lymph nodes only,
Women with foreign body in the breast.
In order to analyze the diagnostic performance of shear wave elastography (SWE), both qualitative and quantitative SWE features were documented. These SWE features will be described on a SWE image with default maximum display setting of 180 kPa (7.7 m/second). Here is a detailed explanation of all SWE features of interest in this study.
Aggressive and conservative reclassification rules
Rule #1
If Max Emax would be added to the BI-RADS test to help classify BI-RADS 3 and 4a masses, using the conservative reclassification rule from the BE1 study:
Downgrade BI-RADS 4a below 30 kPa
Upgrade BI-RADS 3 above 160 kPa
Rule #2
If Max Emax would be added to the BI-RADS test to help classify BI-RADS 3 and 4a masses, using the aggressive reclassification rule from the BE1 study:
Downgrade BI-RADS 4a below 80 kPa
Upgrade BI-RADS 3 above 160 kPa
Table S1 List of qualitative features acquired in ShearWave™ Elastography (SWE)
Table S2 List of quantitative features acquired in ShearWave™ Elastography (SWE)
References
- TozakiMFukumaEPattern classification of ShearWave™ Elastography images for differential diagnosis between benign and malignant solid breast massesActa Radiol201152101069107522013011
- BergWACosgroveDODoréCJShear-wave elastography improves the specificity of breast US: the BE1 multinational study of 939 massesRadiology2012262243544922282182
Author contributions
All authors contributed to data analysis, drafting and revising the article, gave final approval of the version to be published, and agree to be accountable for all aspects of the work.
Disclosure
The authors report no conflicts of interest in this work.
References
- MendelsonEBBöhm-VélezMBergWAACR BI-RADS® UltrasoundRestonVAACR BI-RADS® Atlas, Breast Imaging Reporting and Data SystemAmerican College of RadiologyMendelson EB20131153
- BakerJAKornguthPJSooMSWalshRMengoniPSonography of solid breast lesions: observer variability of lesion description and assessmentAJR Am J Roentgenol199917261621162510350302
- LazarusEMainieroMBScheppsBKoellikerSLLivingstonLSBI-RADS lexicon for US and mammography: interobserver variability and positive predictive valueRadiology2006239238539116569780
- BergWABlumeJDACRIN 6666 InvestigatorsCombined screening with ultrasound and mammography vs mammography alone in women at elevated risk of breast cancerJAMA2008299182151216318477782
- NothackerMDudaVHahnMEarly detection of breast cancer: benefits and risks of supplemental breast ultrasound in asymptomatic women with mammographically dense breast tissue. A systematic reviewBMC Cancer2009933519765317
- KolbTMLichyJNewhouseJHComparison of the performance of screening mammography, physical examination, and breast US and evaluation of factors that influence them: an analysis of 27,825 patient evaluationsRadiology2002225116517512355001
- MandelsonMTOestreicherNPorterPLBreast density as a predictor of mammographic detection: comparison of interval- and screen-detected cancersJ Natl Cancer Inst200092131081108710880551
- DaiHYanYWangPDistribution of mammographic density and its influential factors among Chinese womenInt J Epidemiol20144341240125124639441
- MariapunSLiJYipCHTaibNATeoSHEthnic differences in mammographic densities: an Asian cross-sectional studyPLoS One2015102e011756825659139
- OhuchiNSuzukiASobueTJ-START Investigator GroupsSensitivity and specificity of mammography and adjunctive ultraso-nography to screen for breast cancer in the Japan Strategic Anti-cancer Randomized Trial (J-START): a randomised controlled trialLancet20163871001634134826547101
- ShenSZhouYXuYA multi-centre randomised trial comparing ultrasound vs mammography for screening breast cancer in high-risk Chinese womenBr J Cancer20151126998100425668012
- ItohAUenoETohnoEBreast disease: clinical application of US elastography for diagnosisRadiology2006239234135016484352
- MercadoCLBI-RADS updateRadiol Clin North Am201452348148724792650
- LeeSHChangJMChoNPractice guideline for the performance of breast ultrasound elastographyUltrasonography201433131024936489
- CosgroveDOBergWABE1 Study GroupShear wave elastography for breast masses is highly reproducibleEur Radiol20122251023103222210408
- BergWACosgroveDOBE1 InvestigatorsShear-wave elastography improves the specificity of breast US: the BE1 multinational study of 939 massesRadiology2012262243544922282182
- GweonHMYoukJHSonEJKimJAClinical application of qualitative assessment for breast masses in shear-wave elastographyEur J Radiol20138211e680e68523988689
- KlotzTBoussionVKwiatkowskiFShear wave elastography contribution in ultrasound diagnosis management of breast lesionsDiagn Interv Imaging201495981382424933268
- LeeSHChangJMKimWHAdded value of shear-wave elastography for evaluation of breast masses detected with screening US imagingRadiology20142731616924955927
- YoonJHKoKHJungHKLeeJTQualitative pattern classification of shear wave elastography for breast masses: how it correlates to quantitative measurementsEur J Radiol201382122199220424041435
- HaoSYOuBLiLJCould ultrasonic elastography help the diagnosis of breast cancer with the usage of sonographic BI-RADS classification?Eur J Radiol201584122492250026349410
- MuWJZhongWJYaoJYUltrasonic elastography research based on a multicenter study: adding strain ratio after 5-point scoring evaluation or notPLoS One2016112e014833026863208
- ZhiHOuBXiaoXYUltrasound elastography of breast lesions in Chinese women: a multicenter study in ChinaClin Breast Cancer201313539240023830799
- BarrRGShear wave imaging of the breast: still on the learning curveJ Ultrasound Med201231334735022368124
- ChangJMMoonWKChoNClinical application of shear wave elastography (SWE) in the diagnosis of benign and malignant breast diseasesBreast Cancer Res Treat20111291899721681447
- EvansAWhelehanPThomsonKQuantitative shear wave ultrasound elastography: initial experience in solid breast massesBreast Cancer Res2010126R10421122101
- GarraBSCespedesEIOphirJElastography of breast lesions: initial clinical resultsRadiology1997202179868988195
- LeeEJJungHKKoKHLeeJTYoonJHDiagnostic performances of shear wave elastography: which parameter to use in differential diagnosis of solid breast masses?Eur Radiol20132371803181123423637
- MoonWKHuangCSShenWCAnalysis of elastographic and B-mode features at sonoelastography for breast tumor classificationUltrasound Med Biol200935111794180219767139
- ZhouJZhanWChangCBreast lesions: evaluation with shear wave elastography, with special emphasis on the “stiff rim” signRadiology20142721637224661245
- ParkJWooOHShinHSChoKRSeoBKKangEYDiagnostic performance and color overlay pattern in shear wave elastography (SWE) for palpable breast massEur J Radiol201584101943194826141224
- KoKHJungHKKimSJKimHYoonJHPotential role of shear-wave ultrasound elastography for the differential diagnosis of breast non-mass lesions: preliminary reportEur Radiol201424230531124081648
- TozakiMFukumaEPattern classification of ShearWave™ Elastography images for differential diagnosis between benign and malignant solid breast massesActa Radiol201152101069107522013011