
Abstract
Purpose
Papillary thyroid carcinoma (PTC), the most frequent type of malignant thyroid tumor, lacks novel and reliable biomarkers of patients’ prognosis. In the current study, we mined The Cancer Genome Atlas (TCGA) to develop lncRNA signature of PTC.
Patients and methods
The intersection of PTC lncRNAs was obtained from the TCGA database using integrative computational method. By the univariate and multivariate Cox analysis, key lncRNAs were identified to construct the prognostic model. Then, all patients were divided into the high-risk group and low-risk group to perform the Kaplan–Meier (K–M) survival curves and time-dependent receiver operating characteristic (ROC) curve, estimating the prognostic power of the prognostic model. Functional enrichment analysis was also performed. Finally, we verified the results of the TCGA analysis by the Gene Expression Omnibus (GEO) databases and quantitative real-time PCR (qRT-PCR).
Results
After the comprehensive analysis, a three-lncRNA signature (PRSS3P2, KRTAP5-AS1 and PWAR5) was obtained. Interestingly, patients with low-risk scores tended to gain obviously longer survival time, and the area under the time-dependent ROC curve was 0.739. Furthermore, gene ontology (GO) and pathway analysis revealed the tumorigenic and prognostic function of the three lncRNAs. We also found three potential transcription factors to help understand the mechanisms of the PTC-specific lncRNAs. Finally, the GEO databases and qRT-PCR validation were consistent with our TCGA bioinformatics results.
Conclusion
We built a three-lncRNA signature by mining the TCGA database, which could effectively predict the prognosis of PTC.
Introduction
Thyroid cancer (TC) is the most common malignant tumor of the thyroid, accounting for about 3%–4% of newly diagnosed tumors annually.Citation1 TC includes four pathological types: papillary thyroid carcinoma (PTC), follicular thyroid carcinoma, anaplastic thyroid carcinoma and medullary thyroid carcinoma.Citation2 PTC represents about 80% of TC with low malignancy and better prognosis,Citation3,Citation4 and its incidence is increasing year by year.Citation5 PTC develops slowly and can be cured by surgery, thyroid hormone therapy and 131I isotope therapy.Citation6 Most PTC patients have good prognosis with the 10-year survival rate reaching 90%.Citation7,Citation8 Because of the serious potential side effects of radioactive iodine and patients’ neglect of the PTC prognosis, some PTC patients suffer from recurrence and some PTCs may develop distant metastases with high mortality. Therefore, to improve the long-term survival time, prevent PTC deterioration and reduce the recurrence incidence, the novel and reliable biomarkers are important for proper treatment and the prognosis of PTC patients.
Long noncoding RNAs (lncRNAs) are conservative with more than 200 nucleotides in length, having no significant protein-coding capacity.Citation9 Nowadays, lncRNAs have become a hot topic in genetic research and plays an important role in many life activities, such as the dosage compensation effect, epigenetic regulation, cell cycle regulation and cell differentiation regulation. Moreover, increasing evidence indicates that lncRNAs play a potential role as novel biomarkers for prognostic prediction in various cancers.Citation10,Citation11 It was found that a number of lncRNAs were correlated with the prognosis of PTC. Liao et alCitation12 reported that BANCR could inhibit tumorigenesis in PTC by performing quantitative real-time PCR (qRT-PCR), cell function and tumor xenograft in nude mice, suggesting that BANCR may serve as a novel prognostic marker. Lan et alCitation13 screened the genome-wide PTC to understand the expression profile and potential functions of lncRNAs. Liyanarachchi et alCitation14 observed the two lncRNAs associated with lymph node metastasis and BRAF mutation in PTC using The Cancer Genome Atlas (TCGA). Another study performed by Zhao et alCitation15 described a PTC competing endogenous RNA (ceRNA) network and found three survival-related lncRNAs in TCGA. Thus, the TCGA dataset provides a possibility for us to find prognostic biomarkers in PTC.
In the current study, the expression of lncRNAs and related information were obtained from the TCGA database. Then, we built an lncRNA signature for predicting the PTC patients’ survival time to provide a potential biomarker of PTC patients’ prognosis.
Patients and methods
TCGA dataset and sample information
Up to October 23, 2017, 503 PTC cases and 59 normal thyroid cases were obtained from the TCGA database. Inclusion criteria were as follows: 1) patients who had a pathological diagnosis of PTC and 2) patients whose expression of genes and clinical feature were available. Exclusive criteria were as follows: 1) patients who suffered from other cancers except PTC and 2) patients who did not die of PTC. Overall, this study embraced 485 eligible samples, including 430 PTC tumor cases and 55 normal thyroid cases. On the basis of the seventh American Joint Committee on Cancer (AJCC) TNM staging system, 243, 46, 89 and 52 PTC patients were in the stages I, II, III and IV, respectively. In addition, there were 214 PTC cases with lymphatic metastasis and 216 PTC cases without lymphatic metastasis.
In addition, 32 paired frozen PTC samples were obtained from Nanjing Drum Tower Hospital, including tumor tissues and adjacent normal tissues. These tissues were stored in RNAlater (GenStar BioSolutions, Beijing, People’s Republic of China) at −80°C immediately after exairesis until further use. Pathology reports and quality assessment reports were required to verify the collected samples. Informed consent agreements were signed by all patients in this study. Our study was approved by the ethics committee of Nanjing Drum Tower Hospital.
Differential analysis of expressed lncRNAs
lncRNA expression profiles (level 3) of PTC patients were obtained from the TCGA data portal, and their raw data were processed and normalized by TCGA RNASeqv2 system. Fold change >2 or <0.5, P-value <0.05 and false discovery rate (FDR) <0.05Citation16 were setup to identify significantly differentially expressed lncRNAs. Then, all samples collected in TCGA database were divided into three groups to select the intersection of lncRNAs, including PTC tumor samples and normal thyroid samples, PTC samples with lymphatic metastasis and without lymphatic metastasis, PTC samples with stage I–II and stage III–IV. Then, the intersection of lncRNAs was obtained for further analysis. shows the flowchart of bioinformatic analysis.
Construction of potential prognostic signatures
To find the prognostic lncRNAs, we performed Cox regression analysis (univariate and multivariate analysis). Then, the risk score model was constructed by corresponding coefficients of the prognostic lncRNAs: risk score = ExplncRNA1* βlncRNA1 + ExplncRNA2 * βlncRNA2 + …+ ExplncRNAn * βlncRNAn, where Exp is the expression level and β is the regression coefficient derived from the multivariate Cox regression model.
The lower the score, the lower the risk of death outcomes. In addition, all samples were divided into the low-risk score group and the high-risk score group according to the median scores. To identify the distinguishing ability of patients’ outcome, the Kaplan–Meier (K–M) survival curves were performed, and the time-dependent receiver operating characteristic (survival ROC)Citation17 curves were employed to detect the prognostic power of the risk score model. According to all eligible patients’ clinical information, the relationship between the survival time and clinical factor was evaluated using the survival analysis.
The lncRNA signature function
To investigate the function of the risk score model, we first identified the genes that were highly related to the lncRNA signature (Pearson |R|>0.6) in the TCGA. Then, the gene ontology (GO) biological processes and Kyoto Encyclopedia of Genes and Genomes pathways were analyzed using Database for Annotation, Visualization and Integrated Discovery, and we were only interested in the significant level (P-value <0.05 and FDR <0.05). Moreover, the protein–protein interaction (PPI) network was performed to analyze the inter-function among co-related genes using GENets (https://string-db.org/).Citation18
Screening of potential transcription factors
In the current study, to identify the transcription factors of the lncRNA-related genes, FunRich, an analysis tool of transcription factors, was used (http://www.funrich.org).Citation19
The lncRNA signature verification
To confirm the reliability and validity of the risk score model, we first used other cohorts from Gene Expression Omnibus (GEO) databases. The lncRNA data of PTC (GSE35570, GSE60542 and GSE33630) was obtained from the GEO database, which was based on the Platform GPL570.
Second, we used qRT-PCR to examine their actual expression in 32 pairs of PTC samples. Their total RNA was extracted using TRIzol reagent (Invitrogen, Carlsbad, CA, USA) according to the manufacturer’s protocol. After the purity was detected, reverse transcription reactions and RT-PCR were performed as per our previous studies.Citation20,Citation21 Reverse transcription reactions using StarScript II First-strand cDNA Synthesis Mix (GenStar BioSolutions) were conducted in two steps according to its specification. qRT-PCR was carried out to detect the expression levels of candidate lncRNAs with the Step One Plus™ PCR System (Applied Biosystems) using RealStar Green Fast Mixture (GenStar BioSolutions) according to the manufacturer’s protocol. The primer sequences were as follows: GAPDH: forward 5-GGGAGCCAAAAGGGTCATCA-3, reverse 5-TGATG-GCATGGACTGTGGTC-3, product size 203 bp; human PRSS3P2: forward 5-TGGGGTGGCGGATGATCTTGG-3, reverse 5-ACAGTGGGTGGTGTCAGCAGG-3, product size 128 bp; human KRTAP5-AS1: forward 5-GCCCT-GCCTTCAGCCTCCTCA-3, reverse 5-GAAACGTCGGCCTGGCCTTGT-3, product size 186 bp; human PWAR5: forward 5-GAGACTCAAAGGCAAGAACTA-3, reverse 5-TGATGTGGGTGTTGATACTGT-3, product size 462 bp. Results were normalized to the expression of GAPDH. The results of qRT-PCR were calculated by the 2−∆∆Ct method: ∆Ct = CtlncRNAs – CtGAPDH and ∆∆Ct = ∆Cttumor tissues – ∆Ctadjacent non-tumor tissues.
Statistical analysis
All data are expressed as mean ± SD. The threshold of FDR was set as 0.05 to reduce the false positives in multiple tests in bioinformatics analysis. Moreover, the threshold of P-value was set as 0.05 to evaluate the null hypothesis. The key lncRNAs were selected by univariate/multivariate Cox regression model to build the risk score model, and the predicted power was identified by K–M survival curves and survival ROC. The Student’s t-test and the paired t-test were performed to calculate the results of GEO datasets and qRT-PCR. The abovementioned analyses were conducted using SPSS 21.0 (IBM Corporation, Armonk, NY, USA).
Results
Patient characteristics
According to the inclusion and exclusion criteria, 430 patients were included in the current study. These PTC patients were 47.682±15.574 years old. Among them, there were 111 male (25.8%) and 319 (74.2%) female patients. The overall survival (OS) time was 1,195.479±945.363 days, and eleven of 430 (2.6%) PTC patients had died.
Identification of key survival-related lncRNAs
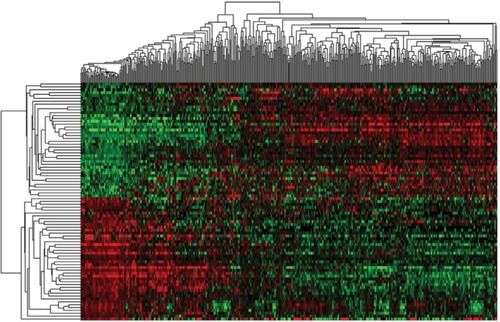
As shown in the flowchart of , 83 key lncRNAs were selected through the comparison between the four groups (tissues in stages I–II with non-lymphatic metastases, stages III–IV with non-lymphatic metastases, stages I–II with lymph node metastasis and stages III–IV with lymph node metastasis vs adjacent non-tumorous tissues; and ).
Figure 1 Cluster analysis of consistent differential lncRNA expression.
Note: Red indicates that the lncRNA has higher expression level; green indicates that the lncRNA has lower expression.
According to the correlation between 83 key lncRNAs and clinical features of 430 PTC patients, nine survival-related lncRNAs were obtained with univariate Cox regression model (). To improve the robustness of the candidate lncRNAs, three lncRNAs (PRSS3P2, KRTAP5-AS1 and PWAR5) were identified for further analysis after performing multivariate Cox regression analysis, revealing that the three lncRNAs were independent prognostic signatures ().
Table 1 Prognostic value of the differentially expressed lncRNAs by univariate Cox regression analysis
Table 2 Prognostic value of the differentially expressed lncRNAs by multivariate Cox regression analysis
Weighted by their corresponding coefficients, a three-lncRNA prognostic signature was constructed: risk score = ExpPRSS3P2 * (−1.620) + ExpKRTAP5-AS1 * (−1.742) + ExpPWAR5* 1.707.
As shown in the risk score model, the coefficient of PRSS3P2 and KRTAP5-AS1 was negative, indicating that they were positively related to the OS of PTC patients while the expression of PWAR5 was a negative factor.
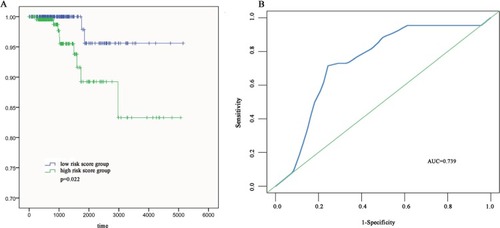
To evaluate the predicted power of the risk model, the patients were divided into two groups (high- and low-risk score groups) using the median risk score value as the cutoff (). The K–M analysis confirmed that the OS time of the low-risk score patients was 1,216.495±934.724 days and the high-risk score patients was 1,174.657±959.669 days, indicating that the risk score was significantly associated with OS (P=0.022; ). Furthermore, the three-lncRNA signature exhibited the strong predicted power of 5-year survival of the PTC patients (the area under the ROC curve was 0.739; ), suggesting that the risk score model performed good sensitivity and specificity in predicting the PTC patients’ survival.
Figure 2 Risk score analysis of the differentially expressed lncRNA signature of PTC.
Note: Survival status and duration of cases and risk score of lncRNA signature.
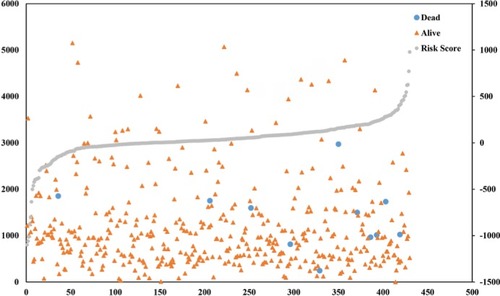
Figure 3 The three differentially expressed lncRNA signatures of PTC for the outcome.
Notes: (A) The risk score is shown by the time-dependent ROC curve for predicting 5-year survival. (B) The K–M test of the risk score for the OS.
Abbreviations: AUC, area under the curve; K–M, Kaplan–Meier; OS, overall survival; PTC, papillary thyroid carcinoma; ROC, receiver operating characteristic.
Correlation between clinical characteristics and survival time
To examine the association between the three-lncRNA signature with clinical features and survival time in PTC patients, survival analysis was performed. The results indicated that tumor stage, residual tumor, age and neoplasm cancer status could predict the poorer survival of PTC patients (). In addition, they had prognostic values, including tumor stage (area under the curve [AUC] =0.766, P=0.003), residual tumor (AUC =0.703, P=0.029), age (AUC =0.836, P=0.000) and neoplasm cancer status (AUC =0.807, P=0.010; ).
Functional assessment of the three-lncRNA signature
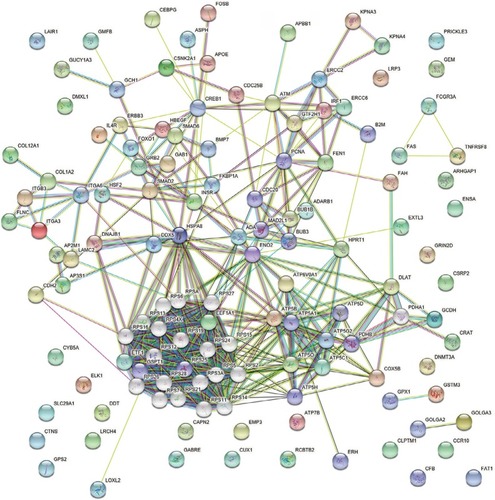
A total of 1,098 genes identified in TCGA database co-expressed with lncRNAs of the risk score model (PRSS3P2, KRTAP5-AS1 and PWAR5; |R|>0.6), including 411 genes with PRSS3P2, 90 genes with KRTAP5-AS1 and 597 genes with PWAR5, respectively. A total of 367 GO terms and 73 pathways (P-value <0.05 and an enrichment score of >1.5) were identi fied. The results showed that the top GO biological process was regulation of transcription, DNA dependent (GO:0006351) and gene expression (GO:0010467; ), and the results suggested that these genes were mainly enriched in ribosome and metabolic pathways (). The relationship and function of these genes were revealed in the PPI network ().
Figure 4 Enrichment of KEGG pathways and GO terms for co-expressed mRNAs, and the map represents the PPI network of co-expressed genes.
Note: (A and B) KEGG and GO analysis of the related genes.
Abbreviations: GO, gene ontology; KEGG, Kyoto Encyclopedia of Genes and Genomes; PPI, protein–protein interaction; NAFLD, nonalcoholic fatty liver disease.
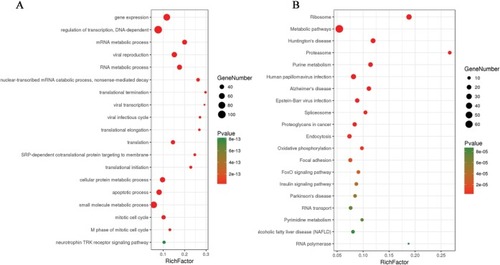
Figure 5 PPI network of mRNAs.
Abbreviation: PPI, protein–protein interaction.
Screening of potential transcription factors
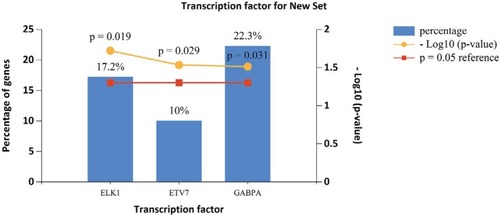
Based on the data from FunRich, the transcription factors for lncRNA co-expressed genes were ELK1, ETV7 and GABPA, which may be helpful to understand the mechanisms of the co-expressed genes of specific lncRNAs ().
Figure 6 Enriched transcription factors by lncRNA co-expressed genes.
GEO dataset and qRT-PCR verification
The expression level of these three lncRNAs is summarized in . The expression level of PRASS3P2 and PWAR5 was evidently different between the PTC tissues and the normal tissues as shown in GSE35570, GSE60542 and GSE33630. The KRTAP5-AS1 expression in PTC was significantly higher than normal tissues as shown in GSE35570 and GSE33630. The results of GEO dataset were consistent with the abovementioned TCGA results. Unfortunately, no survival information of PTC lncRNA was available in the GEO datasets.
Table 3 Expression data of three lncRNAs in GEO datasets
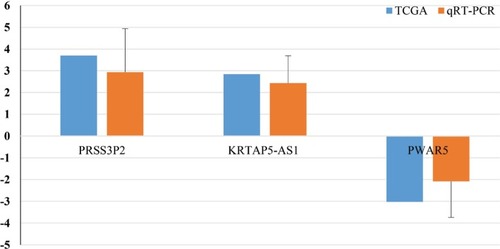
Finally, we performed the qRT-PCR to measure the actual expression of PRSS3P2, KRTAP5-AS1 and PWAR5. The results showed that PWAR5 was downregulated while PRSS3P2 and KRTAP5-AS1 were upregulated in the PTC tissues, which were consistent with the TCGA analysis ().
Figure 7 qRT-PCR validation of the three lncRNAs.
Notes: Comparison of fold change (2−∆∆Ct) of lncRNAs between TCGA and qRT-PCR results. Fold change (2−∆∆Ct) of lncRNAs of qRT-PCR results: ∆Ct = CtlncRNAs – CtGAPDH and ∆∆Ct = ∆Cttumor tissues – ∆Ctadjacent non-tumor tissues.
Abbreviations: qRT-PCR, quantitative real time PCR; TCGA, The Cancer Genome Atlas.
Discussion
TC is a common malignant endocrine disorder worldwide with increasing incidence in the past few decades. The “cancer statistics 201,821”Citation22 presented the estimated number of new cases of TC expected in America in 2018, pointing out that about 53,990 cases of TC would be expected to be diagnosed and about 2,060 patients would die of TC. PTC is the most common subtype, constituting 80%–85% of all TC cases.Citation23 In general, PTC has a relatively favorable prognosis with a high 5-year survival rate.Citation24 However, there are still about 5%–10% of patients suffering from the PTC recurrence and facing the aggressive and deathful outcomes.Citation25 Therefore, scholars are committed to find novel survival signatures of PTC. Liu et alCitation26 found that Yes-activated Protein-1 could play as the biomarker and high-risk indicator in PTC. Yi et alCitation27 analyzed the PTC data in TCGA database, suggesting that the ESR1 and ESR ratio (ESR1/ESR) could predict the female patients’ survival and has the potential to be a therapeutic target. A prospective study was performed to show that miR-146b-5p and miR-222 were significantly associated with central lymph node metastases in PTC, indicating that they were the independent predictors of PTC prognosis.Citation28 In the present study, we mined the TCGA data to obtain PTC-specific lncRNAs for predicting the patients’ survival.
To detect the PTC-specific lncRNAs, all cases were divided into four groups (stage I–II with lymphatic metastasis, stage I–II without lymphatic metastasis, stage III–IV with lymphatic metastasis and stage IV without lymphatic metastasis) of patient tumor tissues, and then they were compared with adjacent non-tumor tissues. Then, 83 key lncRNAs were selected for further studies. Among them, several studies that are closely associated with cancers have been reported. Jones et alCitation29 studied in a large sample to find that the telomerase RNA component variation promoted the increased risk of the colorectal cancer. lncRNA FER1L4 was downregulated in tumor tissues and could suppress tumor proliferation in endometrial carcinoma and gastric cancer.Citation30,Citation31 Su et alCitation32 performed the feedback loop study to find that the lncRNA FOXD2-AS1 was correlated with progression and recurrence in bladder cancer. Drawing inspiration from these cancer-specific signatures, we were interested in whether the PTC-specific lncRNAs could predict the patients’ prognosis.
After the Cox regression analysis, three prognosis-related lncRNAs (PRSS3P2, KRTAP5-AS1 and PWAR5) were obtained. It was reported that PRSS3P2, trypsinogen 6, was closely related to chronic pancreatitis.Citation33 Song et alCitation34 constructed ceRNA network of gastric cancer and claimed that lncRNA KRTAP5-AS1 could play the role of ceRNAs to regulate Claudin-4, a biomarker associated with patients’ prognosis. PWAR5, also known as PAR5, could regulate the proliferation and progression of glioma by binding to EZH2.Citation35 In addition, to validate the analyzed results from TCGA data, the expression of the abovementioned three key lncRNAs was measured using qRT-PCR. The results indicated that TCGA analysis and qRT-PCR results from 32 PTC patients were in 100% agreement. Combined with the literature and experimental results, these three PTC-specific lncRNAs had the potential to be prognostic indicators.
Then, we used these three survival-related lncRNAs to construct a three-lncRNA signature, which proved to be a prognostic biomarker of PTC. Based on the risk score model, the high-risk patients had poorer prognosis and the three-lncRNA signature could largely predict the 5-year survival time (AUC =0.739). Similarly, several studies also used the TCGA dataset to build the risk score model to explore the potential signature of PTC prognosis and diagnosis. Han et alCitation36 mined the data in the TCGA database, and then 19 significant gene pairs with high diagnostic ability were detected. Luo et alCitation37 identified a three-lncRNA signature (AC079630.2, CRNDE and CTD-2171N6.1) to predict the PTC patients’ survival. Li et alCitation38 also provided a four-lncRNA signature (RP11-536N17.1, RP11-508M8.1, AC026150.8 and CTD-2139B15.2) to improve the prognosis prediction of PTC patients. However, compared with the previous studies (Luo et al’s and Li et al’s studies), we had some advantages. First, we have considered the tumor stage and lymphatic metastasis which were closely associated with PTC prognosis to obtain the key lncRNAs for further study. Second, if the expression of genes was “0” whose patients were more than 10% of all data, they would be eliminated, which could avoid bias. Third, the power of 5-year survival prediction was detected by the survival ROC, and the risk score model had high prognostic power (AUC =0.739). Fourth, we used “FDR <0.05 and P<0.05” as the inclusion criteria.Citation39 Finally, we used GEO dataset and qRT-PCR to verify the results of TCGA analysis. We also wanted to validate the prognostic value of the three-lncRNA signature using the GEO datasets. Unfortunately, no survival information of PTC lncRNA was available in the datasets.Citation37 Therefore, the candidate lncRNAs in the risk sore model were different in our studies, and the three-lncRNA prognostic signature was credible to be a potential biomarker.
In addition, we investigated the function of the three-lncRNA signature. As shown in , the co-expressed genes were mainly associated with the DNA-dependent, gene expression, ribosome and metabolic pathways. Abnormal regulation of these functions is involved in various cancers, such as lung cancer, breast cancer, bladder cancer and colorectal cancer.Citation40–Citation43 Thus, the abnormal regulation of gene function may play a crucial role in the genesis and progress of PTC. Moreover, we identified three important transcription factors (ELK1, ETV7 and GABPA) that may significantly influence the PTC. Bullock et alCitation44 claimed that FOXE1 and ELK1 established a new regulatory pathway to regulate the TCs. Jacques et alCitation45 found that GABPA was closely associated with human thyroid tumors. However, there were no reports about the relation between ETV7 and TCs. In the future study, we can study on these three transcription factors by further research.
Finally, we analyzed the correlation between clinical characteristics and survival time. The results indicated that tumor stage, residual tumor, age and neoplasm cancer status were the risk factors of poor survival. A plenty of evidence supported our results that tumor stage, residual tumor and neoplasm cancer status were tightly bound to the poor prognosis.Citation16,Citation46,Citation47 According to AJCC, 45 years old is a common age-cutoff in PTC. (https://emedicine.medscape.com/article/2006643-overview).Citation48,Citation49 In the current study, the PTC patients aged <45 years have longer survival time, indicating that the younger the PTC patients are, the better the prognosis they had.
Conclusion
By mining the TCGA data, we built a three-lncRNA signature, which could effectively predict the prognosis of PTC. Nevertheless, the present study has some limitations. First, there were only eleven dead PTC cases in the TCGA dataset, which might cause bias to obtain the correct results. Second, the samples of TCGA mostly were white people, and the results should be validated in a proof test of Chinese cohort in the future. Ultimately, we hope that the three-lncRNA signature can help to predict PTC prognosis in the future.
Acknowledgments
This study was supported by the Technology Development Project of Nanjing (YKK10080) and the National Natural Science Foundation of China (81673132 and 81472939). The authors appreciate Mr Cheng Donglin for his technical assistance.
Supplementary materials
Figure S1 Flowchart of bioinformatic analysis.
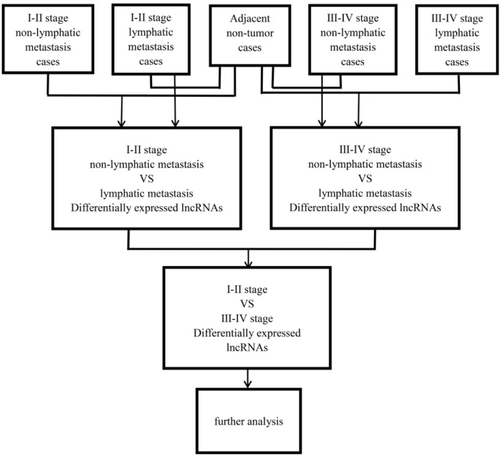
Figure S2 The K–M curves and predictive value of the risk score for clinical features.
Notes: The prognostic value of different clinical features for the OS of PTC patients. ROC curve is used to predict different clinical features.
Abbreviations: AUC, area under the curve; K–M, Kaplan–Meier; OS, overall survival; PTC, papillary thyroid carcinoma; ROC, receiver operating characteristic.
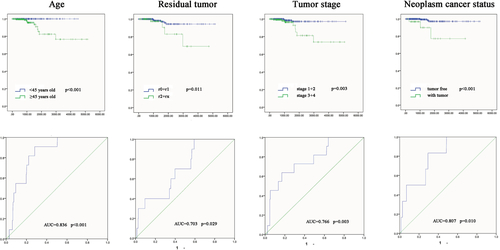
Table S1 Abnormal expression of the intersection of lncRNAs in PTC
Disclosure
The authors report no conflicts of interest in this work.
References
- LuZLChenYJJingXYWangNNZhangTHuCJDetection and identification of serum peptides biomarker in papillary thyroid cancerMed Sci Monit2018241581158729549708
- GrecoAAulettaLOrlandellaFPreclinical imaging for the study of mouse models of thyroid cancerInt J Mol Sci201718122731
- SiołekMCybulskiCGąsior-PerczakDCHEK2 mutations and the risk of papillary thyroid cancerInt J Cancer2015137354855225583358
- LimHDevesaSSSosaJACheckDKitaharaCMTrends in thyroid cancer incidence and mortality in the United States, 1974-2013JAMA2017317131338134828362912
- ChaYJKooJSNext-generation sequencing in thyroid cancerJ Transl Med201614132227871285
- BerdelouALamartinaLKlainMLeboulleuxSSchlumbergerMTUTHTYREF NetworkTreatment of refractory thyroid cancerEndocr Relat Cancer2018254R209R22329371330
- NikiforovYENikiforovaMNMolecular genetics and diagnosis of thyroid cancerNat Rev Endocrinol201171056958021878896
- QuagliarielloVArmeniaEAurilioCNew treatment of medullary and papillary human thyroid cancer: biological effects of hyaluronic acid hydrogel loaded with quercetin alone or in combination to an inhibitor of aurora kinaseJ Cell Physiol201623181784179526660542
- WuWJShenYSuiJIntegrated analysis of long non-coding RNA competing interactions revealed potential biomarkers in cervical cancer: Based on a public databaseMol Med Rep20181767845785829620291
- duLDuanWJiangXCell-free lncRNA expression signatures in urine serve as novel non-invasive biomarkers for diagnosis and recurrence prediction of bladder cancerJ Cell Mol Med20182252838284529516641
- LuoYXuanZZhuXZhanPWangZLong non-coding RNAs RP5-821D11.7, APCDD1L-AS1 and RP11-277P12.9 were associated with the prognosis of lung squamous cell carcinomaMol Med Rep20181757238724829568882
- LiaoTQuNShiRLBRAF-activated LncRNA functions as a tumor suppressor in papillary thyroid cancerOncotarget20178123824727462868
- LanXZhangHWangZGenome-wide analysis of long non-coding RNA expression profile in papillary thyroid carcinomaGene2015569110911726003293
- LiyanarachchiSLiWYanPGenome-wide expression screening discloses long noncoding rnas involved in thyroid carcinogenesisJ Clin Endocrinol Metab2016101114005401327459529
- ZhaoYWangHWuCConstruction and investigation of lncRNA-associated ceRNA regulatory network in papillary thyroid cancerOncol Rep20183931197120629328463
- SuiJXuSYHanJIntegrated analysis of competing endogenous RNA network revealing lncRNAs as potential prognostic biomarkers in human lung squamous cell carcinomaOncotarget2017839659976601829029488
- HeagertyPJLumleyTPepeMSTime-dependent ROC curves for censored survival data and a diagnostic markerBiometrics200056233734410877287
- von MeringCJensenLJSnelBSTRING: known and predicted protein-protein associations, integrated and transferred across organismsNucleic acids research11200533Database issueD43343715608232
- PathanMKeerthikumarSAngCSFunRich: An open access standalone functional enrichment and interaction network analysis toolProteomics201515152597260125921073
- SuiJLiYHZhangYQIntegrated analysis of long non-coding RNA-associated ceRNA network reveals potential lncRNA biomarkers in human lung adenocarcinomaInt J Oncol20164952023203627826625
- YangSSuiJLiangGDiagnosis value of aberrantly expressed microRNA profiles in lung squamous cell carcinoma: a study based on the Cancer Genome AtlasPeerJ20175e410129204322
- SiegelRLMillerKDJemalACancer statistics, 2018CA Cancer J Clin201868173029313949
- LiangJCaiWFengDGenetic landscape of papillary thyroid carcinoma in the Chinese populationJ Pathol2018244221522629144541
- GambardellaCTartagliaENunziataAClinical significance of prophylactic central compartment neck dissection in the treatment of clinically node-negative papillary thyroid cancer patientsWorld J Surg Oncol201614124727644091
- HaugenBRAlexanderEKBibleKC2015 American thyroid association management guidelines for adult patients with thyroid nodules and differentiated thyroid cancer: the american thyroid association guidelines task force on thyroid nodules and differentiated thyroid cancerThyroid2016261113326462967
- LiuZZengWMaimaitiYHigh expression of yes-activated protein-1 in papillary thyroid carcinoma correlates with poor prognosisAppl Immunohistochem Mol Morphol20171
- YiJWKimSJKimJKJwYKimJKUpregulation of the ESR1 gene and ESR ratio (ESR1/ESR2) is associated with a worse prognosis in papillary thyroid carcinoma: the impact of the estrogen receptor α/β expression on clinical outcomes in papillary thyroid carcinoma patientsAnn Surg Oncol201724123754376228124274
- HanPAKimHSChoSAssociation of BRAF V600E mutation and microRNA expression with central lymph node metastases in papillary thyroid cancer: a prospective study from four endocrine surgery centersThyroid201626453254226950846
- JonesAMBeggsADCarvajal-CarmonaLTERC polymorphisms are associated both with susceptibility to colorectal cancer and with longer telomeresGut201261224825421708826
- QiaoQLiHLncRNA FER1L4 suppresses cancer cell proliferation and cycle by regulating PTEN expression in endometrial carcinomaBiochem Biophys Res Commun2016478250751227381864
- XiaTChenSJiangZLong noncoding RNA FER1L4 suppresses cancer cell growth by acting as a competing endogenous RNA and regulating PTEN expressionSci Rep201551344526306906
- SuFHeWChenCThe long non-coding RNA FOXD2-AS1 promotes bladder cancer progression and recurrence through a positive feedback loop with Akt and E2F1Cell Death Dis20189223329445134
- RygielAMBeerSSimonPGene conversion between cationic trypsinogen (PRSS1) and the pseudogene trypsinogen 6 (PRSS3P2) in patients with chronic pancreatitisHum Mutat201536335035625546417
- SongYXSunJXZhaoJHNon-coding RNAs participate in the regulatory network of CLDN4 via ceRNA mediated miRNA evasionNat Commun20178128928819095
- WangXPShanCDengXLLiLYMaWLong non-coding RNA PAR5 inhibits the proliferation and progression of glioma through interaction with EZH2Oncol Rep20173853177318629048683
- HanLOLiXYCaoMMCaoYZhouLHDevelopment and validation of an individualized diagnostic signature in thyroid cancerCancer Med2018741135114029522282
- LuoYHLiangLHeRQRqHRNA-sequencing investigation identifies an effective risk score generated by three novel lncRNAs for the survival of papillary thyroid cancer patientsOncotarget2017843741397415829088774
- LiQLiHZhangLZhangCYanWWangCIdentification of novel long non-coding RNA biomarkers for prognosis prediction of papillary thyroid cancerOncotarget2017828461364614428545026
- KulkarniASBrutsaertEFAnghelVMetformin regulates metabolic and nonmetabolic pathways in skeletal muscle and subcutaneous adipose tissues of older adultsAging Cell2018172e12723
- KleinCDokicIMairaniAOvercoming hypoxia-induced tumor radioresistance in non-small cell lung cancer by targeting DNA-dependent protein kinase in combination with carbon ion irradiationRadiat Oncol201712120829287602
- KordeLALusaLMcshaneLGene expression pathway analysis to predict response to neoadjuvant docetaxel and capecitabine for breast cancerBreast Cancer Res Treat2010119368569920012355
- WongYHLiCWChenBSEvolution of network biomarkers from early to late stage bladder cancer samplesBiomed Res Int2014201415907825309904
- FanXRaoJZhangZMacranthoidin B modulates key metabolic pathways to enhance ROS generation and induce cytotoxicity and apoptosis in colorectal cancerCell Physiol Biochem20184641317133029689551
- BullockMLimGLiCThyroid transcription factor FOXE1 interacts with ETS factor ELK1 to co-regulate TERTOncotarget2016752859488596227852061
- JacquesCFontaineJFFrancBDeath-associated protein 3 is overexpressed in human thyroid oncocytic tumoursBr J Cancer2009101113213819536094
- MiaoYSuiJXuSYLiangGYPuYPYinLHSyXYpPComprehensive analysis of a novel four-lncRNA signature as a prognostic biomarker for human gastric cancerOncotarget2017843750077502429088841
- ShuklaSEvansJRMalikRDevelopment of a RNA-seq based prognostic signature in lung adenocarcinomaJ Natl Cancer Inst20171091djw200
- NixonIJKukDWreesmannVDefining a valid age cutoff in staging of well-differentiated thyroid cancerAnn Surg Oncol201623241041526215199
- EdgeSBComptonCCThe American Joint Committee on Cancer: the 7th edition of the AJCC cancer staging manual and the future of TNMAnnals of surgical oncology620101761471147420180029