
Abstract
Background
Hepatocellular carcinoma (HCC) is an aggressive malignancy with high incidence rate and poor prognosis. Enolase-1 (ENO1), a key glycolytic enzyme, has been implicated in the tumorigenesis of various cancers. However, its diagnostic value and clinical significance in HCC are unclear.
Methods
Data of 374 HCC tissues and 50 nontumor tissues were retrieved from The Cancer Genome Atlas database, and the expression level of ENO1 mRNA in HCC was evaluated. In addition, a meta-analysis of 12 HCC cohorts deposited in the Gene Expression Omnibus database was conducted to determine ENO1 expression levels. The diagnostic power of ENO1 in distinguishing HCC tissues from non-HCC tissues was confirmed by receiver operating characteristic (ROC) curve analysis. A tissue microarray comprising 93 HCC specimens and 87 adjacent normal specimens was used to validate ENO1 expression, and its prognostic value in HCC was ascertained by Kaplan–Meier analysis and Cox regression models. In addition, the gene set enrichment analysis was performed to predict the molecular mechanism of ENO1 action in HCC.
Results
ENO1 was overexpressed in HCC tissues and associated with worse outcomes in terms of overall survival (OS) (P<0.01) and disease-free survival (P<0.01). ENO1 expression (P<0.01) was an independent prognostic variable for the OS of HCC patients. Moreover, as per the ROC curve analysis, it had good diagnostic power as well. In addition, elevated expression of ENO1 was significantly correlated with the cell cycle and DNA replication pathway, consistent with its association with pro-proliferative genes such as MKI67, PCNA, CDK4, CDK2, and MELK.
Conclusion
ENO1 was markedly upregulated and was an oncogene-associated protein in HCC. It is a promising prognostic and diagnostic biomarker for HCC.
Introduction
Hepatocellular carcinoma (HCC) is the fifth most common human malignancy and the third leading cause of cancer-related deaths worldwide.Citation1–Citation3 Despite the recent advances in therapeutic strategies such as surgical resection, orthotropic liver transplantation, and radio-frequency ablation, the clinical outcomes of HCC patients have not improved due to the asymptomatic nature, late diagnosis, and early metastasis of this cancer.Citation4–Citation7 Therefore, novel diagnostic and therapeutic strategies are urgently needed to improve the prognosis of HCC patients.
Enolase-1 (ENO1), one of the isoforms of enolase, is a key glycolytic enzyme.Citation8,Citation9 In addition to glucose metabolism, ENO1 is involved in autoimmune response, hypoxia endurance, and growth regulation.Citation10–Citation12 Recent studies have correlated ENO1 with tumorigenesis and cancer progressionCitation13–Citation15 and have also shown its specific involvement in multiple signaling pathways in HCC cells.Citation2,Citation16,Citation17 However, the clinical significance and diagnostic value of ENO1 in HCC remain to be elucidated.
In this study, we analyzed the HCC expression profile data from The Cancer Genome Atlas (TCGA) and Gene Expression Omnibus (GEO) databases, as well as HCC tissue microarray (TMA), and found that ENO1 mRNA and protein expression levels were higher in HCC tissues than in the adjacent normal tissues. Furthermore, high expression of ENO1 was associated with poorer overall survival (OS) rates and had reliable diagnostic value in distinguishing HCC tissues from non-HCC tissues. Taken together, ENO1 is a promising prognostic and diagnostic biomarker in HCC patients.
Materials and methods
TCGA data source
The mRNA gene expression data of 374 tumor samples and 50 adjacent normal liver samples were downloaded from TCGA HCC data set (https://tcga-data.nci.nih.gov/tcga/). The followup clinical information was available for 327 HCC patients and was utilized to analyze the correlation between ENO1 expression and clinicopathological features. The raw data were processed and analyzed by Biometric Research Branch array tools.
GEO data source
Twelve sets of microarrays – including 1,309 HCC samples and 1,442 nontumor samples – were extracted from the GEO database (http://www.ncbi.nlm.nih.gov/geo/) and used for meta-analysis to evaluate the diagnostic power of ENO1. The 12 cohorts consisted of GSE6764, GSE10143, GSE14520, GSE25079, GSE36376, GSE39791, GSE57957, GSE60502, GSE62232, GSE64041, GSE76297, and GSE84005 datasets. Their characteristics including cohort ID, RNA-seq platform, number of samples (nontumor and tumor samples), publication year, and country are summarized in .
Tissue samples
The TMA of 93 HCC specimens and 87 normal liver specimens (HLiv-HCC180Sur-10) from the regions around cancers was purchased from Outdo Biotech Company (Shanghai, China) and used to further validate ENO1 expression and the prognostic value in HCC. None of the patients whose samples were included in the TMA had received any prior chemotherapy, immunotherapy, or radiotherapy before surgery. The study was approved by the ethics committee of The First Affiliated Hospital of Zhengzhou University, Zhengzhou, China. Written informed consent of each patient was obtained.
Gene set enrichment analysis (GSEA) and scatter plot analysis
GSEA was used to determine the distribution of the individual genes of the TCGA HCC data sets. If most members of a particular data set were positively related to the expression of ENO1, with significance set at P<0.05, the set was termed associated with ENO1. The scatter plot was extracted from the Gene Expression Profiling Interactive Analysis online analysis tool (http://gepia.cancer-pku.cn/).
Statistics for meta-analysis
Stata 12.0 was used to analyze the pooled diagnostic value of ENO1 with the data from GEO data set. Evaluation of heterogeneity was assessed using ICitation2, with ICitation2>50% indicating significant heterogeneity. When heterogeneity was observed between the studies, the random effect model was used and the subgroup analysis was performed. Publication bias was determined by Begg’s funnel plot and Egger’s test.
Immunohistochemistry (IHC)
IHC was performed as previously described.Citation18 Briefly, 5-µm-thick TMA sections were dewaxed and treated with hydrogen peroxide to quench endogenous peroxidase activity, followed by overnight incubation with rabbit antihuman ENO1 antibody (1:150; Proteintech, Wuhan, China) at 4°C. The immunoreactive cells were detected by SignalStain® DAB (Cell Signaling Technology, Dancers, MA, USA) and counterstained with Hematoxylin QS (Vector Laboratories, Burlingame, CA, USA). ENO1+ cells containing brown granules were counted independently by two pathologists who were blinded to clinical parameters, and the samples were scored according to the proportion of positive cells as follows: 0, none; 1, <25%; 2, 25%–50%; 3, 51%–75%; and 4, 76%–100%. The staining intensity was scored as follows: 0, none; 1, weak; 2, moderate; and 3, strong. The total staining score (range 0–12) was calculated by multiplying the two subscores, and the samples with scores 0–6 and 7–12 were classified as low expression and high expression, respectively.
Statistical analyses
The statistical analyses were performed using the GraphPad Prism software (Version 6.0; GraphPad Software, Inc., La Jolla, CA, USA) and the SPSS software (Version 23.0; IBM Corporation, Armonk, NY, USA). The Chi-squared test was used to determine the relationship between ENO1 expression levels and the clinicopathological parameters. Kaplan–Meier method was used for survival analysis. Multivariate Cox proportional hazards method was used to determine the relationship between different variables and survival. Receiver-operating characteristic (ROC) curves were used to analyze the pooled diagnostic value of ENO1 in HCC. Pearson’s correlation was used to assess the linear association between two variables. P-values less than 0.05 were considered statistically significant.
Results
ENO1 mRNA was overexpressed and correlated with poor prognosis in TCGA HCC cohort
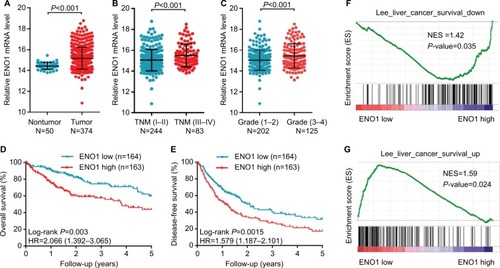
ENO1 was significantly upregulated in the HCC samples (N=374) compared to the nontumor samples (N=50) from the TCGA HCC database (P<0.001) (). Furthermore, high ENO1 expression levels were observed in patients with advanced TNM stage and poor differentiation (P<0.001) ( and ). As shown in , there was no correlation of ENO1 expression with race, age, gender, α-fetoprotein (AFP) levels, and tumor histological type. In addition, high ENO1 expression predicted poorer OS and disease-free survival in HCC patients (). Univariate and multivariate Cox regression analyses showed that ENO1 and TNM stage were independent prognostic factors for HCC patients (). In addition, the GSEA revealed that overexpression of ENO1 was correlated with gene signatures associated with poor survival (), while low expression of ENO1 was correlated with gene signatures of good survival (). Taken together, high ENO1 expression was related to tumor progression and poor prognosis of HCC patients.
Table 1 The relationship between ENO1 status and clinicopathological features of HCC
Table 2 Univariate and multivariate analyses of prognostic variables for overall survival in HCC patients
Figure 1 ENO1 mRNA was overexpressed in HCC tissues and negatively correlated with survival in TCGA cohort.
Notes: (A) ENO1 mRNA expression in normal tissues and HCC tissues. (B and C) Expression of ENO1 mRNA in patients with different TNM stages and pathological grades. Kaplan–Meier estimation of OS (D) and DFS (E) of HCC patients stratified by ENO1 expression. GSEA results showing the correlation between ENO1 expression and the genes associated with poor survival (F) and improved survival (G) in HCC patients.
Abbreviations: DFS, disease-free survival; ENO1, enolase-1; GSEA, gene set enrichment analysis; HCC, hepatocellular carcinoma; NES, normalized enrichment score; OS, overall survival.
ENO1 expression in HCC was validated by meta-analysis of GEO database HCC microarrays
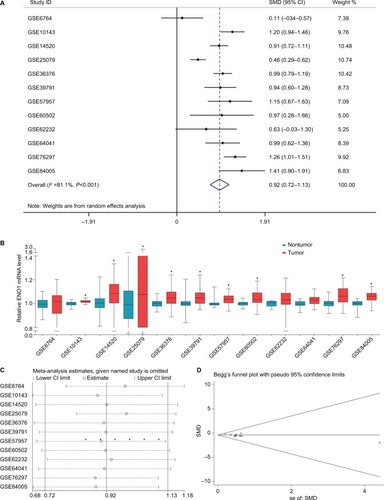
To further verify the expression of ENO1 in HCC, 12 verified microarrays from the GEO HCC database were analyzed. As shown in the forest plot (), the expression of ENO1 in HCC tissues was higher than that in the nontumor tissues (pooled standard mean difference [SMD]=0.92, 95% CI=0.72–1.13, P<0.001) under a random effect model and the results were also obtained using the Chi-squared test (). The sensitivity analysis revealed no significant differences among the included studies (). The funnel plots were basically symmetric (Begg’s P=0.837, Egger’s P=0.539), indicating no significant publication bias (). Subgroup analysis suggested that the heterogeneity was partially from different regions and sample sizes of the included cohorts ( and ).
Figure 2 The expression of ENO1 was markedly increased in HCC tissues and showed high diagnostic value in GEO data set.
Notes: (A) Forest plot evaluating differences in ENO1 expression between HCC and normal tissues. The high and low ENO1-expressing tissues were regarded as the experimental and control groups, respectively. (B) ENO1 expression in HCC and normal tissues. (C) Sensitivity analysis of HRs was calculated by omitting each microarray in turn. (D) Funnel plot for the publication bias test of GEO microarrays. Each point represents a single microarray.
Abbreviations: ENO1, enolase-1; GEO, Gene Expression Omnibus; HCC, hepatocellular carcinoma; SMD, standard mean difference.
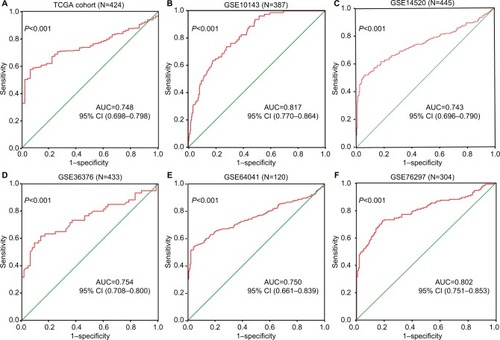
ROC curve analysis was used to determine the diagnostic value of ENO1 in distinguishing HCC tissues from non-HCC tissues. The area under the curve (AUC) of the TCGA HCC cohort was 0.748 (95% CI: 0.698–0.798, P<0.001) with a sensitivity of 0.897 and a specificity of 0.744 (). The AUCs of different GEO data sets were as follows: GSE10143, 0.817 (95% CI: 0.770–0.864, P<0.001; ); GSE14520, 0.743 (95% CI: 0.696–0.790, P<0.001; ); GSE36376, 0.754 (95% CI: 0.708–0.800, P<0.001; ); GSE64041, 0.750 (95% CI: 0.661–0.839, P<0.001; ); and GSE76297, 0.813 (95% CI: 0.710–0.916, P<0.001; ). The respective specificities of different data sets were 0.821, 0.941, 0.959, 0.862, and 0.897, and the sensitivities were 0.638, 0.516, 0.538, 0.617, and 0.744, respectively. Taken together, ENO1 was a reliable diagnostic marker in HCC.
Figure 3 ROC curves for evaluating the diagnostic power of ENO1 in HCC.
Notes: (A) TCGA cohort. (B) GSE10143. (C) GSE14520. (D) GSE36376. (E) GSE64041. (F) GSE76297.
Abbreviations: AUC, area under the curve; ENO1, enolase-1; HCC, hepatocellular carcinoma; ROC, receiver-operating characteristic; TCGA, The Cancer Genome Atlas.
ENO1 protein was upregulated and related to the poor prognosis in HCC TMA cohort
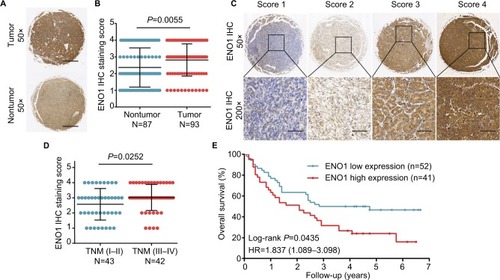
We also measured the in situ levels of ENO1 protein in the HCC TMA cohort. Consistent with the results obtained with the TCGA and GEO HCC data sets, ENO1 protein was highly expressed in HCC tissues () and was associated with advanced TNM stage (). Furthermore, patients with high levels of ENO1 protein had shorter OS than those with low expression (). Collectively, ENO1 is a potential biomarker for HCC prognosis.
Figure 4 High expression of ENO1 protein was negatively correlated with survival.
Notes: (A) Representative ENO1 staining in HCC and normal tissues. (B) Increased expression of ENO1 in HCC tissues (P=0.0055). (C) Representative images of ENO1 staining in HCC tissues. (D) Increased expression of ENO1 in advanced TNM stage (P=0.0252). (E) Kaplan–Meier analysis showing the correlation between ENO1 expression levels and OS of 93 HCC patients.
Abbreviations: ENO1, enolase-1; HCC, hepatocellular carcinoma; IHC, immunohistochemistry; OS, overall survival.
Potential molecular mechanism of ENO1-mediated progression of HCC
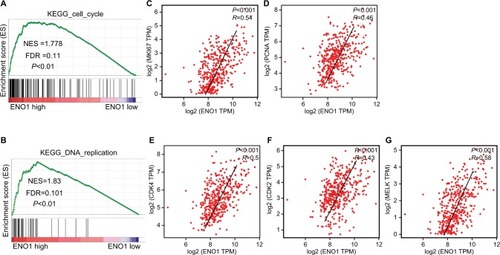
Based on the TCGA HCC data, we further predicted the potential mechanism of ENO1 action in HCC using GSEA and found a significant correlation between high ENO1 expression and DNA replication and cell cycle. Scatter plot analysis showed a significant positive correlation between ENO1 expression level and the genes involved in cell cycle and DNA replication (), such as MKI67 (P<0.001, R=0.54; ), PCNA (P<0.001, R=0.46; ), CDK4 (P<0.001, R=0.5; ), CDK2 (P<0.001, R=0.43; ), and MELK (P<0.001, R=0.58; ), indicating that ENO1 contributed to the poor prognosis of HCC likely through driving HCC cells’ proliferation.
Figure 5 Molecular mechanism of ENO1 action in HCC.
Notes: GSEA of the relationship between high ENO1 expression and genes associated with cell cycle (KEGG_cell_cycle) (A), and DNA replication (KEGG_DNA_ replication) (B). The scatter plot of the linear association between ENO1 expression level and MKI67 (C), PCNA (D), CDK4 (E), CDK2 (F), and MELK (G).
Abbreviations: ENO1, enolase-1; ES, enrichment score; FDR, false discovery rate; GSEA, gene set enrichment analysis; HCC, hepatocellular carcinoma; NES, normalized enrichment score; TPM, transcripts per millions.
Discussion
HCC represents more than 90% of primary liver cancers and has an overall poor prognosis.Citation19 Therefore, it is vital to dissect the molecular mechanisms underlying the initiation and progression of HCC. Recent studies showed an oncogenic function of ENO1 in various cancers, with high expression levels observed in cervical squamous cell carcinoma,Citation13 pancreatic cancer,Citation11,Citation15 breast cancer,Citation20 non-small cell lung cancer (NSCLC),Citation21 nasopharyngeal carcinoma,Citation22 and HCC.Citation16,Citation17 We analyzed the expression level of ENO1 on multiple HCC samples using the gene expression data available in TCGA and GEO HCC databases and HCC TMA. We found consistently high ENO1 expression in HCC tissues, indicating its oncogenic role in HCC.
Recent studies have correlated high expression of ENO1 in some primary cancers with tumor progression and poor prognosis. For example, Song et alCitation23 and Chen et alCitation24 reported that high expression of ENO1 was significantly correlated with poor prognosis in glioma patients. Similarly, NSCLC patients expressing relatively higher ENO1 levels in the tumors had poorer survival outcomes.Citation25 Consistent with these findings, we found that high ENO1 expression was positively correlated with the poor prognosis of HCC patients as per the TCGA and HCC TMA data. In addition, univariate and multivariate analyses showed that ENO1 expression was an independent prognostic factor in HCC.
Although previous studies had reported a potential biomarker role of ENO1 in HCC,Citation16,Citation17 no convincing evidence was available for its diagnostic power in HCC. We therefore conducted a meta-analysis on previous studies retrieved from the GEO HCC data set. The ROC curves showed satisfactory diagnostic performance, thereby substantiating that ENO1 was a reliable diagnostic marker for distinguishing HCC tissues from non-HCC tissues.
We also predicted the potential mechanism of ENO1 action in HCC using GSEA and found a significant correlation between high ENO1 expression and HCC cell cycle and DNA replication. The cell cycle is a complex and strictly controlled processCitation26 and is frequently dysregulated in tumorigenesis.Citation27–Citation29 Consistent with our results, several studies had demonstrated an important role of ENO1 in the proliferation and cell-cycle progression of various malignancies, including HCC.Citation16,Citation21,Citation30 In addition, ENO1 expression was positively correlated with that of MKI67, PCNA, CDK4, CDK2, and MELK, which were involved in cell cycle and DNA replication, and associated with the malignant phenotype of HCC.Citation31,Citation32
Conclusion
ENO1 is overexpressed in HCC and associated with cancer progression and poor prognosis. This is the first study to explore the value of ENO1 as a clinical biomarker in HCC and underscore its potential as a potential prognostic and diagnostic biomarker in HCC patients.
Acknowledgments
This study was supported by funds from the National Natural Science Foundation of China (81702757, 81702346, 81600506, and 81702927); the Medicine Science and Technology Research Project of Henan Province (201602032, 201702001, and 201702032); Youth innovation fund of the First Affiliated Hospital of Zhengzhou University (YNQN2017167, YNQN2017031, and YNQN2017032); Foundation of Henan Educational Committee (18A320038); The joint research fund of the First Affiliated Hospital of Zhengzhou University; and Dalian Institute of Chemical Physics Chinese Academy of Sciences (ZGR). The funding body had no role in the design of the study, collection, analysis, and interpretation of the data, or in the manuscript writing.
Supplementary materials
Figure S1 Subgroup analysis for exploring the source of heterogeneity.
Note: Subgroup analysis of the enrolled cohorts based on region (A) and sample size (B).
Abbreviation: SMD, standard mean difference.
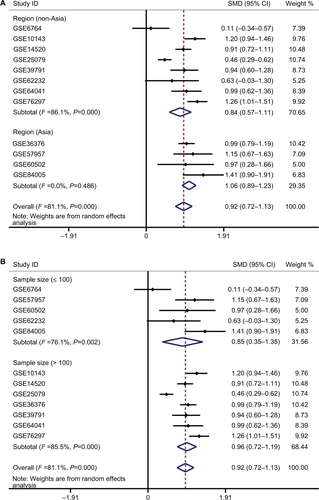
Table S1 Basic characteristics of 12 HCC cohort from GEO
Table S2 Results of subgroup analysis of the ENO1 expression in nontumor tissues and HCC samples
Disclosure
The authors report no conflicts of interest in this work.
References
- GuoWTanHYWangNWangXFengYDeciphering hepatocellular carcinoma through metabolomics: from biomarker discovery to therapy evaluationCancer Manag Res20181071573429692630
- HanLLLvYGuoHRuanZPNanKJImplications of biomarkers in human hepatocellular carcinoma pathogenesis and therapyWorld J Gastroenterol20142030102491026125132742
- ChenDZhangCLinJSongXWangHScreening differential circular RNA expression profiles reveal that hsa_circ_0128298 is a biomarker in the diagnosis and prognosis of hepatocellular carcinomaCancer Manag Res2018101275128329849467
- GuoHWuTLuQSurgical resection improves long-term survival of patients with hepatocellular carcinoma across different Barcelona Clinic Liver Cancer stagesCancer Manag Res20181036136929503583
- YuanJHYangFWangFA long noncoding RNA activated by TGF-β promotes the invasion-metastasis cascade in hepatocellular carcinomaCancer Cell201425566668124768205
- XiaoYBCaiSHLiuLLYangXYunJPDecreased expression of peroxisome proliferator-activated receptor alpha indicates unfavorable outcomes in hepatocellular carcinomaCancer Manag Res2018101781178929983595
- SafiriSKhazaeiSMansoriKAyubiEComments on “Increased risk of mortality by fibrosis stage in nonalcoholic fatty liver disease: systematic review and meta-analysis”Hepatology20176641358135928727154
- KangHJJungSKKimSJChungSJStructure of human alpha-enolase (hENO1), a multifunctional glycolytic enzymeActa Crystallogr D Biol Crystallogr200864Pt 665165718560153
- LeonardPGSataniNMaxwellDSF2312 is a natural phosphonate inhibitor of enolaseNat Chem Biol201612121053105827723749
- ChuNJArmstrongTDJaffeeEMNonviral oncogenic antigens and the inflammatory signals driving early cancer development as targets for cancer immunopreventionClin Cancer Res20152171549155725623216
- CappelloPRollaSChiarleRVaccination with ENO1 DNA prolongs survival of genetically engineered mice with pancreatic cancerGastroenterology201314451098110623333712
- SanchezTWZhangGLiJImmunoseroproteomic profiling in African American men with prostate cancer: evidence for an autoantibody response to glycolysis and plasminogen-associated proteinsMol Cell Proteomics201615123564358027742740
- QingSTulakeWRuMProteomic identification of potential biomarkers for cervical squamous cell carcinoma and human papillomavirus infectionTumour Biol2017394101042831769754710104283176975428443473
- LiuYLiHLiuYZhuZMiR-22-3p targeting alpha-enolase 1 regulates the proliferation of retinoblastoma cellsBiomed Pharmacother201810580581229913409
- PrincipeMBorgoniSCascioneMAlpha-enolase (ENO1) controls alpha v/beta 3 integrin expression and regulates pancreatic cancer adhesion, invasion, and metastasisJ Hematol Oncol20171011628086938
- TakashimaMKuramitsuYYokoyamaYOverexpression of alpha enolase in hepatitis C virus-related hepatocellular carcinoma: association with tumor progression as determined by proteomic analysisProteomics2005561686169215800975
- HamaguchiTIizukaNTsunedomiRGlycolysis module activated by hypoxia-inducible factor 1alpha is related to the aggressive phenotype of hepatocellular carcinomaInt J Oncol200833472573118813785
- HeYChenXYuYLDHA is a direct target of miR-30d-5p and contributes to aggressive progression of gallbladder carcinomaMol Carcinog201857677278329569755
- European Association for The Study of the LiverEuropean Organisation for Research and Treatment of CancerLiver EEASL-EORTC clinical practice guidelines: management of hepatocellular carcinomaJ Hepatol201256490894322424438
- GaoJZhaoRXueYRole of enolase-1 in response to hypoxia in breast cancer: exploring the mechanisms of actionOncol Rep20132941322133223381546
- FuQFLiuYFanYAlpha-enolase promotes cell glycolysis, growth, migration, and invasion in non-small cell lung cancer through FAK-mediated PI3K/AKT pathwayJ Hematol Oncol201582225887760
- YangJZhouMZhaoRIdentification of candidate biomarkers for the early detection of nasopharyngeal carcinoma by quantitative proteomic analysisJ Proteomics201410916217524998431
- SongYLuoQLongHAlpha-enolase as a potential cancer prognostic marker promotes cell growth, migration, and invasion in gliomaMol Cancer2014136524650096
- ChenSZhangYWangHWW domain-binding protein 2 acts as an oncogene by modulating the activity of the glycolytic enzyme ENO1 in gliomaCell Death Dis20189334729497031
- ChangGCLiuKJHsiehCLIdentification of alpha-enolase as an autoantigen in lung cancer: its overexpression is associated with clinical outcomesClin Cancer Res200612195746575417020980
- FeldtMBjarnadottirOKimbungSStatin-induced anti-proliferative effects via cyclin D1 and p27 in a window-of-opportunity breast cancer trialJ Transl Med20151313325925673
- ZhuYGuJLiYMiR-17-5p enhances pancreatic cancer proliferation by altering cell cycle profiles via disruption of RBL2/E2F4-repressing complexesCancer Lett2018412596828987387
- HillJWTansavatdiKLockettKLValidation of the cell cycle G(2) delay assay in assessing ionizing radiation sensitivity and breast cancer riskCancer Manag Res20091394821188122
- MaaloufKBaydounERizkSKefir induces cell-cycle arrest and apoptosis in HTLV-1-negative malignant T-lymphocytesCancer Manag Res20113394721448298
- OttoTSicinskiPCell cycle proteins as promising targets in cancer therapyNat Rev Cancer20171729311528127048
- LuoYHurwitzJMassaguéJCell-cycle inhibition by independent CDK and PCNA binding domains in p21Cip1Nature199537565271591617753174
- YangCKYuTDHanCYGenome-wide association study of MKI67 expression and its clinical implications in HBV-related hepatocellular Carcinoma in Southern ChinaCell Physiol Biochem20174241342135728700999