
Abstract
Background
S1 is a novel BH3 mimetic that can induce death in some types of cancer cells, such as melanoma B16, ovarian cancer SKOV3, and U251 glioma cells. S1 inhibits Bcl-2 and Mcl-1 expression and induces cancer cell apoptosis. Cancer cell survival is highly dependent on glucose. Here, we observed the effect of glucose deprivation on the apoptotic response to S1 in human cervical cancer (HeLa) cells.
Materials and methods
Earle’s balanced salt solution (EBSS) was used to simulate glucose deprivation. MTT assay was used to analyze the cell survival rate, and Hoechst 33342 dye was used to detect the apoptosis in HeLa cells. Western blotting was used to detect the expression of ER stress and autophagy relative proteins. In addition, lysosomes were observed with Lyso-Tracker staining by confocal microscopy.
Results
S1 decreased cell distribution density and survival rate, and MTT assay showed that EBSS enhanced the inhibitory effects of S1 on HeLa cell growth. Hoechst 33342 dye showed that S1 led to pyknosis, fragmentation, and strong staining in HeLa cell nuclei, and EBSS enhanced these effects. Western blotting indicated that EBSS enhanced the expression of apoptosis-related proteins (cytochrome C, caspase-3, and poly[ADP-ribose] polymerase 1) induced by S1 in HeLa cells. S1 decreased p62 expression and increased the autophagosome-associated protein LC3-II expression, which indicated that S1 induced autophagy in HeLa cells. EBSS enhanced S1-induced autophagy in HeLa cells. Furthermore, autophagy inhibitor chloroquine enhanced S1-induced apoptosis in HeLa cells.
Conclusion
These results indicate that EBSS exacerbates S1-induced autophagy and severe autophagy induced by EBSS and S1 could lead to apoptosis in HeLa cells. The results also suggest that EBSS enhances the sensitivity of HeLa cells to S1-induced apoptosis and that autophagy plays an important role in this process.
Introduction
Malignant tumor cells have abnormal energy metabolism that is characterized by aerobic glycolysis (also called the Warburg effect), which can lead to extracellular lactic acid accumulation.Citation1,Citation2 The glycolytic pathway provides ATP for cancer cells, which is helpful for cancer cell survival and invasiveness.Citation3 In recent years, much research on the treatment of malignant cancer has focused on glucose deprivation and/or blocking the glycolytic pathway.Citation4,Citation5 Some research has shown that, under conditions of glucose deprivation, cells can be induced to apoptosis by the regulation of Bcl-2 family proteins through the following pathways: 1) glycogen synthase kinase 3β phosphorylates Mcl-1 (antiapoptotic Bcl-2 family protein with BH1-4 domain) and targets Mcl-1 for proteasome-mediated degradationCitation6 and 2) AMP-activated protein kinase (AMPK) is activated, induces the transcription of Bim (apoptotic Bcl-2 family protein with BH1-3 domain), and inactivates AMPK-dependent mammalian target of rapamycin, which can inhibit Mcl-1 transcription.Citation7 Other research has shown that glucose metabolism participates in apoptotic regulation by Bcl-2 family proteins. Glucose catabolism regulates Mcl-1 protein function at the transcriptional and post-transcriptional levels.
Cancer cell survival and death are regulated by multiple factors and targets. Overexpression of antiapoptotic Bcl-2 family proteins often leads to cancer cell survival by helping the cells to avoid apoptosis. S1 is a novel BH3 mimetic compound and a Bcl-2-specific inhibitor, which can inhibit another antiapoptosis protein, Mcl-1. The chemical structure is shown in the previous study.Citation8 Cytological experiments have shown that S1 dissociates Bcl-2/Bax and Mcl-1/Bak dimers and then causes Bax to move toward mitochondria and induces caspase-3 activation, resulting in apoptosis. Our previous studies have shown that S1 inhibits the viability of melanoma B16 cells,Citation9 which might be caused by the endoplasmic reticulum (ER) and mitochondrial apoptosis pathways. In addition, S1 has inhibitory effects on human ovarian cancer cell lines SKOV3 and SKOV3/DDP (cisplatin-resistant cell line).Citation10–Citation13 S1 inhibits the growth of glioma cell line U251 and induces autophagy by inhibiting Bcl-2 and releasing Beclin 1.Citation14
In the present study, we designed a combined-efficiency program that was glucose deprivation with S1 in HeLa cells, based on the inhibitory effect of S1 on Bcl-2, and we added another treatment. HeLa cells require a lot of glucose to meet their metabolic needs. Therefore, we used Earle’s balanced salt solution (EBSS) to simulate the glucose deprivation environment and to observe the effect of glucose deprivation on the apoptotic response to S1 in HeLa cells. At the same time, we investigated the relationship between autophagy and apoptosis. Our study may provide new insights into treatment for cervical cancer.
Materials and methods
Reagents
S1 was synthesized as previously reported.Citation8 S1 was dissolved in dimethyl sulfoxide (DMSO). The autophagy inhibitors (chloroquine [CQ]), Hoechst 33342, LysoTracker, and MTT were purchased from Sigma-Aldrich Co. (St Louis, MO, USA).
Cell culture
Human cervical cancer cells (HeLa cells) were obtained from American Type Culture Collection (ATCC) (Manassas, VA, USA) and cultured in Iscove’s modified Dulbecco’s media (IMDM) (Thermo Fisher Scientific, Waltham, MA, USA) supplemented with 10% (v/v) FBS (Thermo Fisher Scientific) at 37°C with 5% CO2. When S1 was used to treat the HeLa cells, the concentration was 10 μM/L in IMDM. The antibody against Bcl-2 (1:500, rabbit) and LC3 (1:500, rabbit) was purchased from Abcam (Cambridge, MA, USA). The antibody against Bax (1:100, mouse) and Atg 12 (1:100, rabbit) was purchased from Santa Cruz Biotechnology Inc. (Dallas, TX, USA). The antibody against caspase-3 (1:500, rabbit) was purchased from Cell Signaling (Beverly, MA, USA). The antibody against Beclin (1:100, mouse) was purchased from BD Biosciences (San Jose, CA, USA).
Cell culture under glucose deprivation
Human cervical cancer cells (HeLa cell) were cultured in Earle’s balanced salt solution (EBSS) with 10% (v/v) FBS at 37°C with 5% CO2. When the HeLa cells were treated with S1 and EBSS, S1 was added to EBSS and the final concentration was 10 μM/L in EBSS.
Cell viability assays
Cell viability was determined by MTT assays. Cells were plated at 1×10⁴/well in 96-well plates and exposed to different concentrations of inhibitors for various amounts of time. Each treatment was repeated in six separate wells. The cells were incubated at 37°C with 5% CO2, and MTT reagent (20 μL, 5 mg/mL in PBS; Sigma-Aldrich Co.) was added to each well and incubated for 4 hours. Formazan crystals were dissolved in 150 μL DMSO. Absorbance was recorded at a wavelength of 490 nm.
Western blot analysis
For the extraction of cytoplasmic proteins, cells were harvested and washed with cold PBS. Cells were centrifuged for 5 minutes at 600× g at 4°C and, then, incubated in cell lysis buffer (150 mM NaCl, 1 mM EDTA, 10 mM HEPES, 1 mM PMSF, and 0.6% NP-40). Lysates were sonicated and incubated for 15 minutes on ice and, then, centrifuged at 700× g for 10 minutes at 4°C. The supernatant was centrifuged at 14,000× g for another 30 minutes at 4°C: cytoplasmic proteins were contained within the resultant supernatant. For Western blot analysis, equivalent amounts of protein (30 μg) were separated by 10% (w/v) SDS-PAGE and transferred onto nitrocellulose membranes (Whatman, Maidstone, UK). The membranes were blocked with 5% (w/v) skim milk in buffer (10 mM Tris-HCl [pH 7.6], 100 mM NaCl, and 0.1% [v/v] Tween 20) for 1 hour at room temperature and then incubated with primary antibodies (Santa Cruz Biotechnology Inc.) overnight at 4°C, followed by incubation with horseradish peroxidase-conjugated secondary antibodies (Thermo Fisher Scientific) at 1:1,000 dilution for 2 hours at room temperature. The immunoreactive bands were visualized by the diaminobenzidine coloration method. The semiquantitation of proteins was surveyed using a Tanon GIS gel imager System.
Hoechst 33342 and LysoTracker staining
Apoptotic nuclear changes were assessed with Hoechst 33342 (Sigma-Aldrich Co.). Lysosome change was assessed with LysoTracker. Cells were cultured on coverslips overnight and, then, treated with 6 μg/mL cisplatin for 0 and 24 hours. After incubation, cells were fixed with 4% paraformaldehyde, stained with Hoechst 33342 (2 μg/mL) or LysoTracker for 30 minutes, washed with PBS, and examined using the Olympus FV1000 confocal laser microscopy.
Statistical analysis
Data are expressed as mean ± SD. Statistical analysis of the data was analyzed by one-way ANOVA. Values of P<0.05 or P<0.01 were considered statistically significant difference. Data are representative of three independent experiments performed in triplicate.
Results
Effect of glucose deprivation on inhibition of HeLa cell proliferation induced by S1
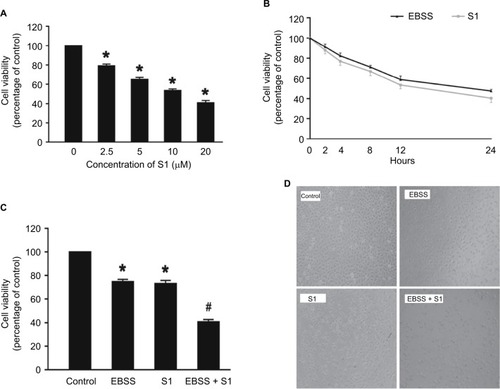
In our experiment, we treated HeLa cells with S1 (0, 2.5, 5.0, 10.0, and 20.0 μM) for 24 hours and viability was determined by the MTT assay. The results showed that cell viability decreased in a dose-dependent manner (). We selected 10 μM as the optimum concentration of S1 because the cell survival rate was closed to 50%. To observe the effect of glucose deprivation on the proliferation of HeLa cells treated with S1, EBSS was used to replace IMDM to simulate glucose deprivation. We treated HeLa cells with 10 μM S1 or EBSS, and the MTT assay showed that cell viability decreased in a time-dependent manner (). We determined whether S1 and EBSS inhibited HeLa cell proliferation. HeLa cells were treated with S1 and EBSS for 12 hours, and proliferation was decreased (). Glucose deprivation enhanced the inhibition of HeLa cell proliferation induced by S1.
Figure 1 Glucose deprivation enhances the inhibition of HeLa cell proliferation induced by S1.
Notes: (A) HeLa cells were treated with S1 (0, 2.5, 5.0, 10.0, and 20.0 µM) for 24 hours, and cell viability was determined by MTT assay. (B) HeLa cells were treated with 10 µM S1 or EBSS for different times (0, 2,4, 8, 12, and 24 hours), and then cell viability was determined by MTT assay. (C) HeLa cells were treated with 10 µM S1 and 10 µM S1 + EBSS for 12 hours, and then, cell viability was determined by the MTT assays. Data are presented as mean ± SD (n=6). *P<0.05 vs control group. (D) Optical microscopy images for HeLa cells in control, 10 µM S1, 10 µM S1, and EBSS.
Abbreviation: EBSS, Earle’s balanced salt solution.
Effects of glucose deprivation on apoptosis in HeLa cells induced by S1
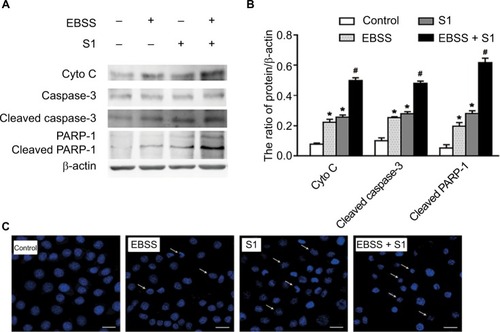
To determine if EBSS- and S1-induced cytotoxicity was mediated by apoptosis, Western blotting was used to detect apoptosis-associated proteins. Compared with the control cells, the expression of cytochrome C, cleaved caspase-3, and cleaved poly(ADP-ribose) polymerase 1 (PARP-1) was significantly increased after treatment with EBSS and S1 (10 μM) for 8 hours (). HeLa cells treated with EBSS and S1 (10 μM) for 8 hours also showed apoptotic nuclear chromatin condensation by confocal microscopy with Hoechst 33342 staining ().
Figure 2 Glucose deprivation enhances the apoptosis of HeLa cell induced by S1.
Notes: HeLa cells were treated with 10 µM S1, EBSS, and 10 µM S1 and EBSS for 8 hours. (A) The expression level of Cyto C, caspase-3, and PARP-1 was determined by Western blot. (B) Quantification of Cyto C, caspase-3, and PARP-1 levels was shown as mean ± SD (n=6). *P<0.05 vs control group. #P<0.01 vs control group. (C) Changes in nuclear morphology were observed by confocal microscopy (bar, 10 µM) with Hoechst 33342 staining.
Abbreviation: EBSS, Earle’s balanced salt solution.
Effects of glucose deprivation on S1-induced expression of proapoptotic and antiapoptotic proteins
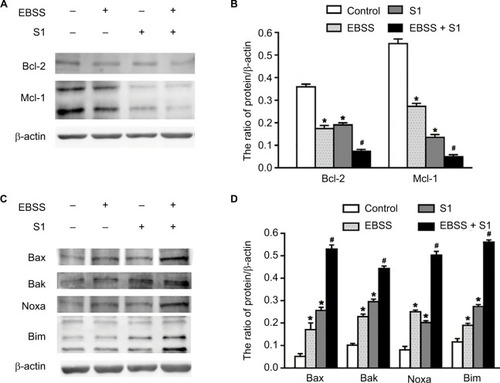
Because glucose deprivation enhanced S1-induced apoptosis of HeLa cells, we detected the expression of Bcl-2 family proteins, including proapoptotic and antiapoptotic proteins. Western blotting showed that the expression of antiapoptotic proteins such as Bcl-2 and Mcl-1 was significantly decreased in HeLa cells treated with EBSS and S1 (), whereas the expression of proapoptotic proteins such as Bak, Bax, Noxa, and Bim was significantly increased (). These results suggested that glucose deprivation increased the expression of proapoptotic proteins and decreased the expression of antiapoptotic proteins induced by S1.
Figure 3 Glucose deprivation increased the expression of proapoptotic proteins and decreased the expression of antiapoptotic proteins induced by S1.
Notes: HeLa cells were treated with 10 µM S1, EBSS, and 10 µM S1 and EBSS for 8 hours. (A and C) The expression level of Bcl-2 family proteins including proapoptotic proteins such as Bax, Bak, Noxa, and Bim and antiapoptotic proteins such as Bcl-2 and Mcl-1 was determined in each group. (B and D) Quantification of Bax, Bak, Noxa, Bim, Bcl-2, and Mcl-1 levels were shown as mean ± SD (n=3) (B). *P<0.05 vs control group. #P<0.01 vs control group.
Abbreviation: EBSS, Earle’s balanced salt solution.
Glucose deprivation enhanced S1-induced ER stress (ERS) in HeLa cells
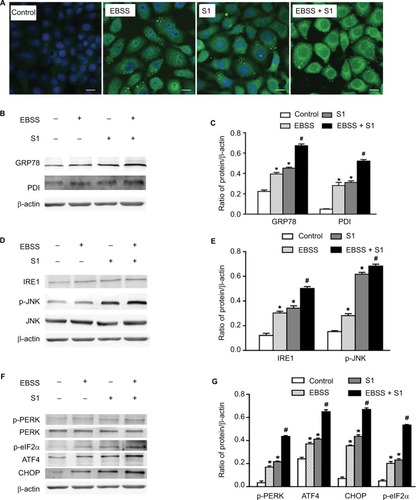
To investigate whether glucose deprivation and S1 induced ERS, HeLa cells were treated with EBSS, S1, or EBSS and S1 for 8 hours. We detected fluorescence changes in glucose-regulated protein-78 (Grp78) using the laser confocal microscopy. Compared with the control group, the expression of GRP78 was significantly increased in treated HeLa cells (). We detected the expression level of GRP78 and protein disulfide isomerase (PDI), which served as ERS marker proteins. Western blotting showed that the expression of GRP78 and PDI increased significantly (), which suggested that both glucose deprivation and S1 induced ERS. Western blotting also showed the upregulation of ERS-related proteins such as phospho-protein kinase R-like endoplasmic reticulum kinase (p-PERK) and inositol-requiring enzyme-1α (IRE1) () and increased the expression of some downstream factors phospho-eukaryotic initiation factor 2α (p-eIF2α), PERK, activating transcription factor 4 (ATF4), the growth-arrest-and DNA-damage-inducible gene 153/C/EBP homology protein (GADD153/CHOP), c-Jun N-terminal kinases (JNK), and p-JNK in the major unfolded protein response pathways. This indicated activation of the PERK and IRE1 pathways in HeLa cells. The combined action of EBSS and S1 enhanced the increased expression of ERS-related proteins, which may have affected the expression and activity of the related Bcl-2 family proteins that regulate apoptosis in HeLa cells.
Figure 4 Glucose deprivation enhances the ERS in HeLa cell induced by S1.
Notes: HeLa cells were treated with 10 µM S1, EBSS, and 10 µM S1 and EBSS for 8 hours. (A) The expression of GRP78 was detected by confocal microscopy (bar, 10 µm). (B) The expression of PDI and GRP78 was detected by the Western blot. (C) Quantification of PDI and GRP78 levels. Data are presented as mean ± SD (n=3). (D) The expression of IRE, JNK, and p-JNK was detected by the Western blot. (E) Quantification of IRE, JNK, and p-JNK levels. Data are presented as mean ± SD (n=3). (F) The expression of PERK, p-PERK, p-eIF2α, ATF4, and CHOP was detected by the Western blot. (G) Quantification of PERK, p-PERK, p-eIF2α, ATF4, and CHOP levels. Data are presented as mean ± SD (n=3). *,#P<0.05 vs control group. #P<0.01 vs control group.
Abbreviations: EBSS, Earle’s balanced salt solution; ERS, endoplasmic reticulum stress.
Effects of glucose deprivation on S1-induced autophagy in HeLa cells
Our previous studies have shown that S1 induces apoptosis and autophagy.Citation10,Citation12–Citation14 Autophagy plays an important role in tumor cell death: moderate autophagy has a protective role in tumor cells, but severe autophagy enhances apoptosis. Therefore, we investigated the effect of glucose deprivation on S1-induced autophagy. HeLa cells were treated with EBSS, S1, or EBSS and S1 for 8 hours, and the expression of LC3-II/I, Beclin 1, Atg12–5 complex, and p62 was determined by Western blotting. Compared with the control group, the expression of autophagy-related proteins LC3-II/I, Beclin 1, and Atg12–5 complex was increased significantly and the expression of p62 was decreased significantly in HeLa cells treated with S1 and EBSS ().
Figure 5 Glucose deprivation enhances the autophagy in HeLa cell induced by S1.
Notes: HeLa cells were treated with 10 µM S1, EBSS, and 10 µM S1 and EBSS for 8 hours. (A) The expression of LC3-II, P62, Beclin 1, and Atg12–5 was determined by Western blot. (B) Quantification of P62 and LC3-II, Beclin 1, and Atg12–5 levels. Data are presented as mean ± SD (n=3). *P<0.05 vs control group. #P<0.01 vs control group. (C) The expression of LC3 was detected by confocal microscopy (bar, 10 µm). (D) Lysosome was observed with LysoTracker staining by confocal microscopy (bar, 10 µm).
Abbreviation: EBSS, Earle’s balanced salt solution.
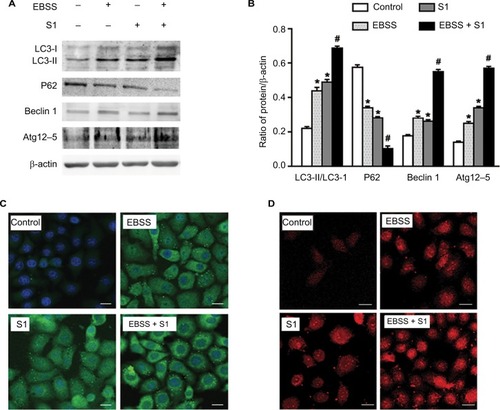
We detected fluorescence of the autophagy marker LC3 using the laser confocal microscopy. LC3 puncta accumulation increased when cells were treated with S1 and EBSS (). Lysosomes were observed with LysoTracker staining by confocal microscopy. The number of lysosomes increased significantly in HeLa cells treated with EBSS and S1 (). These results indicated that glucose deprivation and S1 induced autophagy and glucose deprivation aggravated S1-induced autophagy in HeLa cells.
CQ strengthened apoptosis in HeLa cells treated with glucose deprivation and S1
Lysosomal inhibitor CQ is a weakly basic drug and has high affinity with lysosomes. It inhibits the fusion of autophagic vacuoles with late lysosomes and autophagosomes. To clarify the role of autophagy, HeLa cells were treated with CQ combined with EBSS and S1 for 8 hours and viability was detected by the MTT assay. CQ significantly reduced the survival of HeLa cells treated with EBSS and S1 (). This indicated that the inhibition of lysosome function significantly increased the inhibitory effect of hypoxia and S1 on HeLa cell proliferation, aggravating the damage caused by glucose deprivation and S1.
Figure 6 Autophagy inhibitor CQ increases S1-induced apoptosis in HeLa cell.
Notes: The 50 µM CQ (an inhibitor of autophagy) was used to pretreat the HeLa cell for 30 minutes, and then, HeLa cells were treated with 10 µM S1, EBSS, and 10 µM S1and EBSS for 8 hours. (A) Cell viability was determined by MTT assay in each group. Data are presented as mean ± SD (n=3). *P<0.05 vs control group. #P<0.01 vs control group. (B) The expression of LC3-II and P62 was determined by Western blot. (C) The expression of Cyto C, cleaved caspase-3, and cleaved PARP-1 was determined by Western blot. (D) Quantification of P62 and LC3-II levels. (E) Quantification of Cyto C, cleaved caspase-3, and cleaved PARP-1 levels. (F) Lysosome was observed with LysoTracker staining by confocal microscopy (bar, 10 µm). Data are presented as mean ± SD (n=3).
Abbreviations: CQ, chloroquine; EBSS, Earle’s balanced salt solution.
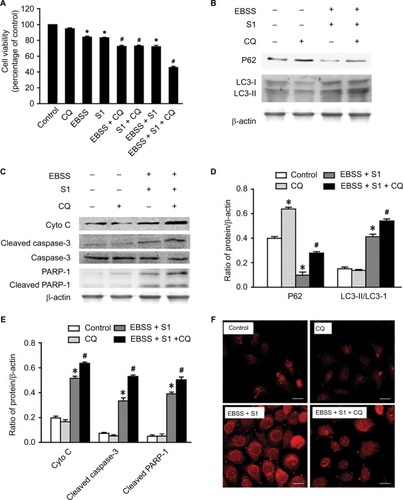
The expression of LC3 II/I and p62 was detected and analyzed by Western blotting (). Compared with the control group, CQ increased the expression of LC3-II/I and p62 protein in HeLa cells treated with EBSS and S1. This suggested that CQ interfered with the lysosomal degradation of LC3-II and p62 by inhibiting the fusion of autophagosomes and lysosomes induced by glucose deprivation and S1. This in turn affected the late stage of autophagy without affecting the early stage, which was further demonstrated by LysoTracker staining ().
To establish whether the effect of autophagy induced by EBSS and S1 was related to apoptosis, Western blotting was used to detect the expression of apoptosis-related proteins. The expression of cytochrome C, cleaved caspase-3, and cleaved PARP-1 increased significantly when HeLa cells were treated with CQ combined with EBSS and S1 (). These results indicated that S1-induced autophagy had a protective effect against apoptosis in HeLa cells.
Discussion
Cervical cancer is the most serious gynecological malignancy.Citation15,Citation16 Previously, treatment for cervical cancer has mainly been based on surgery and chemotherapy, for example, cisplatin.Citation17,Citation18 More recently, researchers have begun to focus on the abnormal energy metabolism in malignant cancer, which is characterized by aerobic glycolysis.Citation19,Citation20 Increased glycolysis provides ATP for cancer cells. Many researchers are now working on treatment for malignant cancer by focusing on glucose deprivation and/or blocking the glycolytic pathway.Citation21,Citation22
The current study is believed to provide the first evidence that glucose deprivation promotes an apoptotic response to S1 in HeLa cells. This conclusion is supported by the following findings: 1) glucose deprivation enhanced the inhibition of HeLa cell proliferation induced by S1; 2) glucose deprivation enhanced the apoptotic sensitivity to S1 in HeLa cells by inhibiting Bcl-2 and Mcl-1; and 3) glucose deprivation enhanced S1-induced autophagy in HeLa cells. Autophagy inhibitor CQ strengthened apoptosis in HeLa cells treated with S1 but weakened apoptosis in cells treated with S1 and EBSS.
Previous studies have shown that, in many cancers, one of the mechanisms involved in apoptosis evasion and treatment resistance is increased expression of antiapoptotic proteins such as Bcl-2, Mcl-1, and Bcl-xl.Citation23–Citation25 Hence, inhibition of expression of antiapoptotic proteins in the Bcl-2 family may be an effective method of cancer treatment. S1 is a novel BH3 mimetic and Bcl-2 inhibitor.Citation8 It targets Bcl-2 and Mcl-1 and activates Bax/Bak, thus inducing tumor cell apoptosis. Our previous studies have shown that S1 induces apoptosis in melanoma B16, ovarian cancer SKOV3, and U251 glioma cells.Citation14 Our present results also showed that S1 inhibited the viability of HeLa cells through promoting apoptosis.Citation26 Our results also showed that S1 inhibited the expression of Bcl-2 and Mcl-1, increased the expression of Bax and Bak, increased the ratio of Bax/Bcl-2, and enhanced the expression of cleaved caspase-3, cytochrome C, and cleaved PARP-1. These results suggest that S1 induces apoptosis in HeLa cells.
Autophagy plays an important role in tumor cell death; moderate autophagy has a protective role in tumor cells, but severe autophagy enhances apoptosis.Citation27–Citation29 This was confirmed in our present study. We detected autophagy-related proteins by Western blotting. Atg12–5 complex and LC3 are ubiquitin-like protein-binding systems that are necessary for autophagy. p62 is an adapter protein that is also necessary for autophagy. Some studies have shown that p62 is accumulated if autophagy is disrupted. We showed that the expression of autophagy-related proteins LC3-II, Beclin 1, and Atg12–5 complex was increased significantly and the expression of p62 protein was decreased significantly in HeLa cells treated with S1 and glucose deprivation, compared with control cells. This indicated that glucose deprivation and S1 induced autophagy and glucose deprivation aggravated S1-induced autophagy in HeLa cells.
Some research has shown that S1 targets antiapoptotic proteins of the Bcl-2 family and induces apoptosis, but S1 induces autophagy, which is an adaptive response in cells and might limit the effect of chemotherapy.Citation8 Our previous study showed that S1 promoted Beclin 1 release through the inhibition of Bcl-2 and induced LC3 II expression in human glioma U251 cells,Citation14 which indicated that S1 induced autophagy in U251 cells. Our present study showed that S1 induced autophagy in HeLa cells. S1 increased the aggregation of the autophagy marker protein LC3II and increased the expression of autophagy-related proteins such as Atg 12–5 complex, LC3 II, and Beclin 1.
Conclusion
We evaluated the effect of glucose deprivation on the apoptotic response to S1 in human cervical cancer (HeLa) cells. Our results indicate that EBSS exacerbates autophagy induced by S1 and severe autophagy induced by EBSS and S1 leads to apoptosis in HeLa cells. The results suggest that EBSS enhances sensitivity to S1-induced apoptosis in HeLa cells, and autophagy plays an important role in this process. In other words, glucose deprivation promotes an apoptotic response to S1 by enhancing autophagy in HeLa cells.
Abbreviations
| AMPK | = | AMP-activated protein kinase |
| ATF4 | = | activating transcription factor 4 |
| EBSS | = | Earle’s balanced salt solution |
| GADD153/CHOP | = | growth-arrest- and DNA-damage-inducible gene 153/C/EBP homology protein |
| Grp78 | = | glucose-regulated protein-78 |
| IRE1 | = | inositol-requiring enzyme-1α |
| JNK | = | c-Jun N-terminal kinases |
| PARP-1 | = | poly(ADP-ribose) polymerase 1 |
| PDI | = | protein disulfide isomerase |
| p-eIF2α | = | phospho-eukaryotic initiation factor 2α |
| PERK | = | protein kinase R-like endoplasmic reticulum kinase |
Acknowledgments
We wish to thank Dr Liankun Sun, Department of Pathology and Pathophysiology, School of Basic Medical Sciences, Jilin University, for help with the manuscript. In addition, we thank Cathel Kerr, PhD, from Liwen Bianji, Edanz Editing China (www.liwenbianji.cn/ac) for editing the English text of a draft of this manuscript. This study was funded by National Natural Science Foundation of China (81772794, 81672948, and 81472419), the 13th Five-year Science and Technology Project of Jilin Provincial Education Department (JJKH20180190KJ, JJKH20170834KJ, and JJKH20170825KJ), Jilin Provincial Research Foundation for the Development of Science and Technology Projects (20170623021TC and 20160414005GH), and the Youth Foundation of Health and Family Planning Commission of Jilin Province (2017Q025).
Disclosure
The authors report no conflicts of interest in this work.
References
- WarburgOPosenerKNegeleinEThe metabolism of carcinoma cellsJ Cancer Res192591148163
- WarburgOOn the origin of cancer cellsScience1956123319130931413298683
- PelicanoHMartinDSXuRHHuangPRhXGlycolysis inhibition for anticancer treatmentOncogene200625344633464616892078
- WalkerASinghATullyENrf2 signaling and autophagy are complementary in protecting breast cancer cells during glucose deprivationFree Radic Biol Med201812040741329649567
- XieLFengXShiYBlocking the glycolytic pathway sensitizes breast cancer to sonodynamic therapyUltrasound Med Biol20184461233124329555321
- AlvesNLDerksIABerkESpijkerRvan LierRAElderingEThe Noxa/Mcl-1 axis regulates susceptibility to apoptosis under glucose limitation in dividing T cellsImmunity200624670371616782027
- PradelliLABénéteauMChauvinCGlycolysis inhibition sensitizes tumor cells to death receptors-induced apoptosis by AMP kinase activation leading to Mcl-1 block in translationOncogene201029111641165219966861
- ZhangZSongTZhangTA novel BH3 mimetic S1 potently induces Bax/Bak-dependent apoptosis by targeting both Bcl-2 and Mcl-1Int J Cancer201112871724173520503275
- LiuYXieMSongTShengHYuXZhangZA novel BH3 mimetic efficiently induces apoptosis in melanoma cells through direct binding to anti-apoptotic Bcl-2 family proteins, including phosphorylated Mcl-1Pigment Cell Melanoma Res201528216117025324174
- XiangXYKangJSYangXCSIRT3 participates in glucose metabolism interruption and apoptosis induced by BH3 mimetic S1 in ovarian cancer cellsInt J Oncol201649277378427277143
- LiXSuJXiaMCaspase-mediated cleavage of Beclin1 inhibits autophagy and promotes apoptosis induced by S1 in human ovarian cancer SKOV3 cellsApoptosis201621222523826573276
- YangXXiangXXiaMInhibition of JNK3 promotes apoptosis induced by BH3 mimetic S1 in chemoresistant human ovarian cancer cellsAnat Rec20152982386395
- LiuNXuYSunJTThe BH3 mimetic S1 induces endoplasmic reticulum stress-associated apoptosis in cisplatin-resistant human ovarian cancer cells although it activates autophagyOncol Rep20133062677268424100381
- ZhongJTXuYYiHWThe BH3 mimetic S1 induces autophagy through ER stress and disruption of Bcl-2/Beclin 1 interaction in human glioma U251 cellsCancer Lett2012323218018722579788
- MoricePUzanCGouySVerschraegenCHaie-MederCGynaecological cancers in pregnancyLancet2012379981555856922325661
- Skrzypczyk-OstaszewiczARubachMGynaecological cancers coexisting with pregnancy - a literature reviewContemp Oncol2016203193198
- RosePGBundyBNWatkinsEBConcurrent cisplatin-based radiotherapy and chemotherapy for locally advanced cervical cancerN Engl J Med1999340151144115310202165
- WangJQWangTShiFA randomized controlled trial comparing clinical outcomes and toxicity of lobaplatin-versus cisplatin-based concurrent chemotherapy plus radiotherapy and high-dose-rate brachy-therapy for FIGO stage II and III cervical cancerAsian Pac J Cancer Prev201516145957596126320479
- de PreterGNeveuMADanhierPInhibition of the pentose phosphate pathway by dichloroacetate unravels a missing link between aerobic glycolysis and cancer cell proliferationOncotarget2016732910292026543237
- PengXGongFChenYAutophagy promotes paclitaxel resistance of cervical cancer cells: involvement of Warburg effect activated hypoxia-induced factor 1-α-mediated signalingCell Death Dis20145e136725118927
- PusapatiRVDaemenAWilsonCmTORC1-Dependent metabolic reprogramming underlies escape from glycolysis addiction in cancer cellsCancer Cell201629454856227052953
- MasuiKTanakaKIkegamiSGlucose-dependent acetylation of Rictor promotes targeted cancer therapy resistanceProc Natl Acad Sci U S A2015112309406941126170313
- LeversonJDPhillipsDCMittenMJExploiting selective BCL-2 family inhibitors to dissect cell survival dependencies and define improved strategies for cancer therapySci Transl Med20157279ra240
- DelbridgeARStrasserAThe BCL-2 protein family, BH3-mimetics and cancer therapyCell Death Differ20152271071108025952548
- UmHDHdUBcl-2 family proteins as regulators of cancer cell invasion and metastasis: a review focusing on mitochondrial respiration and reactive oxygen speciesOncotarget2016755193520326621844
- ShenLWenNXiaMCalcium efflux from the endoplasmic reticulum regulates cisplatin-induced apoptosis in human cervical cancer HeLa cellsOncol Lett20161142411241927073489
- MariñoGNiso-SantanoMBaehreckeEHKroemerGSelf-consumption: the interplay of autophagy and apoptosisNat Rev Mol Cell Biol2014152819424401948
- FernándezAOrdóñezRReiterRJGonzález-GallegoJMaurizJLMelatonin and endoplasmic reticulum stress: relation to autophagy and apoptosisJ Pineal Res201559329230726201382
- SuiXKongNYeLp38 and JNK MAPK pathways control the balance of apoptosis and autophagy in response to chemotherapeutic agentsCancer Lett2014344217417924333738