
Abstract
Purpose
Liver cancer is a high mortality disease with no curable treatments. Posttranscriptional modifications play essential roles in the occurrence and the progression of liver cancer. EIF2B5 is a subunit of EIF2B that regulates the initiation and the rate of translation and participates in several diseases including tumors. This study aims to elucidate the prognostic significance of EIF2B5 in liver cancer.
Materials and methods
We used The Cancer Genome Atlas database to analyze the expression of EIF2B5 in liver cancer. Then we used chi-squared and Fisher exact tests to test the correlation between clinical characteristics and EIF2B5 expression. Finally, we assessed the role of EIF2B5 in prognosis by Kaplan–Meier curves and Cox analysis. Gene set enrichment analysis was performed by using The Cancer Genome Atlas data set.
Results
The results showed that EIF2B5 was upregulated in liver cancer, and the expression was related to histologic grade, clinical stage, and vital status. Moreover, Kaplan–Meier curves and Cox analysis implicated that highly expressed EIF2B5 correlated with poor prognosis, and EIF2B5 was an independent risk factor for liver cancer. Gene set enrichment analysis showed that ATR and BRCA pathway, cell cycle pathway, DNA repair, myc signaling pathway, and E2F targets are differentially enriched in EIF2B5 high-expression phenotype.
Conclusion
Our results suggest that EIF2B5 participated in cancer progression and could become a biomarker for the prognosis of patients with liver cancer.
Keywords:
Introduction
Cancer is a high mortality disease and gives rise to an enormous burden all over the world. Liver cancer, as the second leading cause of cancer-related death, most frequently occurs in East and South-East Asia and Northern and Western Africa.Citation1 Despite the rapid development of medical technology, there are still no curable strategies for liver cancer patients. Therefore, identifying specific markers that evaluate the progression of liver cancer has great clinical significance.
Posttranscriptional modifications play important roles in the initiation and the progression of tumors. EIF2B is a multimeric G-protein complex that comprises five subunits, termed α to ε, and were coded by genes EIF2B1 to EIF2B5.Citation2 EIF2B plays a vital role in translation initiation and regulation.Citation3 The first disease of mutation in EIF2B was described in Vanishing White Matter syndrome (VWM), also called childhood ataxia with central nervous system hypomyelination.Citation4–Citation6 Recently, EIF2B5 has been identified as a biomarker of novel stage in colorectal cancer progression;Citation7 however, whether EIF2B5 could also be a specific marker in liver cancer remains to be elucidated.
In the present study, we have evaluated the expression of EIF2B5 in liver cancer, analyzed the relationship between EIF2B5 expression and clinical features, and explored the potential prognostic significance of EIF2B5 in patients with liver cancer. Gene set enrichment analysis (GSEA) was performed to gain further insight into the biological pathways involved in liver cancer pathogenesis related to the EIF2B5 regulatory mechanism.
Materials and methods
Data mining and collection
The data of liver cancer patients and RNA-seq expression results were downloaded with RTCGA Toolbox package in R (version 3.5.1).Citation8,Citation9 The gene microarray with survival data (GSE54236, GSE76427) was downloaded from the GEO database (https://www.ncbi.nlm.nih.gov/geo/).
Statistical analyses
SPSS software 19.0 (IBM Corporation, Armonk, NY, USA) was used for data analyzing. Boxplots were used for discrete variables to measure the expression differences, and chi-squared and Fisher exact tests were used to examine the correlation between EIF2B5 expression and clinical data. Receiver-operating characteristic curve (ROC) was drawn by pROC package to evaluate the capability of diagnosis and divide patients into high and low EIF2B5 expression groups by the optimal cutoff value of OS determined by the Youden index.Citation10 Kaplan–Meier curves were used to compare the differences in the overall survival and relapse-free survival by using survival package in R.Citation11,Citation12 Univariate Cox analysis was used to select the related variables. Then, the Multivariate Cox analysis was applied for the influence of EIF2B5 expression on the overall survival and relapse-free survival of patients.
GSEA
GSEA is a computational method that determines whether an a priori defined set of genes shows statistically significant, concordant differences between two biological states.Citation13,Citation14 In this study, GSEA was performed by using the GSEA software 3.0 from the Broad Institute. The gene expression data were RNAseq data from TCGA-LIHC. The gene set of “c2. cp.biocarta.v6.2.symbols.gmt” and “h.all.v6.2.symbols.gmt”, which summarizes and represents specific, well-defined biological states or processes, was downloaded from the Molecular Signatures Database (http://software.broadinstitute.org/gsea/msigdb/index.jsp). The normalized enrichment score (NES) was acquired by analyzing with permutations for 1,000 times. A gene set is considered to be significantly enriched when a normal P-value is <0.05 and false discovery rate (FDR) is <0.25.
Results
Patients’ characteristics
Both gene expression and clinical data of patients with liver cancer were downloaded from The Cancer Genome Atlas (TCGA) database. The total number of patients was 373. The detailed clinical characteristics, including TNM stage, survival status, and residual tumor status, are shown in .
Table 1 Clinical characteristics of the included patients
High EIF2B5 mRNA expression in liver cancer
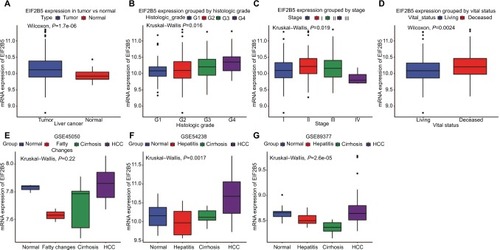
The expression analysis of EIF2B family in TCGA provides a unique insight into EIF2B5 in hepatocellular carcinoma (HCC; ). Using boxplots, we measured the differences in EIF2B5 expression in liver cancer patients and normal people. As shown in , we found that the expression of EIF2B5 in patients was higher (P=1.7e–06). Moreover, there were also different EIF2B5 expressions in the groups by histologic grade (P=0.018), stage (P=0.019), and vital status (P=0.0024; ). Of note, EIF2B5 expression of hepatitis/fatty change/cirrhosis is lower than that in normal and HCC ().
Figure 1 The different EIF2B5 expressions in the boxplot.
Notes: The expression of EIF2B5 is grouped by type (A), histologic grade (B), stage (C), and vital status (D). The EIF2B5 expression of HCC is compared with that in normal, hepatitis/fatty changes, and cirrhosis based on microarray GSE45050 (E), GSE54238 (F), and GSE89377 (G).
Abbreviation: HCC, hepatocellular carcinoma.
The diagnostic capability of EIF2B5
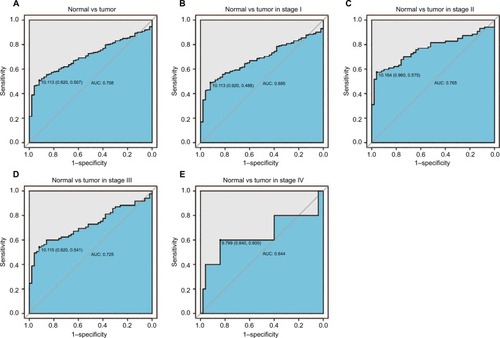
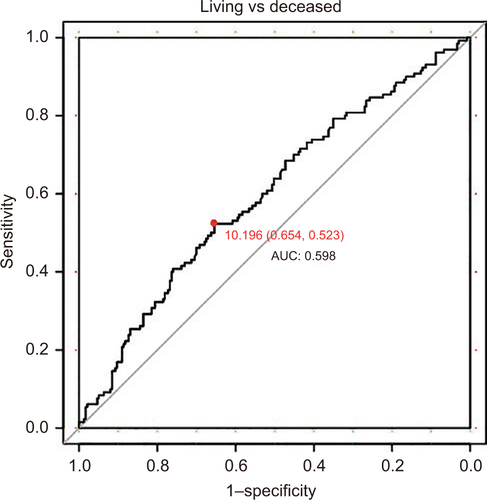
As shown in , the ROC of EIF2B was executed, and the area under the curve (AUC) was 0.708, which represented the moderate diagnostic ability. The subgroup analysis of different stages also showed modest diagnostic capability (AUC: 0.685 for stage I, 0.765 for stage II, 0.725 for stage III, 0.644 for stage IV; ). Besides, shows that the optimal cutoff value of EIF2B5 was 10.196 for the following study.
Figure 2 The ROC curve of EIF2B5 in LIHC cohort.
Notes: (A) Nontumor sample and tumor sample. (B) Nontumor sample and tumor sample of stage I. (C) Nontumor sample and tumor sample of stage II. (D) Nontumor sample and tumor sample of stage III. (E) Nontumor sample and tumor sample of stage IV.
Abbreviations: AUC, area under the curve; LIHC, liver hepatocellular carcinoma; ROC, receiver-operating characteristic curve.
The relationship between clinical features and EIF2B5 expression in liver cancer
The relationship between the clinical features and the expression of EIF2B5 was analyzed and is summarized in . The expression of EIF2B5 was highly associated with the histologic grade (P=0.003), stage (P=0.041), and vital status (P=0.0017).
Table 2 Correlation between the clinicopathologic variables and EIF2B5 mRNA expression in liver cancer
Expression of EIF2B5 is associated with the overall survival
To evaluate the prognostic effect of EIF2B5 in liver cancer patients, we used Kaplan–Meier survival curve with the log-rank test to estimate the relationship among the expression of EIF2B5, the overall survival (), and relapse-free survival (). In our results, patients with high EIF2B5 expression had a poor overall survival (P=0.00029; ). Subgroup analysis indicated that high EIF2B5 group had a poor overall survival in patients who were in histologic grade G1/G2 (P=0.0022; ), stage I/II (P=0.0026; ), or stage III/IV (P=0.0027; ). Univariate analysis selected the critical variables including EIF2B5 expression, residual tumor, clinical stage, and T classification. Multivariate analysis with the Cox proportional hazards model indicated that the expression of EIF2B5 (HR=1.76, P=0.001), residual tumor (HR=1.4, P=0.007), and T classification (HR=1.75, P=0.000) were independent prognostic factors for patients with liver cancer (). Validation of survival analysis by GSE54236 is shown in .
Table 3 Univariate and multivariate analyses of overall survival in patients with liver cancer
Figure 3 Survival analysis of EIF2B5 expression in terms of overall survival.
Notes: Kaplan–Meier curves produced survival analysis (A) and subgroup analysis of histological grade (G1/G2 and G3/G4) (B and C) and clinical stage (I/II and III/IV) (D and E). Validation group of survival analysis in GSE54236 (F).
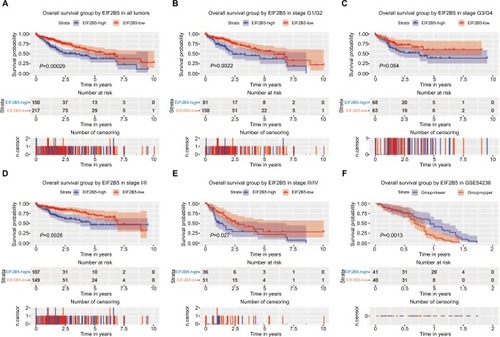
Figure 4 Survival analysis of EIF2B5 expression in terms of relapse-free survival.
Notes: Kaplan–Meier curves produced survival analysis (A) and subgroup analysis of histological grade (G1/G2 and G3/G4; B and C) and clinical stage (I/II and III/IV; D and E). Validation group of survival analysis in GSE76427 (F).
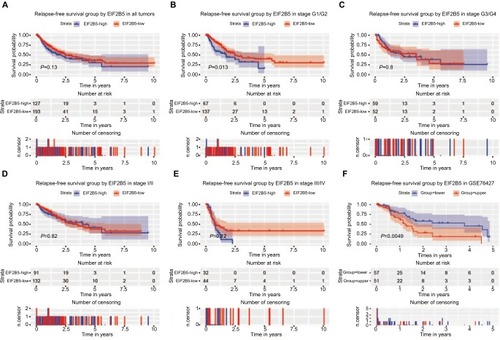
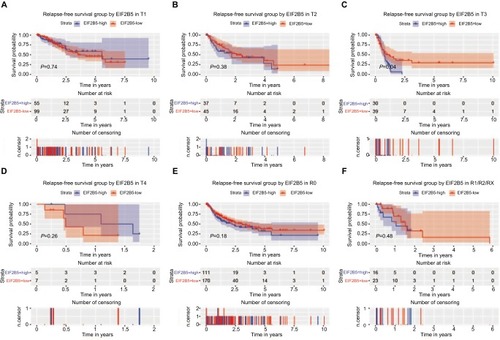
Although high EIF2B5 did not show significant prognostic value for relapse-free survival (P=0.13; ), subgroup analysis indicated that it had a significant prognostic potential for relapse-free survival in patients who were in histologic grade G1/G2 (). Univariate Cox analysis and multivariate Cox analysis indicated that EIF2B5 was an independent prognostic factor for patients who were in histologic grade G1/G2 (). Validation of survival analysis by GSE76427 is shown in .
Table 4 Univariate and multivariate analyses of relapse-free survival in patients with G1/G2 liver cancer
To further explore the subgroup survival under T classification and residual tumor, we made survival analysis in different T classifications (T1, T2, T3, and T4) and residual tumors (R0 and R1/R2/RX; and ). Significant survival differences were found in T2 for overall survival () and T3 for relapse-free survival. As for residual tumor, significant survival differences were found in R0 for both overall survival () and relapse free-survival ().
Figure 5 Survival analysis of EIF2B5 expression in terms of overall survival.
Notes: Kaplan–Meier curves produced survival analysis and subgroup analysis of T classification (T1, T2, T3, and T4; A–D) and residual (R0 and R1/R2/RX; and E, F).
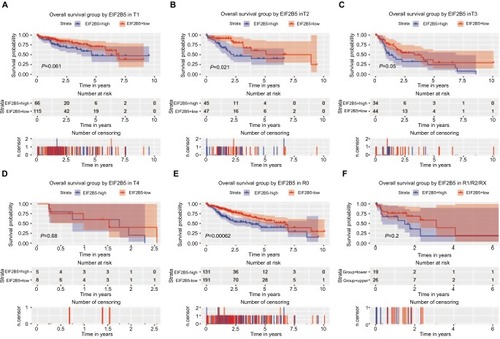
Figure 6 Survival analysis of EIF2B5 expression in terms of relapse-free survival.
Notes: Kaplan–Meier curves produced survival analysis and subgroup analysis of T classification (T1, T2, T3, and T4; A–D) and residual (R0 and R1/R2/RX; E and F).
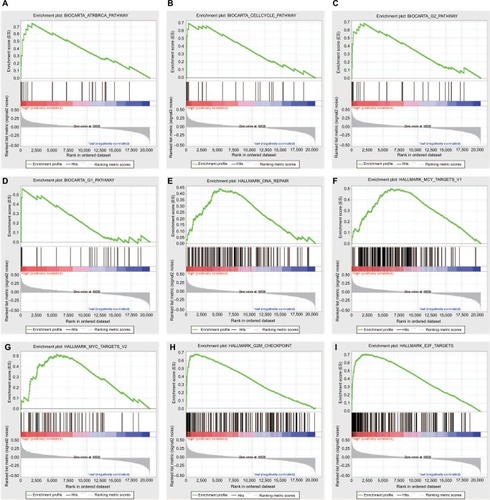
GSEA identifies an EIF2B5-related signaling pathway
To identify signaling pathways activated in liver cancer, we conducted the GSEA between low and high EIF2B5 expres sion data sets. GSEA reveals significant differences (FDR <0.25, NOM P-value<0.05) in the enrichment of MSigDB Collection (c2.cp.biocarta.v6.2.symbols.gmt and h.all. v6.2.symbols.gmt), and the details are shown in . We selected the most significantly enriched signaling pathways based on their NES (; ). shows that ATR and BRCA pathway, cell cycle pathway, DNA repair, myc signaling pathway, and E2F targets are differentially enriched in EIF2B5 high-expression phenotype.
Table 5 Gene sets enriched in phenotype high
Figure 7 Enrichment plots from GSEA.
Notes: GSEA results showing ATR and BRCA pathway (A), cell cycle pathway (B), G1 and G2 pathways (C and D), DNA repair (E) and myc signaling pathway (F and G), G2M checkpoint (H), and E2F targets (I) are differentially enriched in EIF2B5-related liver cancer.
Abbreviation: GSEA, Gene Set Enrichment Analysis.
Discussion
This study demonstrated the important role of EIF2B5 in liver cancer and found that EIF2B5 could become a biomarker for the prognosis of patients with liver cancer. We analyzed the expression of EIF2B5 in patients with liver cancer and found that the overexpression of EIF2B5 was associated with histologic grade, clinical stage, and vital status.
In the past few years, the researches on the role of EIF2B5 have focused on VWM, which was caused by the downregulation of EIF2B.Citation4,Citation6 Recently, the upregulation of EIF2B5 associated with cancer has been reported, such as human pulmonary adenocarcinoma cell and breast cancer.Citation15,Citation16 Our study found that EIF2B5 was highly expressed in liver cancer, which coordinates with other research in tumors. Interestingly, the expression of EIF2B5 was gradually increasing from G1 to G4, which suggested that EIF2B5 might be associated with cancer progression. Besides, the expression of EIF2B5 was upregulated in stage I/II and downregulated in stage III/IV, which suggested that the role of EIF2B5 might differ in different stages in liver cancer and subgroup analysis would be urgently needed. As the expression of EIF2B5 was higher in the deceased than in the living, the link between EIF2B5 and survival needs to be explored.
The functions of EIF2B5 in the tumor occurrence and growth have also been studied. Bi et al reported that the upregulation of EIF2, which was caused by ER stress, was associated with tumor growth.Citation17 Experiments also verified the results by silencing EIF2B5 gene expression and found that it could significantly inhibit the growth of pancreatic cell lines.Citation18 In our study, the role of EIF2B5 in tumor initiation and proliferation might account for the clinical association between EIF2B5 expression and T classification.
EIF2B5 is strongly associated with the prognosis of cancer patients. In ovarian cancer, minor alleles at rs4912474 could improve the prognosis of patients on account of inhibiting the angiogenesis and tumor growth.Citation19 In this study, we found that patients with high EIF2B5 expression had a poor overall survival, especially in stage I/II and histologic grade G1/G2, which might contribute to precise medicine and personalized medicine toward liver cancer. Importantly, we found that EIF2B5 was an independent prognostic factor that affected the overall survival of patients and had the potential to be a biomarker for liver cancer. Besides, there was no prognostic significance of EIF2B5 in relapse-free survival, but subgroup analysis revealed its possible appliance in G1/G2 liver cancer.
To the best of our knowledge, this study first demonstrated the important role of EIF2B5 in the prognosis of liver cancer. Our work, together with other related researches, contributed to the role of EIF2B5 in liver cancer. However, clinical trials in the future are required to verify these results and promote the application of EIF2B5 in liver cancer prognosis evaluation.
Conclusion
Our study found that the expression of EIF2B5 was significantly increased in liver cancer patients and associated with several clinical features and undesirable prognosis, so that EIF2B5 could be a useful biomarker for the prognosis of patients with liver cancer.
Supplementary materials
Figure S1 Boxplot of EIF2B family’s expression in TCGA.
Abbreviation: TCGA, The Cancer Genome Atlas.
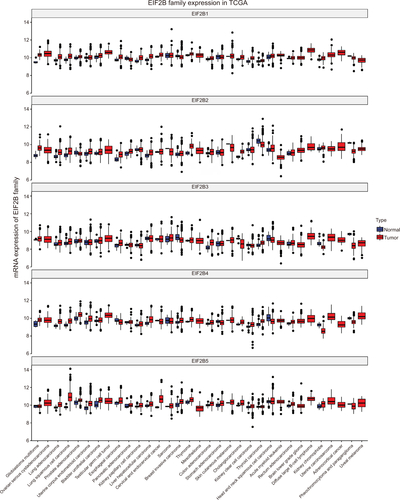
Figure S2 ROC curve to identify the optimal cutoff value for dividing patients into high and low EIF2B5 expression groups.
Abbreviations: AUC, area under the curve; ROC, receiver-operating characteristic curve.
Disclosure
The authors report no conflicts of interest in this work.
References
- TorreLABrayFSiegelRLFerlayJLortet-TieulentJJemalAGlobal cancer statistics, 2012CA Cancer J Clin20156528710825651787
- WorthamNCProudCGeIF2B: recent structural and functional insights into a key regulator of translationBiochem Soc Trans20154361234124026614666
- BugianiMBoorIPowersJMScheperGCvan der KnaapMSLeukoencephalopathy with vanishing white matter: a reviewJ Neuropathol Exp Neurol2010691098799620838246
- SchiffmannRMollerJRTrappBDChildhood ataxia with diffuse central nervous system hypomyelinationAnn Neurol19943533313408122885
- HorzinskiLGonthierCRodriguezDSchererCBoespflug-TanguyOFogliAExon deletion in the non-catalytic domain of eIF2B epsilon due to a splice site mutation leads to infantile forms of CACH/VWM with severe decrease of eIF2B GEF activityAnn Hum Genet200872Pt341041518294360
- SharmaSAjijMSinghVAnejaSVanishing white matter disease with mutations in EIF2B5 geneIndian J Pediatr2015821939525230711
- PalaniappanARamarKRamalingamSComputational identification of novel stage-specific biomarkers in colorectal cancer progressionPLoS One2016115e015666527243824
- Team RDCR: a language and environment for statistical computing. R Foundation for Statistical Computing, Vienna, AustriaComputing201211221
- SamurMKRTCGA Toolbox: a new tool for exporting TCGA Firehose dataPLoS One201499e10639725181531
- RobinXTurckNHainardApROC: an open-source package for R and S+ to analyze and compare ROC curvesBMC Bioinformatics2011127721414208
- Therneau TMA Package for Survival Analysis in S2015
- TherneauTMGrambschPMModeling survival data: extending the Cox modelTechnometrics200097457353354
- SubramanianATamayoPMoothaVKGene set enrichment analysis: a knowledge-based approach for interpreting genome-wide expression profilesProc Natl Acad Sci U S A200510243155451555016199517
- MoothaVKLindgrenCMErikssonKFPGC-1alpha-responsive genes involved in oxidative phosphorylation are coordinately downregulated in human diabetesNat Genet200334326727312808457
- XueDLuMGaoBQiaoXZhangYScreening for transcription factors and their regulatory small molecules involved in regulating the functions of CL1-5 cancer cells under the effects of macrophage-conditioned mediumOncol Rep20143131323133324366584
- YangSZhangHGuoLZhaoYChenFReconstructing the coding and non-coding RNA regulatory networks of miRNAs and mRNAs in breast cancerGene2014548161324979338
- BiMNaczkiCKoritzinskyMER stress-regulated translation increases tolerance to extreme hypoxia and promotes tumor growthEMBO J200524193470348116148948
- ShevelevaEVLandowskiTHSamulitisBKBartholomeuszGPowisGDorrRTImexon induces an oxidative endoplasmic reticulum stress response in pancreatic cancer cellsMol Cancer Res201210339240022275514
- GoodeELMaurerMJSellersTAInherited determinants of ovarian cancer survivalClin Cancer Res2010163995100720103664