
Abstract
Purpose
Most recently, circular RNAs (circRNAs) were considered playing regulatory roles in tumor initiation and development. The specific function of circRNAs in hepatocellular carcinoma (HCC) remains unknown. This study was designed to detect specific roles of a circRNA hsa_circ_0079299 in HCC.
Methods
The expression of hsa_circ_0079299 in HCC and tumor cell lines was detected using quantitative PCR (qPCR). Cell proliferation, migration, cell cycle and apoptosis after overexpression of the circRNA were measured using cell counting kit-8 (CCK8) assay, colony formation, 5-ethynyl-2′-deoxyuridine (EdU) assay, wound healing assay, transwell culture system and flow cytometry. Western blotting assay detected the protein expression of PI3K/AKT/mTOR signaling pathway and cyclin B1 (CCNB1). Overexpression of the circRNA in vivo was measured by nude mice tumorigenesis.
Results
The expression of hsa_circ_0079299 was lower in HCC tissues. Overexpression of hsa_circ_0079299 suppressed tumor growth in vitro and in vivo, retarded cell cycle progression while had no effect on cell migration and apoptosis. The inhibitory effect of hsa_circ_0079299 was partly mediated by PI3K/AKT/mTOR signaling pathway.
Conclusion
Our study shows that tumor suppressive role of hsa_circ_0079299 in HCC provides new recognition of circRNAs in cancers.
Introduction
Globally, hepatocellular carcinoma (HCC) is the fifth most common cancer with more than 850,000 new cases yearly. This neoplasm accounts for up to 90% of all primary liver cancer and is the second leading cause of cancer-related deaths.Citation1,Citation2 The prevalence of well-established risk factor hepatitis B virus (HBV) infection accounted for high rates of HCC especially in Asia and Africa.Citation3 In developed countries, another risk factor hepatitis C virus (HCV) infection increased by injection drug abuse caused elevated HCC incidence. Aflatoxin B1, cirrhosis, obesity and type 2 diabetes as less common risk factors also contributed to disease risk.Citation4 Lack of early symptoms and possessing a prolonged subclinical course, HCC was usually diagnosed at intermediated or advanced stages with limited curative approaches.Citation5,Citation6 Hepatocarcinogenesis was believed to be complex multiple processes driven by genetic alternations combined with epigenetic modifications.Citation7,Citation8 Given the poor strategies for diagnosis and treatment, new insight of molecular pathogenesis in HCC initiation is needed which might subsequently provide potential biomarker-driven treatments.
Circular RNA (circRNA) is a special class of noncoding RNAs which originates from back splicing or exon skipping of precursor mRNA templates. Over two decades ago, circRNAs were considered inert byproducts of linear RNA aberrant splicing. With the advent of high-throughput deep sequencing, the ubiquity and abundance of circRNAs were recognized.Citation9–Citation11 Recent study has shown that many circRNAs highly expressed in a cell type-specific or tissue-specific manner.Citation12
Accumulating evidence has demonstrated that circRNAs exert functions in cancer.Citation13,Citation14 circRNAs profiles in three paired of HCC have been reported by microarray and hundreds of upregulated circRNAs and downregulated circRNAs were identified. However, specific roles of different circRNAs in HCC remain unclear.
In the present study, we investigate the tumor suppressive role of hsa_circ_0079299 in HCC using human paired HCC and para-cancerous tissues. hsa_circ_0079299 was overexpressed to further explore the functions and mechanisms in tumor growth.
Materials and methods
Tissues and cell lines
We collected frozen liver samples including HCC and paired adjacent liver tissues from 42 patients undergoing liver surgical procedures. Diagnosis was confirmed by histological pathology. All patients gave consents to collect tissues. The ethics committee of Eastern Hepatobiliary Surgery Hospital approved this tissue study, and written informed consent was obtained from all patients. HCC cell lines SK-Hep-1, SMMC-7721, 7702, LM-3 and PRL-RF5 were maintained in DMEM with 10% FBS or 1640 medium with 10% FBS. All cell lines were purchased from Cell Bank of Chinese Academy of Sciences (Shanghai, China).
Plasmid construction and cell transfection
The complementary DNA (cDNA) of exon 2 (total 660 bp) was cloned by primers () from total cDNA then digested with KpnI and BamHI restriction enzymes and cloned into pCD-ciR (Geneseed, Guangzhou, China). Overexpression of hsa_circ_0079929 was verified by direct sequencing. Cells are transiently transfected with plasmids using Lipofectamine 2000 reagent (Thermo Fisher Scientific, Waltham, MA, USA). The expression of hsa_circ_0079929 in transfected cells was detected by quantitative PCR (qPCR) using specific primer pairs.
Table 1 Primers allowed for amplification of genes in this work
Total RNA isolation, RNase R treatment and real-time qPCR analysis
Total RNA was extracted from HCC tissues and cell lines using TRIzol reagent (Thermo Fisher Scientific). RNase R treatment was carried out as Panda A described previously.Citation15 When we treated with RNase R, we divided total RNA into two groups including no RNase R treatment and RNase R treatment. The first group was as common internal control when we detected hsa_circ_0079929 expression in both groups. qPCR was carried out using the SYBR Select Master Mix kit (cat. no. 4472908; Thermo Fisher Scientific).
Cell counting kit-8 (CCK8) assay
Cells were seeded at 3×10³ per well in 96-well plates after transfection and incubated for 24, 48, 72 and 96 hours, and then 10 µL of WST-8 was added to each well. A plate reader (Molecular Devices LLC, Sunnyvale, CA, USA) was used to measure the absorbance at 450 nm after 1 hour at 37°C.
Colony formation assay
Cells were seeded at 400 per well in 6-well plates after transfection and incubated for 2 weeks. Until colonies were visible with naked eyes, they were fixed with 4% paraformaldehyde for 30 minutes and stained with 0.1% crystal violet, the number of colonies was then counted.
5-ethynyl-2′-deoxyuridine (EdU) assay
Transfected cells were seeded at 8,000 per well in 96-well plates overnight. According to the manual of a EdU labeling/detection kit (Ribobio, Guangzhou, China), cells were incubated with EdU at 50 µM for 2 hours at 37°C. After EdU labeling, cells were washed with PBS and fixed with 4% paraformaldehyde for 30 minutes and incubated with 2 mg/mL glycine for 5 minutes. The cells were rinsed once with PBS of 0.5% Triton X-100 (PBS) then stained with Apollo working solution at room temperature for 30 minutes in the dark. After staining, cells were washed several times with TBS of 0.5% Triton X-100 and then stained with Hoechst at room temperature for 30 minutes in a dark place. The cells were imaged by fluorescence microscopy. The percentage of EdU-positive cells was calculated from five random fields in three wells.
Flow cytometry cell cycle analysis
Cells were seeded at 105 per well in 6-well plates after transfection, incubating plates for 24, 48, 72 and 96 hours. Cells were harvested with trypsin and washed twice with cold PBS. Then, cells were resuspended in 400 µL of propidium iodide (PI) staining solution containing 0.1 mg/mL PI and 0.02 mg/mL ribonuclease A. Samples were incubated in the dark for 30 minutes at room temperature before acquisition. Acquisition was performed on FACS Calibur flow cytometer (BD Biosciences, San Jose, CA, USA) with CellQuest software. Data analysis was performed using FlowJo software.
Wound healing assay
Cells were plated at 100% confluence after transfection. Then, monolayer cells were scratched with a 200 mL pipette tip across the central of the well. After rinsing detached cells with PBS one time, replenished with serum-free medium and took photos on microscope. Cells were incubated for another 24 hours and photos were taken for wound closure on the microscope. ImageJ was used to measure wound area.
Transwell invasion assay
To assess cell invasion ability, we used Matrigel (BD Biosciences) coated transwell inserts with 200 µL basal medium, which were resuspended 5×10⁴ cells according to manufacturer’s instructions. The lower chamber contained 600 µL completed medium with 10% FBS. Cells were incubated with another 24 hours. After wiping out cells in the upper surface of the chamber, bottom cells were fixed with 4% paraformaldehyde for 15 minutes and then stained with crystal violet.
Western blotting
Total protein was extracted from transfected cells using cell lysis buffer containing 1 mM phenylmethanesulfonyl fluoride. Nuclear protein was extracted using Nuclear and Cytoplasmic Protein Extraction Kit (Beyotime, China). Protein quantification was determined by bicinchoninic acid assay. Lysates including 30 µg protein per well were separated on 10% SDS-PAGE and transferred to polyvinylidene fluoride membranes. Blocking with 5% nonfat milk in TBST for 1 hour was followed. After washing three times with TBST, membranes were incubated with primary antibodies and secondary antibodies in turn. Primary antibodies including p85 PI3K, p-p85 PI3K AKT, p-AKT, mTOR, p-mTOR and cyclin B1 (CCNB1) were all purchased from CST. Membranes were washed three times before detecting protein bands using enhanced chemiluminescence substrate on Tanon 5200 system.
Tumorigenicity assay
Transfected cells were digested with trypsin and washed twice with PBS. Cells were resuspended in 200 µL solution containing 100 µL PBS and 100 µL Matrigel substrate at a final density of 2×10⁶ cells/0.2 mL. Four-week-old male BALB/c nude mice were subcutaneously injected with 2×10⁶ tumor cells. Tumor volume was measured every 1 week. Mice were sacrificed at day 35 since tumor cells have been injected and tumor volume was measured subsequently. Tumor volume was calculated as follows: Tumor volume = length × width2/2.Citation16 Nude mice were housed in a specific pathogen-free room. The studies of nude mice were approved by the Institutional Animal Care and Use Committee of the Soochow University, and experiments were also conducted according to the Institutional Animal Care and Use Committee of Soochow University.
Statistical analyses
Data analyses were performed using GraphPad Prism 7.0 software. We performed all experiments at least three times using transfected cells. Data are mean ± SEM. Unpaired and two-tailed Student’s t-test was used to determine statistical significance of two groups. ANOVA and post hoc two-tailed Bonferroni test was used to determine statistical significance of more than two groups. P<0.05 was considered significant. *P<0.05, **P<0.01, ***P<0.001.
Results
Downregulated hsa_circ_0079929 in liver tissue samples and liver tumor cell lines
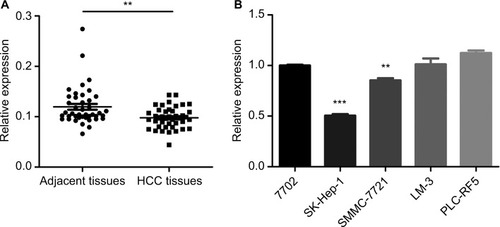
Previous research has shown that CDK13 gene was amplified and overexpressed in HCC with potential oncogenic activity.Citation17 circRNA termed hsa_circ_0079929 generated by parent gene CDK13 has been significantly downregulated in HCC tumor tissues as compared with that of para-cancerous tissues according to circRNA expression profile by using circular microarray.Citation18 Then, the hsa_circ_0079929 expression profile was assayed in 42 pairs of HCC tumor tissues and matched para-cancerous tissues. We confirmed the significant down-regulation of hsa_circ_0079299 in tumor tissues compared with nontumoral counterparts (). Next, we detected the expression of hsa_circ_0079299 in liver normal cell 7702 and tumor cells including SK-HEP-1, SMMC-7721, LM3 and PLC-RF5 (). qPCR showed that SK-HEP-1 and SMMC-7721 expressed lower level of hsa_circ_0079299 when compared with normal liver cell line. Taken together, the expression of hsa_circ_0079299 decreased in HCC and liver tumor cell lines.
Figure 1 Downregulation of circular RNAs in liver tissue samples and liver tumor cell lines.
Notes: (A) Quantification for hsa_circ_0079929 in 42 pairs of HCC and associated para-cancerous tissues. (B) Relative expression of one human liver normal cell line and four tumor cell lines were analyzed by qPCR. **P<0.01, ***P<0.001.
Abbreviations: HCC, hepatocellular carcinoma; qPCR, quantitative PCR.
Characterization of hsa_circ_0079929 in HCC
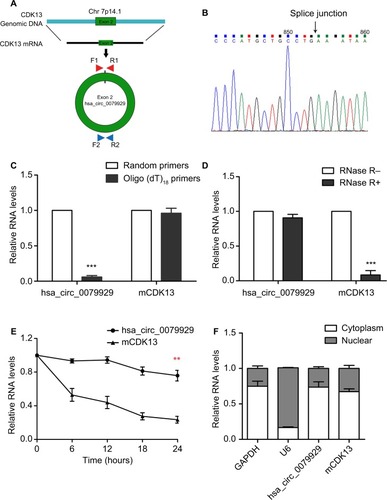
Distinguishing from those of linear counterparts, the formation of circRNA is back splicing. To be specific, hsa_circ_0079929 was generated by back-splicing exon 2 of CDK13 gene (). And the resulting RNA circle ligation site was located using Sanger sequencing (). Next, we confirmed the circularization of hsa_circ_0079929. Using random hexamer and oligo (dT)18 primers followed by qPCR, the expression of hsa_ circ_0079929 was reduced significantly using oligo (dT)18 primer when compared with that of random hexamer primer (). This demonstrated that hsa_circ_0079929 was without the structure of poly-A tail. Furthermore, we treated RNA which has been harvested from HCC cell line SK-hep-1 with or without RNase R, a 3´ to 5´ exoribonuclease that specifically digests linear RNAs. qPCR showed hsa_circ_0079929 decreased significantly when compared with that of CDK13 mRNA (), the result indicated that hsa_circ_0079929 was resistant to RNase R with circular structure. Furthermore, transcriptional inhibitor actinomycin D treatment was used to measure half-life of hsa_circ_0079929 and CDK13 mRNA, we found the half-life of hsa_circ_0079929 exceeded that of linear RNA (), which indicated that hsa_circ_0079929 was more stable than linear RNA. Additionally, qPCR showed the circular form of CDK13 preferentially distributed in cytoplasm than in nucleus (). In summary, our findings showed that hsa_circ_0079929 is an abundant and stable circRNA in human cancer cells.
Figure 2 Characterization of hsa_circ_0079929 in HCC.
Notes: (A) Schematic illustrates the genomic region of CDK13 that validates back-splicing of circular exon 2. Divergent primer was designed to detect hsa_circ_0079929 (660 bp). (B) The back-splicing junction of hsa_circ_0079929 was validated by Sanger sequencing. (C) The expression RNA of hsa_circ_0079929 and mCDK13 (mRNA CDK13) were analyzed by qPCR using random hexamer and oligo (dT)18 primers separately. (D) Quantification for hsa_circ_0079929 and mCDK13 in SK-HEP-1 cells treated with RNase R and normalized to the value measured in mock group. (E) qPCR for half-life of hsa_circ_0079929 and mCDK13. (F) qPCR for the abundance of hsa_circ_0079929 in the cytoplasm of SK-HEP-1 cells. GAPDH and U6 were as endogenous controls. **P<0.01, ***P<0.001.
Abbreviations: F, forward primer; GAPDH, glyceraldehyde 3-phosphate dehydrogenase; HCC, hepatocellular carcinoma; mRNA, messenger RNA; qPCR, quantitative PCR; R, reverse primer.
Overexpression of hsa_circ_0079929 suppressed tumor cell proliferation and cell cycle progression
Based on the abovementioned conclusions, specific function of hsa_circ_0079929 in tumor formation and development was proposed to further study. We have confirmed the lower expression of hsa_circ_0079929 in tumor cell lines SK-HEP-1 and SMMC-7721. Next, we constructed plasmid vector of overexpressed hsa_circ_0079929, and this plasmid vector was used to transfect both cell lines. After transfection, the expression of hsa_circ_0079929 was highly increased which indicated the success of transfection and overexpression of hsa_circ_0079929 (). At the same time, we obtained stably overexpressing cell line using SK-HEP-1. Cell counting kit-8 (CCK8), EdU assay and colony formation revealed overexpression of hsa_circ_0079929 inhibited cell proliferation significantly compared with negative control (). What is more, we investigated the effect of hsa_circ_0079929 on cell cycle. To be specific, we measured the percentage of tumor cells in different cell cycle stages including G1/G0, S and G2/M. Overexpression of hsa_circ_0079929 increased the percentage of cells in S and G2/M while decreased the percentage of cells in G1/G0 using flow cytometry (). We further confirmed the expression of CCNB1 which is associated with cell cycle was downregulated in nucleus but had no change in total after overexpression of hsa_circ_0079929 (). In addition, we also detected the apoptosis of transfected cells compared with negative control, the results showed no difference (). In conclusion, hsa_circ_0079929 inhibited tumor cell proliferation and exerted cell cycle arrest, but had no effect on cell apoptosis.
Figure 3 Overexpression of hsa_circ_0079929 suppressed tumor cell proliferation and cell cycle progression.
Notes: (A) The expression of hsa_circ_0079929 in SMMC-7721 and SK-HEP-1 cell lines measured by qPCR following transfection for 24, 48, 72 and 96 hours. (B) Cell counting assay 8 showed that overexpression of hsa_circ_0079929 inhibited transfected cell proliferation significantly compared with negative control. (C) The percentage of EdU-positive cells was reduced compared with negative control. (D) Numbers of clone formation were decreased when transfected with hsa_circ_0079929. (E) Flow cytometry showed cell cycle stages, overexpression of hsa_circ_0079929 increased S and G2/M stages while decreased G1/G0 stage. (F) Cell apoptosis was analyzed using flow cytometry. *P<0.05, **P<0.01, ***P<0.001.
Abbreviations: EdU, 5-ethynyl-2′-deoxyuridine; mCDK13, messenger RNA CDK13; PI, propidium iodide; qPCR, quantitative PCR.
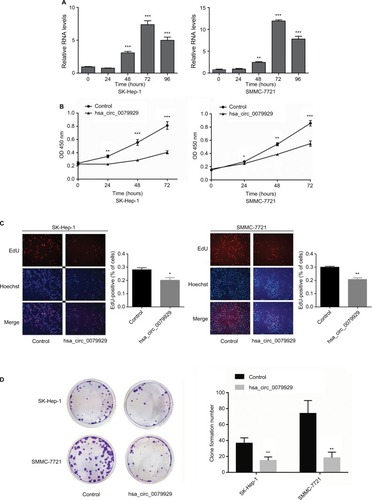
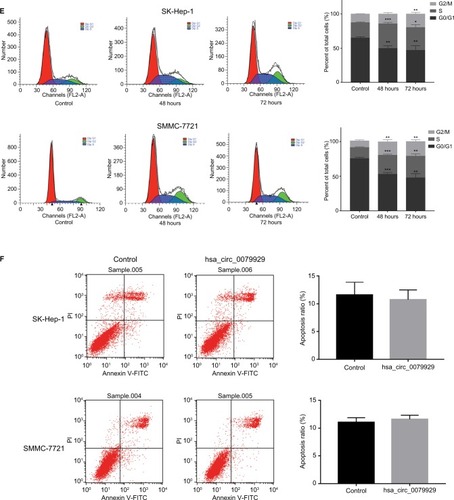
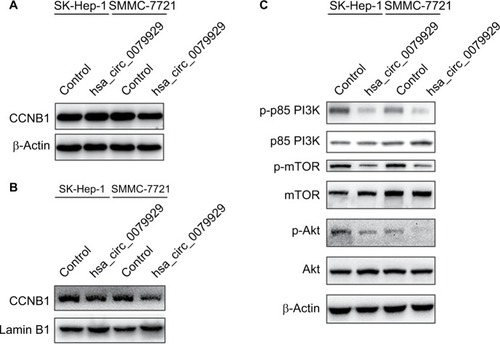
Figure 4 Overexpression of hsa_circ_0079929 inhibited PI3K/AKT/mTOR-dependent pathway and nuclear CCNB1.
Notes: (A) Western blotting analysis showed decreased protein level of p-p85 PI3K, p-AKT and p-mTOR. (B) Total CCNB1 protein expression had no change after transfection. (C) Nuclear CCNB1 was reduced when transfected cells with hsa_circ_0079929. β-actin and lamin B1 represented internal control and nuclear control, respectively.
Abbreviations: CCNB1, cyclin B1; p-p85 PI3K, phosphate p85 subunit of phosphoinositide 3-kinase; p-AKT, phosphate Ser/Thr protein kinase; p-mTOR, phosphate mammalian target of rapamycin.
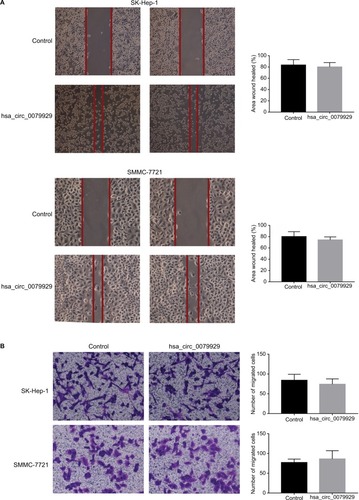
Effects of hsa_circ_0079929 on tumor cell migration and invasion
We found that hsa_circ_0079929 significantly suppressed tumor growth, and we subsequently investigated the effect of hsa_circ_0079929 on other tumor cell functions including migration and invasion. Wound healing assay and transwell assay indicated no remarkable difference compared with negative control (). This suggested that hsa_ circ_0079929 had no significant influence on cell migration and invasion.
Figure 5 Effects of hsa_circ_0079929 on tumor cell migration and invasion.
Notes: (A) By wound healing assay, the percentage of migration area showed no difference between transfected cells and negative control. (B) Transwell assay showed no decreased or increased migration and invasion ability in transfected cells compared with negative control.
Overexpression of hsa_circ_0079929 inhibited PI3K/AKT/mTOR signaling pathway to suppress tumor cell proliferation
To understand molecular mechanism illustrating specific function of hsa_circ_0079929 in HCC, we tested several signaling pathways during cell proliferation at protein levels by western blotting. Overexpression of hsa_circ_0079929 decreased expression of p-p85 PI3K, p-AKT and p-mTOR (). These results indicated that hsa_circ_0079929, at least, partially inhibited cell proliferation through PI3K/AKT/mTOR signaling pathway.
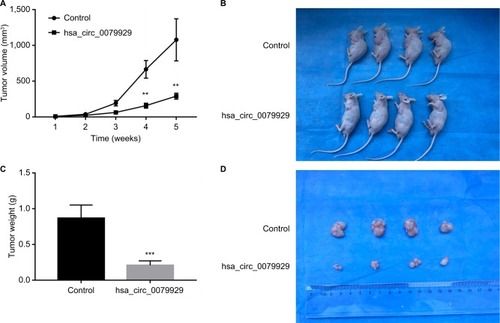
Tumorigenicity assay
To further assess whether overexpression of hsa_circ_0079929 could suppress tumor formation in vivo, we inoculated stable overexpressed hsa_circ_0079929 with SK-HEP-1 cell line subcutaneously into 4-week-old nude mice. The results showed that tumor size and weight were remarkably reduced when transplanted with tumor cells overexpressed hsa_circ_0079929 (). Therefore, we concluded that overexpression of hsa_circ_0079929 also suppressed tumorigenesis in vivo.
Figure 6 Overexpression of hsa_circ_0079929 suppressed tumorigenesis in vivo.
Notes: (A) Individual tumor volume was measured at the indicated days after injection of transfected cells and control cells. Average volume of tumors (mean ± SEM) is shown at the indicated days post injection. (B) Photographs of representative nude mice at 35 days after injection of transfected cells and control cells. (C) Tumor weight was measured at 35 days. (D) Photographs of tumor formation at 35 days. Overexpression of hsa_circ_0079929 reduced the tumor volume and tumor weight in nude mice. **P<0.01, ***P<0.001.
Discussion
circRNAs vary in different tissues and cell types along with different roles.Citation12 Of increasing interest is the emerging function of circRNAs in tumorigenesis. Herein, we explored the role of hsa_circ_0079929, deriving from CDK13 gene, in the pathogenesis of HCC.
In the present study, we found that hsa_circ_0079929 low expressed in HCC in comparison to matched para-cancerous samples using qPCR. Based on the downregulation of hsa_circ_0079929, we further explored its specific function and associated mechanism in HCC. We provided evidence that ectopic expression of hsa_circ_0079929 suppressed cell proliferation and retarded cell cycle progression at G2/M phase. To recognize specific function of hsa_circ_0079929 in cell proliferation, we found that cell cycle regulatory protein CCNB1 expression in total was no change while that of in nucleus was reduced. In cell cycle progression of normal cells, cyclin B1 partners with CDK1, as soon as CCNB1-CDK1 is phosphorylated and activated in the cytoplasm, it is rapidly transported into nucleus and controls cells to enter mitosis and induces G2/M transition.Citation19–Citation23 Prevention entry of CCNB1-CDK1 into nucleus hampers cells from initiating mitosis and subsequently accumulates in G2 phase, then finally inhibits cells from dividing into two daughter cells.Citation24–Citation26 To better understand the correlation between circRNAs and cell cycle progression, recent study demonstrated that cir-cRNA circFoxo-3 combined with p21 and CDK2 composing ternary complexes, which then induced cell cycle arrest.Citation27 In an attempt to elucidate mechanism of hsa_circ_0079929 acting as a suppressive effector on cell proliferation. We detected several canonical signaling pathways associated with cell proliferation at protein levels. We found that p85 PI3K, p-AKT and p-mTOR protein levels were decreased following hsa_ circ_0079929 overexpression. Phosphatidylinositol 3-kinase (PI3K) signaling pathway as the most common pathway in cell proliferation, metabolism and apoptosis possesses downstream mediators AKT (Ser/Thr protein kinase) and mTOR (mammalian target of rapamycin).Citation28–Citation30 Activated p85 as subunits of phosphatidylinositol 3-kinase phosphorylates AKT, then the activated AKT enables the activation of mTOR.Citation30 In line with our study, another CDK13-derived circRNA hsa_circ_001699 was recently demonstrated to suppress cell proliferation, migration and invasion in HCC through JAK/STAT and PI3K/AKT pathways.Citation31 hsa_circ_001699 derived from four exons of CDK13 gene. Differentiating from the multiple functions of hsa_circ_001699, our results showed limited function on cell cycle and cell proliferation but had no effects on cell migration, invasion or apoptosis, whereas regulating mechanism was in a similar way.
Given the abundant and tissue/cell-specific expression patterns of circRNAs, potential biological functions are expected. Several functions proposed for circRNA were as follows: 1) circRNAs contain binding sites for miRNA and act as sponges for miRNA, in which way could circRNAs modulate miRNAs activity.Citation32,Citation33 2) Regulating alternative splicing of host gene. Once circRNAs are produced, the remaining pre-mRNA transcriptions would be altered.Citation34 3) Combining with various proteins as RNA binding protein sponges to regulate associated proteins function.Citation27 4) circRNAs encode proteins in a cap-independent translation way.Citation35
The hsa_circ_0079929 downstream suppressive cell proliferation and cell cycle progression effect included downregulated nuclear CCNB1. The precise regulation of hsa_circ_0079929 on CCNB1 protein was not well demonstrated in our study. Abovementioned functions of sponging miRNA or directly interacting with proteins may take predominance. Further research is needed to confirm the specific mechanism of hsa_circ_0079929 in tumor suppression.
Conclusion
Our study demonstrates low expression of hsa_circ_0079929 in HCC. Ectopic expressed hsa_circ_0079929 exerted suppressive effects on tumor cell proliferation and cell cycle progression.
Cell cycle associated protein CCNB1 and PI3K/AKT/mTOR signaling pathway were involved in the regulation of hsa_circ_0079929 functions. Despite the precise mechanism of the circRNA action is needed to be further explored, we still provided a novel insight of circRNAs as a potential therapeutic target.
Acknowledgments
This work was funded by the National Natural Science Foundation of China (Grant No. 81672934).
Disclosure
The authors report no conflicts of interest in this work.
References
- TorreLABrayFSiegelRLFerlayJLortet-TieulentJJemalAGlobal cancer statistics, 2012CA Cancer J Clin20156528710825651787
- El-SeragHBHepatocellular carcinomaN Engl J Med2011365121118112721992124
- AverhoffFInfectious Diseases Related to Travel: Hepatitis B Centers for Disease Control and Prevention Available from: https://wwwnc.cdc.gov/travel/yellowbook/2018/infectious-diseases-related-to-travel/hepatitis-bAccessed December 11, 2018
- MittalSEl-SeragHBEpidemiology of hepatocellular carcinoma: consider the populationJ Clin Gastroenterol201347SupplS2S623632345
- BruixJShermanMAmerican Association for the Study of Liver DiseasesManagement of hepatocellular carcinoma: an updateHepatology20115331020102221374666
- European Association for the Study of the Liver; European Organisation for Research and Treatment of CancerEASL-EORTC clinical practice guidelines: management of hepatocellular carcinomaJ Hepatol201256490894322424438
- SchulzeKImbeaudSLetouzéEExome sequencing of hepatocellular carcinomas identifies new mutational signatures and potential therapeutic targetsNat Genet201547550551125822088
- GuichardCAmaddeoGImbeaudSIntegrated analysis of somatic mutations and focal copy-number changes identifies key genes and pathways in hepatocellular carcinomaNat Genet201244669469822561517
- JeckWRSorrentinoJAWangKCircular RNAs are abundant, conserved, and associated with ALU repeatsRNA201319214115723249747
- LuTCuiLZhouYTranscriptomewide investigation of circular RNAs in riceRNA201521122076208726464523
- SalzmanJGawadCWangPLLacayoNBrownPOCircular RNAs are the predominant transcript isoform from hundreds of human genes in diverse cell typesPLoS One201272e3073322319583
- StarkeSJostIRossbachOExon circularization requires canonical splice signalsCell Rep201510110311125543144
- LiFZhangLLiWCircular RNA ITCH has inhibitory effect on ESCC by suppressing the Wnt/β-catenin pathwayOncotarget2015686001601325749389
- ChenXFanSSongENoncoding RNAs: new players in cancersAdv Exp Med Biol201692714727376730
- PandaACGorospeMDetection and analysis of circular RNAs by RT-PCRBio Protoc201886e2775
- NaitoSvon EschenbachACGiavazziRFidlerIJGrowth and metastasis of tumor cells isolated from a human renal cell carcinoma implanted into different organs of nude miceCancer Res198646841093731078
- KimHEKimDGLeeKJFrequent amplification of CENPF, GMNN and CDK13 genes in hepatocellular carcinomasPLoS One201278e4322322912832
- CuiSQianZChenYLiLLiPDingHScreening of up- and downregulation of circRNAs in HBV-related hepatocellular carcinoma by microarrayOncol Lett201815142343229387227
- BerridgeMJModule 9: cell cycle and proliferationCell Signalling Biology20146csb001009
- LimSKaldisPCdks, cyclins and CKIs: roles beyond cell cycle regulationDevelopment2013140153079309323861057
- XueLWuZLiuJLuoJFPHPB inhibits gastric tumor cell proliferation by inducing G2-M cell cycle arrestBiomed Pharmacother20189869470029304495
- GavetOPinesJActivation of cyclin B1-Cdk1 synchronizes events in the nucleus and the cytoplasm at mitosisJ Cell Biol2010189224725920404109
- QiFChenQChenHWAC promotes polo-like kinase 1 activation for timely mitotic entryCell Rep201824354655630021153
- BonelliPTuccilloFMBorrelliASchiattarellaABuonaguroFMCDK/CCN and CDKI alterations for cancer prognosis and therapeutic predictivityBiomed Res Int2014201436102024605326
- HendersonLBortoneDSLimCZambonACClassic “broken cell” techniques and newer live cell methods for cell cycle assessmentAm J Physiol Cell Physiol201330410C927C93823392113
- KastanMBBartekJCell-cycle checkpoints and cancerNature2004432701531632315549093
- DuWWYangWLiuEYangZDhaliwalPYangBBFoxo3 circular RNA retards cell cycle progression via forming ternary complexes with p21 and CDK2Nucleic Acids Res20164462846285826861625
- ZarogoulidisPLampakiSTurnerJFmTOR pathway: a current, up-to-date mini-review (Review)Oncol Lett2014862367237025360163
- YuJSCuiWProliferation, survival and metabolism: the role of PI3K/AKT/mTOR signalling in pluripotency and cell fate determinationDevelopment2016143173050306027578176
- HemmingsBARestucciaDFPI3K-PKB/Akt pathwayCold Spring Harb Perspect Biol201249a01118922952397
- LinQLingYBChenJWCircular RNA circCDK13 suppresses cell proliferation, migration and invasion by modulating the JAK/STAT and PI3K/AKT pathways in liver cancerInt J Oncol201853124625629658568
- PiweckaMGlažarPHernandez-MirandaLRLoss of a mammalian circular RNA locus causes miRNA deregulation and affects brain functionScience20173576357eaam852628798046
- TayYRinnJPandolfiPPThe multilayered complexity of ceRNA crosstalk and competitionNature2014505748334435224429633
- LiXYangLChenLLThe biogenesis, functions, and challenges of circular RNAsMol Cell201871342844230057200
- PamudurtiNRBartokOJensMTranslation of circRNAsMol Cell2017661921.e728344080