
 ?Mathematical formulae have been encoded as MathML and are displayed in this HTML version using MathJax in order to improve their display. Uncheck the box to turn MathJax off. This feature requires Javascript. Click on a formula to zoom.
Abstract
Purpose
JAM3, an adhesion and transmigration regulatory element, is abundantly expressed in intestinal epithelial cells. However, its expression and function in colorectal cancer (CRC) remain unknown. In this study, we explored its epigenetic mechanism and biological role in CRC.
Patients and methods
Bioinformatics analysis was used to analyze the expression and methylation level of JAM3 in CRC. Methylation and expression status of JAM3 were then validated by quantitative methylation-specific PCR (qMSP) and quantitative PCR in tissues, plasma samples, and cell lines. Flow cytometry, Western blot, transwell, siRNA, colony formation, and transfection were used to evaluate the biological function of JAM3.
Results
We initially found that JAM3 was frequently methylated and downregulated in CRC based on bioinformatics tools. qMSP validation showed that the methylation levels of JAM3 were increased in 75% (18/24) of CRC tissues, 61% (11/18) plasma samples, and all four CRC cell lines and were significantly associated with tumor stage in CRC tissues. Moreover, JAM3 was downregulated in primary CRC tissues, plasma samples, and CRC cell lines as compared with that in nonmalignant controls, although its expression could be recovered after demethylation treatment. Restoration of JAM3 repressed CRC cell viability, colony formation, and migration. In addition, siRNA-mediated depletion of JAM3 in NCM460 cells improved the clonogenicity and migration capability, whereas it suppressed cell apoptosis and cell-cycle arrest. These functional effects were accompanied with alterations of several epithelial cell markers, including E-cadherin, vimentin, phosphor-β-catenin (ser552), and TJP1, which were responsible for epithelial–mesenchymal transition.
Conclusion
The findings indicated that JAM3 may be a novel tumor suppressor gene with epigenetic reduction in CRC and can be used as a potential noninvasive biomarker for CRC diagnosis.
Keywords:
Introduction
Colorectal cancer (CRC) is the third leading cause of cancer-related mortality worldwide, with many patients presenting with advanced stage at initial diagnosis.Citation1 Prevention, screening, and therapy can remarkably reduce its incidence and mortality, which is attributed to a deep understanding of CRC pathogenesis at a molecular level. Admittedly, the development of CRC is a multistep process that involves both epigenetic and genetic changes in oncogenes and tumor suppressor genes (TSGs).Citation2 However, the exact pathogenesis of CRC is currently unclear.
Recent cumulative evidence indicates that epigen-etic changes, especially DNA methylation, are early driver events and promising diagnostic biomarkers in CRC.Citation3 DNA methylation that commonly results in TSG silencing can be detected in accessible tissues or body fluids.Citation4 Alterations in DNA methylation occur more frequently than genetic changes and could be involved in cell-cycle control, apoptosis and DNA repair.Citation5 A series of methylation-silenced TSG have been found to be associated with cancer initiation and progression.Citation6,Citation7 Therefore, the identification of novel DNA-methylated genes allows better understanding of CRC progression. Epi-genetic profiling through bioinformatics analysis has made a tremendous contribution to find such genes.Citation8,Citation9
Junctional adhesion molecules (JAMs) belonging to an immunoglobulin subfamily can directly affect tight junction functions in both epithelial and endothelial cells.Citation10,Citation11 There are six main members in the JAM subfamily, encompassing JAM1, JAM2, JAM3, JAM4, ESAM, and CAR, which are selectively expressed in a variety of human tissues.Citation12,Citation13 Numerous studies have addressed JAM3, also known as JAM-C, as an adhesion and transmigration regulatory element.Citation14,Citation15 Recently, JAM3 has been reported to play a critical role in regulating tumor growth during tumor progression. Over-expression of JAM3 has been shown to improve tight junctions and recover an epithelial phenotype in lung squamous cell carcinoma cells.Citation16 Furthermore, the expression level of JAM3 has been revealed to be downregulated in gastric adenocarcinoma.Citation17 Although JAM3 is abundantly expressed in intestinal epithelial cells, the precise function of JAM3 in CRC progression remains unclear.Citation18
Herein, using bioinformatics analysis, we initially ana-lyzed the expression and methylation status of JAM3 in CRC tissues in comparison with those in normal controls. This was followed by clinical and experimental validation with CRC patient tissues, plasma samples, and cell lines. We then investigated the association of JAM3 methylation and expression with various clinicopathologic characteristics. In addition, we also explored if the methylation and downregu-lation of JAM3 in plasma could be potential approaches to noninvasive assessment of CRC. Finally, we comprehensively evaluated the epigenetic regulation and biological function of JAM3 in CRC.
Patients and methods
Bioinformatics analysis based on public databases
We used the datasets from Oncomine database (https://www.oncomine.org) to analyze the expression status of JAM3 in CRC. Genome-scale DNA methylation array containing 125 CRC and 29 normal colonic tissues was obtained from the database of Gene Expression Omnibus (GEO; http://www.ncbi.nlm.nih.gov/geo/, GSE25062).Citation19 The methylation level of JAM3 was investigated using R statistical software.
Specimens and cell lines
A total of 24 primary CRC samples with histopathological examination and paired adjacent normal tissues (>5 cm from the corresponding tumor edge) were surgically gained from patients admitted from 2014 to 2017 at the First Affiliated Hospital of Xiamen University undergoing tumor resection. No patients received any adjuvant therapy before surgery. These tissues were frozen at once in liquid nitrogen and stored at –80°C. Blood specimens were obtained from another 18 patients with primary CRC before therapeutic intervention and 18 consented healthy donors. Plasma was acquired from the 4 mL blood specimens after centrifugation and stored at –80°C.
Four human CRC cell lines (HT29, HCT116, SW480, and SW620) and an immortalized colonic epithelial cell line (NCM460) were cultured in the Roswell Park Memorial Institute (RPMI) 1640 medium with 10% FBS and incubated at 37°C in humidified 5% CO2. All cells were acquired from the Cancer Center of Xiamen University (Xiamen, China).
All experimental protocols and the use of the cell lines were approved by the Clinical Research Ethics Committee of Xiang’an Hospital of Xiamen University. All methods were conducted in accordance with the Declaration of Helsinki. Written informed consent was acquired from all human participants after complete description of the study. A summary of the demographics is given in .
5-Aza-2′-deoxycytidine (5-AZA) treatment
All cells were maintained in six-well plates and treated with 5-AZA at a concentration of 5 µM dissolved in PBS for 48 hours. The fresh medium containing the respective agent was freshly replaced every 24 hours. The control group was treated only with PBS.
Plasmid and siRNA transfection
Human plasmid pEnter–JAM3 with the full-length open reading frame of the human JAM3 gene and the control vector were purchased from Vigene Biosciences Co., Ltd. (Shandong, China). HT29 and SW620 cells were transfected with pEnter–JAM3 or control plasmid through Lipofectamine 2000 (cat#11668027; Thermo Fisher Scientific). Stably transfected cells with JAM3 expression were obtained under selection with kanamycin for 2 weeks. The cell proliferation status was analyzed using Cell Counting Kit-8 assay according to the manufacturer’s instructions.
SiRNA targeting JAM3 (siJAM3) with the sequences (sense: 5′-UUCACUUGCACAGUUAACUCGAUCA-3′ and antisense: 5′-UGAUCGAGUUAACUGUGCAAGUGAA-3′) and nontargeting siRNA control (siNC) were transfected into NCM460 cells using Lipofectamine 2000 following the manufacturer’s instructions.
DNA and RNA extraction
Histological evaluation of surgical specimens proved that all specimens investigated consisted of >70% tumor cells.Citation20 DNA from cell lines, tissues, and plasma was isolated using TIANamp Genomic DNA Kit (cat#DP304; TIANGEN Bio-tech Co.,Ltd., Beijing, China) and QIAamp DNA Blood Midi Kit (cat#51185; Qiagen NV, Venlo, the Netherlands). Total RNA was extracted using TRIzol reagent (cat#15596026; Invitrogen) following the manufacturer’s instructions. All DNA and RNA samples were quantified by NanoDrop 2000 (Thermo Fisher Scientific) or Qubit 3.0 Fluorometer (Thermo Fisher Scientific).
Quantitative methylation-specific PCR (qMSP)
The extracted DNA was treated with sodium bisulfate to covert unmethylated cytosines to uracils using the EpiTech Bisulfite Kit (cat#59104; Qiagen NV). Methylation status of JAM3 was analyzed through a SYBR Green-based qMSP.Citation21 The primer sequences of JAM3 for the methylated reaction were 5′-CGTAGTTAGGGTTGGGATTC-3′ (forward) and 5′-ACCGACTCACTACCTAAAACG-3′ (reverse), as well as for the unmethylated reaction 5′-TTGTAGT-TAGGGTTGGGATTT-3′ (forward) and 5′-AACCAACT-CACTACCTAAAACA-3′ (reverse). Control methylated DNA and unmethylated DNA were purchased from Qiagen NV. After PCR amplification, a dissociation curve was generated to evaluate the quality of PCR product.
Quantitative PCR (qPCR)
The extracted total RNA was reverse transcripted into cDNA using PrimeScript RT Reagent Kit (cat#RR047A; Takara). The relative JAM3 mRNA expression was analyzed using the comparative cycle threshold (CT) method, with GAPDH as a control. Primers used for JAM3 were sense: 5′-CTGCT-GTTCACAAGGACGAC-3′ and antisense: 5′-CAGAT-GCCCAACGTGATCAG-3′. The following conditions were used: 95°C for 5 minutes, 40 cycles of 95°C for 30 seconds, and 60°C for 1 minute (ABI ViiA 7 Real-Time PCR System).
Western blot
Antibodies against JAM3 (cat#sc-80134; Santa Cruz Biotechnology Inc.), phospho-β-catenin (ser552), β-catenin, caspase-3, E-cadherin, vimentin, Bcl2 (cat#9566, 8480, 9662, 3195, 5741, 2872; Cell Signaling Technology), p21, p27, cyclin D1 (cat#AP0713, BS1207, BS2436; Bioworld), and GAPDH (cat#KC5G4; Kangchen) were used for Western blot.
Immunohistochemical analysis of human CRC tissue microarray (TMA)
Human CRC TMA (cat#HColA030PG03) was purchased from Outdo Biotech (Shanghai, China) and stained with primary antibody for JAM3. The detailed information for TNM classification is given in .
Wound healing assays
HT29 and SW620 cells transfected with JAM3 overexpres-sion plasmid were maintained until 70%–80% confluent and wounded using a sterile 20 µL tip. The wounds were observed at 0 and 24 hours.
Colony formation assays, transwell assays, and cell-cycle assays
NCM460 cells transfected with siRNA were cultured at a density of 400 cells/well for 2 weeks, and colonies were stained using crystal violet staining solution. Cell migration was analyzed using transwell assay following the manufacturer’s instructions. Propidium iodide (PI) staining was performed to assess cell cycle. Annexin V-fluorescein isothiocyanate (FITC)/PI staining was used to evaluate cell apoptosis.
Statistical analyses
The percentage of JAM3 methylation was assessed using the following formula: methylated JAM3, where M represents the copy number of methylated JAM3, U represents the copy number of unmethylated JAM3, and .Citation21,Citation22 JAM3 methylation status was regarded as a continuous variable and a categorical variable. The student’s t-test or rank-sum test was used to assess the differences in JAM3 methylation status by age, sex, tumor stage, and tumor location. GraphPad software (GraphPad Software, Inc., La Jolla, CA, USA) was used to do statistical analysis. The diagnostic performance of JAM3 was analyzed using receiver-operating characteristic (ROC) curves. Molecular interaction network involving JAM3 and TJP1 was obtained, and the map was generated by analyzing Gene-Cloud of Biotechnology Information (GCBI) database and GeneCards database, respectively.Citation23 Data are shown as mean ± SD. The two-tailed Student’s t-test was used to calculate group means, where P<0.05 represented statistical significance.
Results
JAM3 was frequently methylated in CRC
In an attempt to estimate whether JAM3 was associated with CRC progression, two datasets including Skrzypczak colorectal dataset with 45 colorectal adenocarcinoma specimens and 24 healthy controls as well as The Cancer Genome Altas (TCGA) array dataset with 22 cecum adenocarcinoma samples and 22 normal controls from Oncomine were ana-lyzed. Reduced expression of JAM3 mRNA was observed in CRC tissues compared with that in nontumor tissues (). In addition, the methylation level of JAM3 was investigated between 125 CRC samples and 29 normal controls in the GSE25062 dataset obtained from GEO database. The result showed that the methylation status of JAM3 was markedly higher in CRC tissues compared to that observed in normal controls (). However, these data warrant further validation.
Figure 1 JAM3 was hypermethylated in primary CRC tissues, plasma, and cell lines.
Notes: (A) Expression level of JAM3 was significantly downregulated in CRC tissues compared to that in normal controls in the Skrzypczak colorectal dataset and TCGA expression array dataset from Oncomine. (B) A significant difference in JAM3 methylation status was observed between 125 CRC tissues and 29 adjacent normal tissues in the GSE25062 dataset. (C) Schematic structure of the JAM3 promoter CpG islands, CpG sites (short vertical lines), and qMSP region is indicated (from forward primer to reverse primer). The transcription start site is shown by a curved arrow. (D) Methylation percentage of JAM3 in 24 paired CRC tissues and normal tissues was detected by qMSP. (E) Methylation percentage of JAM3 in plasma from 18 CRC cases and 18 healthy subjects was examined by qMSP (P<0.001, two-sided Student’s t-test). (F) Methylation percentage of JAM3 in CRC cell lines (HT29, HCT116, SW480, and SW620) and normal colonic NCM460 cells was detected by qMSP (P<0.001, two-sided Mann–Whitney rank-sum test). (G) ROC curves showed the performance of JAM3 methylation status from CRC tissues in predicting CRC. (H) ROC curves showed the performance of JAM3 methylation status from CRC plasma in predicting CRC. Sensitivity means true-positive rate. Specificity means false-positive rate. Results are shown as mean ± SD. ***P<0.001.
Abbreviations: CRC, colorectal cancer; TCGA, The Cancer Genome Altas; qMSP, quantitative methylation-specific PCR; ROC, receiver-operating characteristic.
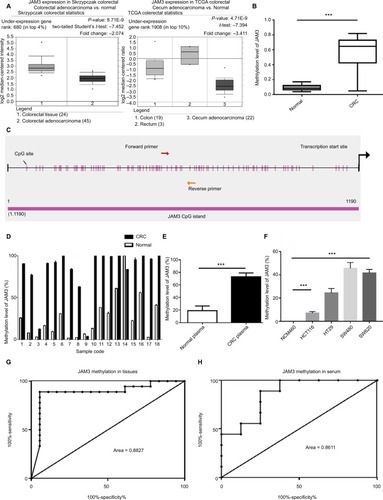
To confirm the abovementioned results from bioinfor-matics analysis, the methylation level of JAM3 was investigated initially in CRC tissues, plasma samples, and cells. Using qMSP focusing on CpG islands in the promoter of JAM3 (from 519 to 644 bp), hypermethylation of JAM3 was frequently found in 18 of 24 (75%) primary CRC tissues (). In addition, a significant difference was observed in the methylation level of JAM3 between CRC tissues (mean, 82.62%; range, 3.672%–100%) and normal controls (mean, 38.84%; range, 1.668%–100%) as shown in . For plasma samples, the methylation status of JAM3 was higher in CRC cell-free DNA (mean, 73.14%; range, 43.72%–99.98%) compared with that in healthy controls (mean, 19.03%; range, 0.8076%–54.78%; ). Moreover, the methylation status of JAM3 in four CRC cell lines (HT29, HCT116, SW480, and SW620) was significantly higher than that in NCM460 cells (). Interestingly, the ROC curves showed that DNA methylation levels of JAM3 promoter could be a potential molecular marker for CRC diagnosis (the area under ROC curve [AUC] = 0.8827 for tissues and 0.8611 for cell-free DNA; and ). Accordingly, these results suggested that JAM3 was frequently methylated in CRC.
JAM3 was downregulated in CRC
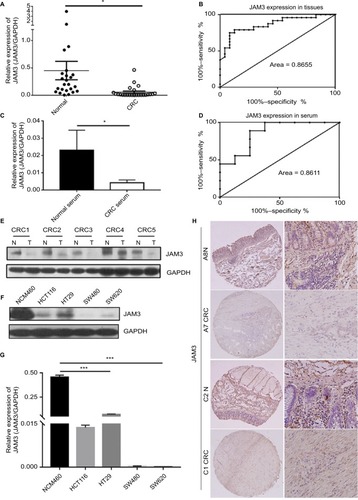
Next, to reveal whether DNA methylation influenced the expression of JAM3, we analyzed JAM3 mRNA and protein expression status in 24 identical CRC and nontumor tissues. As shown in and , the expression level of JAM3 was significantly decreased in CRC tissues with JAM3 hyper-methylation compared to that of nontumor tissues (AUC = 0.8655). An inverse correlation was observed between JAM3 methylation and expression (r = –0.3575, P = 0.0323). JAM3 protein levels were also downregulated in 75% (18/24) of cases, especially in CRC tissues with hypermethylation of JAM3 promoter (). Likewise, JAM3 mRNA could be detected in nine of 18 CRC as well as paired normal plasma samples and was markedly downregulated in CRC with AUC as 0.8611 ( and ). In addition, the JAM3 mRNA and protein expression level were both significantly decreased in all four CRC cell lines (100%) but were readily observed in NCM460 cells ( and ). Four CRC cell lines with JAM3 hypermethylation showed decreased JAM3 expression. The result of TMA showed that much higher JAM3 positive staining was observed in the majority of normal tissues, while it was weak in most of the CRC tissues (). Thus, these data indicated that DNA methylation was responsible for decreased expression of JAM3.
Figure 2 JAM3 was downregulated in CRC tissues, plasma, and cell lines.
Notes: (A) JAM3 mRNA expression levels in 24 paired CRC tissues and paired normal tissues were detected using qPCR, relative to the value of GAPDH in each sample (P<0.05, two-sided Student’s t-test). (B) ROC curves showed the performance of JAM3 expression levels from tissues in predicting CRC. (C) JAM3 mRNA expression levels in 18 CRC and as well as paired normal plasma samples were detected using qPCR (P<0.05, two-sided Student’s t-test). (D) ROC curves showed the performance of JAM3 expression levels from CRC tissues in predicting CRC. (E) Representative Western blot image for protein expression level of JAM3 in CRC tissues and paired normal tissues. (F) Western blot image for protein expression level of JAM3 in CRC cell lines (HT29, HCT116, SW480, and SW620) and normal colonic NCM460 cells. (G) JAM3 mRNA expression levels in CRC cell lines (HT29, HCT116, SW480, and SW620) and normal colorectal epithelial NCM460 cells were detected using qPCR (P<0.001, two-sided Mann–Whitney rank-sum test). (H) Representative images of JAM3 staining in CRC tissues and paired normal tissues. Normal tissues showed strong positive staining, whereas CRC tissue displayed weak staining. The right panel (magnification ×400) was magnification of where inset in the left tissue array (magnification ×100). Results are shown as mean ± SD. *P<0.05 and ***P<0.001.
Abbreviations: CRC, colorectal cancer; qPCR, quantitative PCR; ROC, receiver-operating characteristic.
5-AZA rescued JAM3 expression
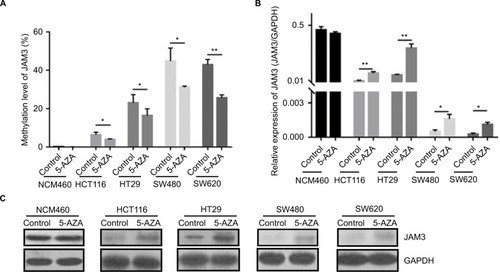
To further identify the interaction between expression and methylation level of JAM3, four CRC cell lines and NCM460 cells were treated with 5-AZA. As expected, the methylation status of CRC cell lines with hypermethylation of JAM3 promoter was decreased after 5-AZA treatment (). The mRNA and protein expression level of JAM3 were rescued only in the 5-AZA-treated group ( and ). In contrast, no significant difference was observed in NCM460 cells.
Figure 3 Demethylating agent 5-AZA treatment induced JAM3 expression in CRC cell lines.
Notes: (A) JAM3 methylation status after 5 µm 5-AZA treatment in CRC cell lines (HT29, HCT116, SW480, and SW620) and normal colorectal NCM460 cells are measured by qMSP. (B) qPCR and (C) Western blots were used to examine mRNA and protein expression levels of JAM3 after 5 µm 5-AZA treatment in CRC cell lines and NCM460 cells. Results are shown as mean ± SD (two-sided Student’s t-test). *P<0.05 and **P<0.01.
Abbreviations: 5-AZA, 5-Aza-2′-deoxycytidine; CRC, colorectal cancer; qMSP, quantitative methylation-specific PCR; qPCR, quantitative PCR.
Relationship between JAM3 methylation status and clinicopathologic characteristics
Meanwhile, the relationship between JAM3 methylation status and clinicopathological characteristics was investigated in tissues and cell-free DNA from CRC patients. The result showed that there was no correlation between JAM3 methylation and clinicopathological characteristics such as age, sex, tumor stage, or tumor location in plasma specimens (). However, in tissue samples, JAM3 methylation level was inclined to be much higher in the early stage (mean, 99.85%; range, 99.11%–100%) than in the late stage (mean, 73.09%; range, 3.672%–100%; P = 0.0011).
Table 1 Association between clinicopathologic characteristics and JAM3 methylation status
Restoration of JAM3 suppressed CRC cell growth and migration
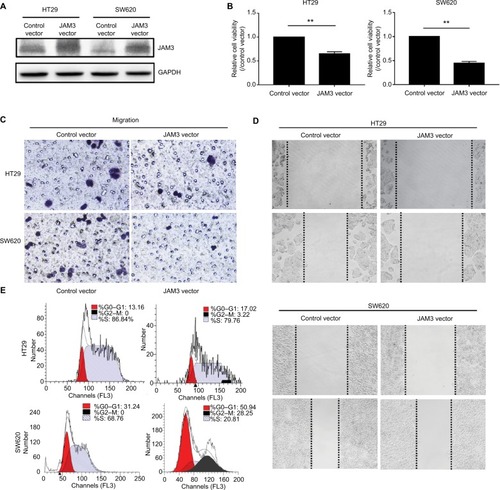
The abovementioned results, which showed epigenetic silencing of JAM3 expression in CRC tumor tissues and CRC cell lines other than in normal controls, indicated a prospective tumor suppressor role of JAM3. To demonstrate this hypothesis, we chose HT29 and SW620 cells with suppressed or silenced JAM3 expression and then restored JAM3 expression by transfecting them with vector expressing JAM3 or empty vector, respectively. The effect of transfection was verified by Western blot (). Restoration of JAM3 in both CRC cell lines induced a significant decrease in cell viability and cell migration ( and ). Moreover, migration at the edges of wounds was also significantly slowed by JAM3 restoration (). Compared to control cells, G0–G1 and G2–M phases were increased, whereas the S phase was decreased in CRC cells transfected with JAM3 vector (). These data further revealed that JAM3 negatively regulated growth and migration of CRC cells.
Figure 4 Restoration of JAM3 suppressed CRC cell growth and migration.
Notes: (A) Expression of JAM3 in SW620 and HT29 cells transfected with JAM3 expression vector, and control vector was confirmed by Western blot. (B) JAM3 expression significantly suppressed the number of viable cells of JAM3-transfected SW620 and HT29 cells compared to that of control vector-transfected cells (P<0.01, two-sided Student’s t-test). (C) Representative result of transwell assay in JAM3-transfecting as well as control vector transfecting HT29 and SW620 cells. (D) Representative result of monolayer scratch-healing assay in JAM3-transfecting as well as control vector transfecting SW620 and HT29 cells. (E) Representative result of cell-cycle analysis in JAM3-transfecting as well as control vector transfecting SW620 and HT29 cells. Results are shown as mean ± SD. **P<0.01.
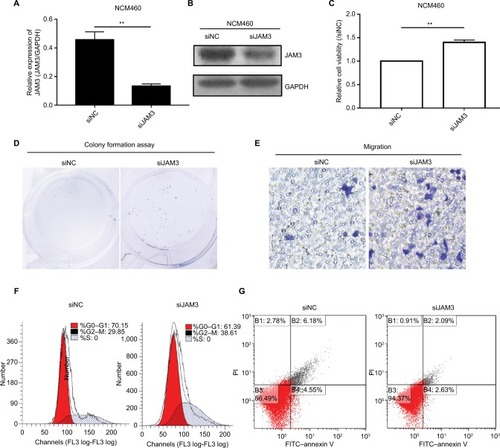
JAM3 reduction promoted cell migration and reduced apoptosis in NCM460 cells
NCM460 cells had a higher JAM3 expression and a lower migratory ability compared with CRC cells. We transfected NCM460 cells with siJAM3 and siNC to further confirm the biological function of JAM3, respectively. The reduction of JAM3 mRNA and protein expression in these transfected cells was demonstrated by qPCR and Western blot ( and ). JAM3 depletion significantly increased cell viability compared to the control group (). We also found a sharp increase of colonies in cells transfected with siJAM3 compared with that in the control group (). Next, we investigated the effect of JAM3 suppression on cell migration. As shown in , the amount of cells that migrated through the membrane was remarkably increased after transfection. The result of cell-cycle analysis showed that the G0–G1 phase was reduced, whereas the G2–M phase was increased after transfection (). In addition, JAM3 depletion significantly reduced both early and late apoptosis of NCM460 cells (). Taken together, these results suggested that JAM3 acts as a tumor suppressor in CRC.
Figure 5 JAM3 suppression promoted cell migration and reduced apoptosis in colonic NCM460 cells.
Notes: JAM3 mRNA (A) and protein (B) expressions were efficiently inhibited in NCM460 cells transfected with siJAM3. GAPDH was used as an internal control (P<0.01, two-sided Student’s t-test). (C) Representative result of CCK8 assay (P<0.01, two-sided Student’s t-test). (D) Representative colony formation assays in NCM460 cells transfected with siJAM3 and siNC. (E) Representative transwell assays in NCM460 cells transfected with siJAM3 and siNC. (F) Cell-cycle distribution of NCM460 cells transfected with siJAM3 and siNC was detected by flow cytometry analysis. (G) Representative result of cell apoptosis analysis. **P<0.01 and ***P<0.001.
Abbreviations: CCK8, Cell Counting Kit-8; siJAM3, siRNA–JAM3; siNC, siRNA control; FITC, fluorescein isothiocyanate.
JAM3 participated in epithelial–mesenchymal transition (EMT) in colonic epithelial cells
JAM3 could directly or indirectly interact with several genes that are responsible for EMT, including tight junction protein 1 (TJP1) and catenin beta 1 (CTNNB1) ( and ). Therefore, we presumed that JAM3 was associated with EMT in CRC, which is characterized by loss of epithelial cells makers.
Figure 6 JAM3 participated in EMT in colonic epithelial cells.
Notes: Molecular interaction networks involving JAM3 (A) and TJP1 (B) were generated by using GCBI database and GeneCards database. (C) Protein expression levels of Bcl2, caspase-3, P21, P27, cyclin D1, E-cadherin, vimentin, TJP1, p-β-catenin, and β-catenin in NCM460 cells transfected with siJAM3 and siNC. (D) Protein expression levels of Bcl2, caspase-3, P21, P27, cyclin D1, E-cadherin, vimentin, TJP1, p-β-catenin, and β-catenin in JAM3-transfecting as well as control vector transfecting SW620 and HT29 cells.
Abbreviations: EMT, epithelial–mesenchymal transition; siNC, siRNA control; GCBI, Gene-Cloud of Biotechnology Information.
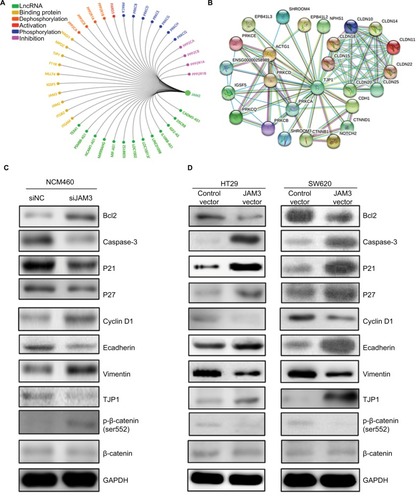
As expected, the decreased levels of E-cadherin as well as TJP1 and increased levels of vimentin after JAM3 depletion were accompanied by an increased level of phosphor-β-catenin (ser552; ). We also detected an upward trend in cyclin D1, which is in accordance with the increased Bcl2 levels and a downward trend in caspase-3, P21, and P27 protein expression in JAM3-depleted cells. Interestingly, restoration of JAM3 had the opposite effects (). Collectively, these results demonstrated that JAM3 may play a critical role in EMT and colonic cell migration.
Discussion
JAMs are known to participate in epithelial morphology as well as migration and are concentrated at tight junctions. As a member of this family, the role of JAM3 in CRC remains unclear. In our present study, we first observed frequent JAM3 gene methylation and inactivation in CRC tissues using bioinformatics analysis. Next, we clinically validated that the promoter of JAM3 was hypermethylated in CRC and its methylation level was significantly associated with the tumor stage. Moreover, JAM3 was downregulated in CRC and demethylation treatment could rescue the expression of JAM3. Restoration of JAM3 reduced CRC cell migration, colony formation, and viability. In accordance, inhibition of JAM3 expression promoted these processes. In addition, JAM3 was found to be associated with the molecules related to EMT. Interestingly, our study also implicated that methylation or expression of JAM3 might be a novel candidate for noninvasive diagnosis of CRC. To the best of our knowledge, this is the first study to investigate the critical function of JAM3 in CRC.
Previously, JAM3 was described as a primary component of tight junctions for establishing cell polarity in epithelial cells.Citation24 Furthermore, JAM3 has also been reported to interact with scaffolding proteins such as ZO-1 based on the PDZ domain.Citation25 During tumor triggering, tight junctions were remodeled and cells could escape from constraints by intercellular junctions with a promigratory phenotype.Citation26 The role of JAM3 in various cancers is complex. A recent study reported that JAM3 expression could be found in several carcinoma cell lines and suggested the involvement of JAM3 in tumor cell metastasis in lung cancer.Citation27 In addition, another study indicated that JAM3 promotes migration and suppresses apoptosis of renal carcinoma cell line.Citation28 However, the potential role of JAM3 in CRC remained unknown. In the present study, JAM3 downregulation was frequent in CRC. Moreover, restoration of JAM3 could suppress cell migration. These data indicated the potential role of JAM3 as a negative mediator of CRC metastasis. Furthermore, we also found that depletion of JAM3 could promote cell migration. These results revealed that JAM3 levels were essential to maintain the normal epithelial environment for colon cells.
EMT, which is known as the first step required for the complex process of metastasis, is critical for polarized epithelial cells to obtain enhanced invasion and migration abilities.Citation29,Citation30 EMT is often observed in primary tumor at the cancer invasion front.Citation31 One of the earliest changes in EMT is the loss of E-cadherin function.Citation32 A recent study demonstrated that JAM1 was associated with EMT, prompting us to investigate the relationship between JAM3 and EMT.Citation33 Our results showed that vimentin and phosphor-β-catenin (ser552) down-regulation was observed in CRC cells transfected with JAM3 vector, whereas the expression levels of epithelial molecules known to promote EMT, including E-cadherin and TJP1, were increased. Phosphorylation at ser552 induces β-catenin accumulation in the nucleus and increases its transcriptional activity.Citation34,Citation35 These results indicated that JAM3 could regulate CRC cell migration by promoting or repressing EMT.
In the present study, JAM3 methylation was found to exist not only in CRC samples but also in normal controls, which may suggest that JAM3 methylation was a potential trigger. Moreover, the frequency of JAM3 methylation in CRC tissues was the same as that in CRC cells, suggesting that other mechanisms may participate in mediating transcription, such as gene mutation. In addition, tissues have different types of cells, and each cell type may regulate JAM3 expression with a different manner in which DNA methylation may or may not be involved.Citation36
Conclusion
Our finding validated that JAM3 expression was frequently repressed in CRC and hypermethylation of JAM3 promoter contributed to its downregulation. We found JAM3 as a tumor suppressor gene based on bioinformatic, experimental, and functional analyses, thus providing a potential therapeutic target for the treatment of CRC. However, the clinical samples and CRC cell lines involved in this study were relatively limited. Therefore, large-scale studies should be conducted in the future.
Acknowledgments
This study was supported by the National Natural Science Foundation of China (No.81802323 and No.81702414), Natural Science Foundation of Fujian Province of China (No.2017Y0084 and No.2015J01557), Science and Technology Service Network Initiative Foundation of CAS (No. 2016T3009), the Fujian Provincial Health and Family Planning Commission Foundation of Youth scientific research project (No. 2015-2-43), and Xiamen Science and Technology Bureau Foundation of science and technology project for the benefit of the people (No. 3502Z20164010).
Supplementary materials
Table S1 Clinical characteristics of patients with CRC and normal controls
Table S2 Clinical characteristics of patients with CRC and normal controls in tissue array
Disclosure
The authors report no conflicts of interest in this work.
References
- SiegelRDesantisCJemalAColorectal Cancer statistics, 2014CA Cancer J Clin201464210411724639052
- IrrazábalTBelchevaAGirardinSEMartinAPhilpottDJThe multifaceted role of the intestinal microbiota in colon cancerMol Cell201454230932024766895
- LaoVVGradyWMEpigenetics and colorectal cancerNat Rev Gas-troenterol Hepatol2011812686700
- DiazLABardelliALiquid biopsies: genotyping circulating tumor DNAJ Clin Oncol201432657958624449238
- KulisMEstellerMDNA methylation and cancerAdv Genet201070275620920744
- HanFLiuWJiangXSOX30, a novel epigenetic silenced tumor suppressor, promotes tumor cell apoptosis by transcriptional activating p53 in lung cancerOncogene201534334391440225435374
- ZhouDTangWSuGPCDH18 is frequently inactivated by promoter methylation in colorectal cancerSci Rep201771281928588296
- BeckSRakyanVKThe methylome: approaches for global DNA methylation profilingTrends Genet200824523123718325624
- SchoenbornJRDorschnerMOSekimataMComprehensive epigenetic profiling identifies multiple distal regulatory elements directing transcription of the gene encoding interferon-gammaNat Immunol20078773274217546033
- DejanaEEndothelial cell-cell junctions: happy togetherNat Rev Mol Cell Biol20045426127015071551
- WolburgHNoellSMackAWolburg-BuchholzKFallier-BeckerPBrain endothelial cells and the glio-vascular complexCell Tissue Res20093351759618633647
- EbnetKSuzukiAOhnoSVestweberDJunctional adhesion molecules (JAMs): more molecules with dual functions?J Cell Sci2004117Pt 1192914657270
- ArrateMPRodriguezJMTranTMBrockTACunninghamSACloning of human junctional adhesion molecule 3 (JAM3) and its identification as the JAM2 counter-receptorJ Biol Chem200127649458264583211590146
- BradfieldPFScheiermannCNoursharghSJAM-C regulates unidirectional monocyte transendothelial migration in inflammationBlood200711072545255517625065
- KolaczkowskaEKubesPNeutrophil recruitment and function in health and inflammationNat Rev Immunol201313315917523435331
- MandicourtGIdenSEbnetKAurrand-LionsMImhofBAJAM-C regulates tight junctions and integrin-mediated cell adhesion and migrationJ Biol Chem200728231830183717099249
- HajjariMBehmaneshMSadeghizadehMZeinoddiniMJunctional adhesion molecules 2 and 3 may potentially be involved in progression of gastric adenocarcinoma tumorsMed Oncol201330138023277282
- ZenKBabbinBALiuYJAM-C is a component of desmosomes and a ligand for CD11b/CD18-mediated neutrophil transepithelial migrationMol Biol Cell20041583926393715194813
- HinoueTWeisenbergerDJLangeCPGenome-scale analysis of aberrant DNA methylation in colorectal cancerGenome Res201222227128221659424
- AnHXNiederacherDBeckmannMWERBB2 gene amplification detected by fluorescent differential polymerase chain reaction in paraffin-embedded breast carcinoma tissuesInt J Cancer19956452912977591299
- LuLKatsarosDde La LongraisIASochircaOYuHHypermeth-ylation of let-7a-3 in epithelial ovarian cancer is associated with low insulin-like growth factor-II expression and favorable prognosisCancer Res20076721101171012217974952
- TanSSunCWeiXQuantitative assessment of lung cancer associated with genes methylation in the peripheral bloodExp Lung Res2013394–518219023614702
- ShannonPMarkielAOzierOCytoscape: a software environment for integrated models of biomolecular interaction networksGenome Res200313112498250414597658
- Martìn-PaduraILostaglioSSchneemannMJunctional adhesion molecule, a novel member of the immunoglobulin superfamily that distributes at intercellular junctions and modulates monocyte transmigrationJ Cell Biol199814211171279660867
- EbnetKAurrand-LionsMKuhnAThe junctional adhesion molecule (JAM) family members JAM-2 and JAM-3 associate with the cell polarity protein PAR-3: a possible role for JAMs in endothelial cell polarityJ Cell Sci2003116Pt 193879389112953056
- YinAZhangQKongXJAM3 methylation status as a biomarker for diagnosis of preneoplastic and neoplastic lesions of the cervixOncotarget2015642443734438726517242
- SantosoSOrlovaVVSongKThe homophilic binding of junctional adhesion molecule-C mediates tumor cell-endothelial cell interactionsJ Biol Chem200528043363263633316118203
- LiXYinAZhangWJAM3 promotes migration and suppresses apoptosis of renal carcinoma cell linesInt J Mol Med20184252923292930226554
- ThieryJPEpithelial-mesenchymal transitions in tumour progressionNat Rev Cancer20022644245412189386
- ZeisbergMNeilsonEGBiomarkers for epithelial-mesenchymal transitionsJ Clin Invest200911961429143719487819
- De WeverOPauwelsPDe CraeneBMolecular and pathological signatures of epithelial-mesenchymal transitions at the cancer invasion frontHistochem Cell Biol2008130348149418648847
- JeanesAGottardiCJYapASCadherins and cancer: how does cadherin dysfunction promote tumor progression?Oncogene200827556920692919029934
- TianYTianYZhangWJunctional adhesion molecule-A, an epithelial-mesenchymal transition inducer, correlates with metastasis and poor prognosis in human nasopharyngeal cancerCarcinogenesis2015361414825416560
- FangDHawkeDZhengYPhosphorylation of beta-catenin by AKT promotes beta-catenin transcriptional activityJ Biol Chem200728215112211122917287208
- HeXCYinTGrindleyJCPTEN-deficient intestinal stem cells initiate intestinal polyposisNat Genet200739218919817237784
- ChungCHBernardPSPerouCMMolecular portraits and the family tree of cancerNat Genet200232Suppl53354012454650