
Abstract
Purpose
Increasing evidence has demonstrated that microRNAs (miRNAs) are closely related to the occurrence and development of tumors. MiR-216a-5p, located at 2p16.1, has been shown to suppress proliferation of cancerous cells. However, its expression and function in colorectal cancer (CRC) remain unclear.
Materials and methods
The significance of miR-216a-5p in CRC was studied by analyzing miR-216a-5p expression in CRC tissues and its association with clinicopathological parameters. CRC cells, stably overexpressing miR-216a-5p, were evaluated for cell proliferation and metastasis using cell counting kit-8 (CCK-8) and transwell assay methods. Epithelial–mesenchymal transition (EMT) pathway was analyzed by Western blotting. Bioinformatics, quantitative real-time polymerase chain reaction (RT-qPCR), and luciferase reporter assay were performed to define the regulation of PVT1/miR-216a-5p/Y Box Binding Protein 1 (YBX1) axis in CRC.
Results
The expression of miR-216a-5p was found to be significantly downregulated in CRC and was correlated with the various stages and differentiation degree of the tumors. Moreover, the overexpression of miR-216a-5p could significantly inhibit the tumor growth, metastasis, and EMT progression in CRC. Furthermore, the expression of miR-216a-5p was negatively correlated with the expression of PVT1, and PVT1 could reverse tumor suppressive effect of miR-216a-5p in CRC cells. Finally, YBX1 might be the key target of PVT1/miR-216a-5p axis in CRC.
Conclusion
Downregulation of miR-216a-5p by PVT1 could suppress CRC progression via modulating YBX1 expression.
Introduction
Colorectal cancer (CRC) is one of the most common malignant tumors worldwide, with mortality rate just lower than that of lung cancer, as estimated by the recent global cancer statistics.Citation1,Citation2 Despite the rapid development of various therapeutic approaches such as endoscopic, laparotomic or laparoscopic removal of tumor, chemotherapy, radiotherapy, or immunotherapy, the prognosis of patients with CRC remains unsatisfactory. Therefore, a detailed study of the underlying mechanisms of CRC progression is required to develop more precise diagnostic methods and effective treatments.Citation3,Citation4
The emerging data in the past decade have established the complex structure and function of noncoding RNAs (ncRNAs) and have altered the perception of ncRNAs from “junk” to “functional regulatory molecules”. Long non-coding RNAs (lncRNAs) and microRNAs (miRNAs) regulate numerous physiological and pathophysiological processes within cells.Citation5 MiRNAs are 20–25 nucleotides long and regulate gene expression post-transcriptionally by binding to the 3ʹ-untranslated region of target mRNAs, resulting in RNA degradation or translational inhibition.Citation6 Deregulation of miR-216a-5p has been reported in the development of prostate cancer,Citation7 hepatocellular carcinoma,Citation8 and so on. Its role as an oncogene or tumor suppressor in the complex cellular signaling network varies with cancer types and its target genes. For example, miR-216a-5p significantly suppresses cellular proliferation and/or viability in pancreatic and prostate cancers, whereas it promotes tumor progression in renal and cervical cancers. However, the expression and effects of miR-216a-5p in CRC have not been defined.
In the present study, RT-qPCR was performed to analyze the expression of miR-216a-5p in CRC tissues and its correlation with the clinicopathological parameters of CRC patients. We further explored the underlying mechanism causing the downregulation of miR-216a-5p and its role in cellular proliferation, metastasis and epithelial–mesenchymal transition (EMT) process via in vitro assays and bioinformatics analysis.
Materials and methods
Patients tissue samples
CRC and adjacent normal tissues were collected from 70 patients who were admitted to the Affiliated Cancer Hospital & Institute of Guangzhou Medical University from 2012 to 2014. The patients were not treated with radio- or chemical therapy before collection of the tissues. The pathological diagnosis of tissue samples was performed by veteran pathologists. All patients signed the informed consent before participating in this research. This study was approved by the medical ethics committee of Affiliated Cancer Hospital & Institute of Guangzhou Medical University and conducted in accordance with the Declaration of Helsinki (6th revision, 2008).
Cell culture
The intestinal normal cell line (FBS), and five CRC cell lines (LoVo, SW480, HT-29, HCT-116, and Caco-2) were acquired from ATCC (Shanghai, China). The McCoy’s 5a Medium (Gibco, Grand Island, NY, USA) with 10% fetal bovine serum (Gibco, Australia origin) was used to culture these cell lines.
RNA transfection
Hsa-miR-216a-5p and has-PVT1 cDNA plasmid (pcDNA3.1) were developed by GENESEED (Guangzhou, China). The lentiviruses expressing either miR-216a-5p (OE-miR-216a-5p) or PVT1 (OE-PVT1) and the respective negative controls (OE-vector) were constructed by GENE (Shanghai, China). The LoVo and HCT-116 cells were seeded and transfected with OE-miR-216a-5p or OE-PVT1 lentiviruses with 5 μg/mL polybrene to improve the transfection efficiency. The multiplicity of infection (MOI) is known to be 50 for LoVo cells, whereas 30 for HCT-116 cells. Seven days later, stably transfected cells were collected for further study. The sequences of miR-216a-5p mimics are shown in .
Table 1 Sequences of oligomers and primers used in the study
Quantitative real-time polymerase chain reaction
Total RNA from the frozen tissues and cell lines were extracted by RNAiso Plus reagent (TaKaRa, Dalian, China), followed by reverse transcription using PrimeScript RT Master Mix (TaKaRa), according to the manufacturer’s instruction. Next, the SYBR Premix Ex Taq II Kit (TaKaRa) was used to determine the expression of target genes using StepOnePlus system (Applied Biosystems, CA, USA). 2−ΔΔCt method was applied to detect the fold changes. The primers sequences are listed in .
Cell counting kit 8 assay
The OE-miR-216a-5p or OE-PVT1 cells (LoVo and HCT-116) were plated into 96-well plates at the concentration of 5×10³ cells/well. Next, CCK-8 (Donjindo, Kumamoto, Japan) was added to the wells according to the manufacturer’s instructions. Optical density was measured using microplate reader (Bio-Rad, Hercules, CA, USA) to the cell viability.
Cell migration assay
The transwell assays were performed to analyze cellular migration and invasion abilities. First, 500 μL McCoy’s 5a Medium with 10% fetal bovine serum was added into the lower chambers, followed by the addition of 200 μL serum-free McCoy’s 5a medium containing 5×10⁴ cells into the upper chambers. After 24 hrs, non-migrating and non-invading cells were removed from the upper surface of the membranes. Attached cells were stained in 0.5% crystal violet, and the cell migration and invasion ability were evaluated through the digital imaging of the cells.
Western blot analysis
Total protein was extracted from cells, and its concentration was analyzed through the BCA protein Assays Kit (Thermo Fisher Scientific; Shanghai, China). Twenty micrograms of each protein samples were separated on SDS-PAGE gel and transferred onto the polyvinylidene fluoride (PVDF) membranes. Next, the PVDF membranes were incubated with 10% BSA, followed by primary and secondary antibody incubations. Finally, the protein bands were visualized by GeneSnap using SynGene system.
Dual-luciferase reporter assays
Based on publicly available bioinformatic algorithms (Starbase), miR-216a-5p is predicted as a downstream target of PVT1. To address this issue, the 293T cells were seeded in 24-well plates at the concentration of 5×10⁴ cells/well. Subsequently, cells were transfected with miR-216a-5p mimics or negative control (NC), with pmirGLO-PVT1-WT (wild type) or pmirGLO-PVT1-MUT (mutant) plasmid. After 48 hrs, cells were lysed in passive lysis buffer, and the relative luciferase activity was calculated with the dual-luciferase reporter assay (Promega, Madison, WI, USA). The firefly luminescence was normalized to Renilla luminescence. According to Starbase algorithm, miR-216a-5p is also predicted to directly regulate the YBX1 expression. Similarly, to address this point, 293T cells were transfected with miR-216a-5p mimics or miR-216a-5p NC, along with pmirGLO-YBX1-WT or pmirGLO-YBX1-MUT plasmid, followed by dual-luciferase reporter assay.
Statistics
All data in this study are shown as mean±standard deviation (SD). In addition, all statistical data were analyzed in the IBM SPSS Statistics 20.0 (IBM, IL, USA). The chi-square test, two-tailed Student’s t-test, Mann–Whitney U test, analysis of variance (ANOVA) and Kruskal–Wallis test were applied to evaluate the data. The Kaplan–Meier method and log-rank test were performed to analyze the survival data, significant difference was considered at P<0.05.
Results
Downregulation of miR-216a-5p in CRC
In order to evaluate the correlation between the miR-216a-5p expression and the clinicopathological characteristics in CRC patients, miR-216a-5p expression was estimated in cancerous and adjacent normal tissues. MiR-216a-5p was significantly downregulated in cancerous tissue as compared to adjacent normal tissues (). Moreover, low-expression of miR-216a-5p accounted for 77.14% (54/70) of CRC specimens (). Further, low expression of miR-216a-5p in CRC patients was correlated to have higher T () and N stages () and shorter disease-free survival (DFS) (). Although no significant correlation was observed between differential expression of miR-216a-5p among patients and their tumor size (), and its differentiation stages (), these results showed that miR-216a-5p can be a promising prognostic biomarker for CRC.
Figure 1 The expression profile of miR-216a-5p in CRC tissues and its correlation with clinicopathological parameters of CRC patients. (A) RT-qPCR results showing significant downregulation of miR-216a-5p in CRC tissues than in adjacent normal tissues. (B) Waterfall plot showing relatively low expression of miR-216a-5p in 77.14% (54/70) patients; the data are represented as Log2 (T/N). Scatter plots showing correlation analysis between miR-216a-5p expression and (C) tumor differentiation, (D) tumor size, (E) T stage, and (F) N stage of the tumor. (G) Kaplan–Meirr plot showing the correlation between miR-216a-5p expression and duration of disease-free survival (DFS) in patients. Note that each dot represents a patient. **P<0.01, ***P<0.001, N.S. means “not significant.”
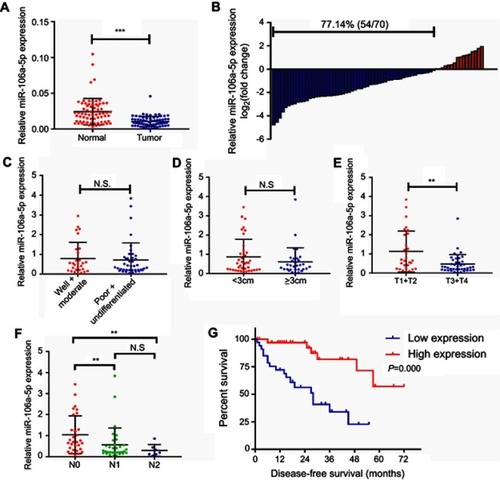
Furthermore, CRC patients were divided into two groups; a high-expression group and low-expression group, based on the median expression of the miR-216a-5p. Consistent with the earlier data, the expression of miR-216a-5p was closely related to the lymphatic metastasis (P=0.014) and T stage (P=0.029) (). Furthermore, Cox analyses showed that lymphatic metastasis (P=0.020) and miR-216a-5p expression (P=0.005) are independent risk factors for DFS of patients with CRC (). Together, these results demonstrated that miR-216a-5p expression is negatively related with the poor prognosis of CRC patients.
Table 2 Correlation between miR-216a-5p expression and clinicopathological characteristics of colorectal cancer patients
Table 3 Cox analyses of disease-free survival in colorectal cancer patients
MiR-216a-5p overexpression suppresses the CRC cells proliferation in vitro
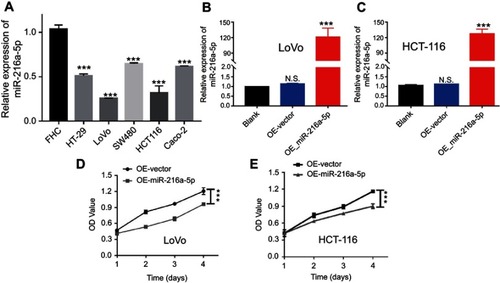
The gain-of-function experiments were performed to further demonstrate the biological role of miR-216a-5p in CRC. The RT-qPCR results showed a significantly lower endogenous expression of miR-216a-5p in CRC cell lines (HT-29, LoVo, SW480, HCT-116, and Caco-2) when compared to a normal intestinal normal cell line (FHC), with lowest expression in HCT-116 and LoVo cells (). Next, we stably overexpressed miR-216a-5p in HCT-116 and LoVo cells (OE-miR-216a-5p) via lentiviral transfection, and expression of miR-216a-5p was compared with a negative control group (OE-vector) as well as with a naive group (non-transfected cells). As shown in and , OE-miR-216a-5p cells showed a significantly increased expression of miR-216a-5p when compared to OE-vector and naive cells. Subsequently, CCK-8 assays were performed to evaluate the in vitro proliferation abilities of OE-miR-216a-5p cell lines. The results showed that the miR-216a-5p upregulation effectively suppresses the proliferation of LoVo and HCT-116 cells ( and ).
Figure 2 Overexpression of miR-216a-5p suppresses the proliferation of CRC cells in vitro. (A) Bar diagram showing the relatively low expression of miR-216a-5p in CRC cell lines (HT-29, LoVo, SW480, HCT-116, and Caco-2) as compared to normal intestinal cell line (FHC). (B and C) RT-qPCR results showing the overexpression of miR-216a-5p in stable OE-miR-216a-5p LoVo and HCT-116 cell lines, as compared to OE-vector cells. (D and E) CCK-8 assay showing the effect of miR-216a-5p upregulation on proliferation of LoVo and HCT-116 cells. All experiments were repeated at least three times. ***P<0.001, N.S. means “not significant.”
Overexpression of miR-216a-5p inhibits cell metastasis via silencing the EMT pathway in CRC cell lines
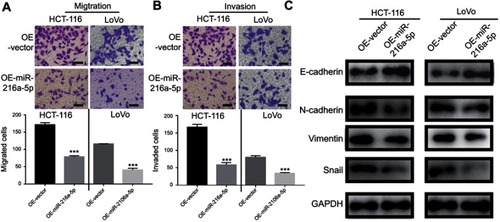
Given that the expression level of miR-216a-5p was correlated to the lymph node metastasis, we hypothesized a role of miR-216a-5p in the regulation of CRC metastasis. Therefore, Transwell assays were performed to evaluate the effect of miR-216a-5p on cellular migration and invasion capabilities. The OE-miR-216a-5p cells showed significantly reduced cellular migration () and () invasion in HCT-116 and LoVo cells. To study the potential mechanism of miR-216a-5p as a tumor-suppressor miRNA, the protein expression of EMT-related markers was analyzed. Interestingly, OE-miR-216a-5p cells showed an increase in the expression of E-cadherin (an epithelial marker) and a lower expression of N-cadherin, Vimentin, and Snail (the mesenchymal markers), when compared to OE-vector (). Therefore, we concluded that miR-216a-5p inhibits metastasis and EMT progression in CRC.
Figure 3 MiR-216a-5p suppresses migration, invasion, and EMT in CRC cell lines. Transwell assay showing reduced (A) cell migration and (B) cell invasion upon overexpression of miR-216a-5p in HCT-116 and LoVo cell. (C) Immunoblots showing increased and decreased expression of E-cadherin (epithelial marker) and N-cadherin/Vimentin/Snail (mesenchymal markers) respectively, upon overexpression of miR-216a-5p in HCT-116 and LoVo cells. ***P<0.001.
MiR-216a-5p is a direct target of PVT1 in CRC
Next, based on Starbase prediction, we addressed the possibility of miR-216a-5p acting as a downstream target of PVT1. To test this, we first evaluated the expression pattern of PVT1 in CRC patients. As shown in , PVT1 was overexpressed in 83.33% (25/30) patients with CRC. Consistently, the expression level of PVT1 was significantly higher in CRC tissues as compared to adjacent normal tissues (). Further, a negative correlation was observed between the expression levels of miR-216a-5p and PVT1 (, r=−0.3048, P=0.00016). These results showed that PVT1 and miR-216a-5p were highly associated with CRC.
Figure 4 MiR-216a-5p is a direct target of lncRNA PVT1 in CRC. (A) Waterfall plot showing relatively high expression of PVT1 in 83.33% (25/30) patients; the data are represented as Log2 (T/N). (B) Scatter plot showing higher expression of PVT1 in CRC tissues than that of adjacent normal tissues, evaluated by RT-qPCR. (C) Correlation analysis between the expression level of miR-216a-5p and PVT1 in 30 paired CRC tissues. (D) Illustration is showing the predicted sequence of the miR-216a-5p binding site on 3ʹUTR of PVT1 mRNA. Sequence of the mutated binding site in PVT1 is also represented. (E) The relative luciferase activity pmirGLO-PVT1-WT or pmirGLO-PVT1-MUT 293T cells, upon transfection with miR-216a-5p mimics or negative control (miR-216a-5p NC). (F) RT-qPCR data showing the relative expression of miR-216a-5p in OE-miR-216a-5p cells, upon overexpression of PVT1. *P<0.05, ***P<0.001.
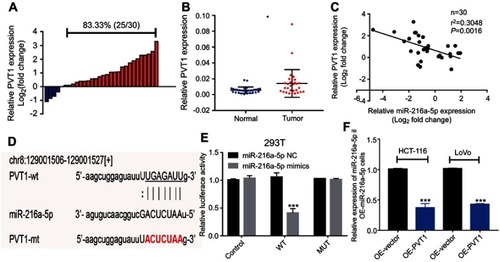
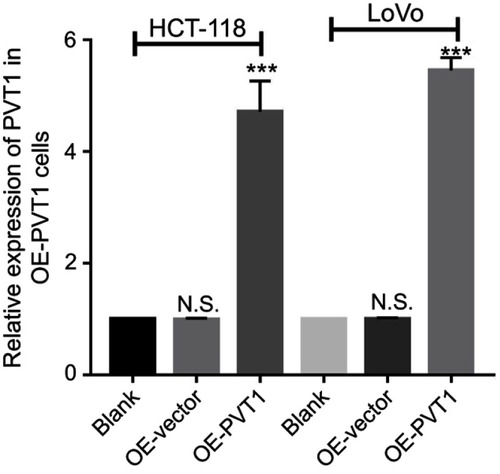
To further explore their relationship, we predicted a miR-216a-5p binding site at 3ʹUTR region of PVT1 (). Luciferase tagged PVT1-wild type (pmirGLO-PVT1-WT) and PVT1-mutant type (pmirGLO-PVT1-MT) 293T cells were constructed and proceeded for luciferase assays. Luciferase activity was dramatically decreased in pmirGLO-PVT1-WT as compared to pmirGLO-PVT1-MT cells when treated with miR-216a-5p mimics (). Furthermore, we successfully constructed the PVT1-overexpressed (OE-PVT1) HCT-116 and LoVo cell lines via lentiviral transfection (). Interestingly, miR-216a-5p expression was found to be dramatically downregulated in OE-PVT1 cells as compared to the control group (). Therefore, we concluded that PVT1 might be an upstream regulator of miR-216a-5p in CRC.
Upregulation of PVT1 rescues the anti-proliferative phenotype of OE- miR-216a-5p cells
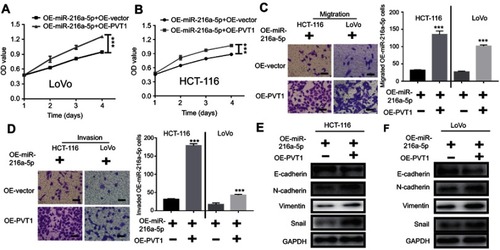
Because the high expression of miR-216a-5p could inhibit proliferation, metastasis, and EMT progression in CRC, its tumor suppressive function might be reversed by the upregulation of PVT1, as miR-216a-5p is predicted as a direct target of PVT1. To confirm this hypothesis, proliferation, metastasis, and EMT progression of OE-miR-216a-5p cells were evaluated under overexpression of PVT1. According to CCK-8 assay, OE-miR-216-5p showed a higher cell proliferation when transfected with OE-PVT1 as compared to OE-vector ( and ). Consistently, migration and invasion of cells were increased after transfection with OE-PVT1 as compared to OE-vector ( and ). Similar rescue effect was observed when expression of EMT markers was analyzed ( and ).
Figure 5 Upregulation of PVT1 reverses the anti-proliferative effect of miR-216a-5p overexpressed (OE- miR-216a-5p) CRC cells. (A and B) CCK-8 assay showing the effect of PVT1 upregulation on proliferation of OE-miR-216a-5p LoVo and HCT-116 cells. Transwell assay showing increased (C) cell migration and (D) cell invasion upon overexpression of PVT1 in OE-miR-216a-5p cells. (E) Immunoblots showing decreased and increased expression of E-cadherin (epithelial marker) and N-cadherin/Vimentin/Snail (mesenchyme markers) respectively, upon overexpression of PVT1 in OE-miR-216a-5p cells. ***P<0.001.
YBX1 might be the key target of PVT1/miR-216a-5p axis in CRC
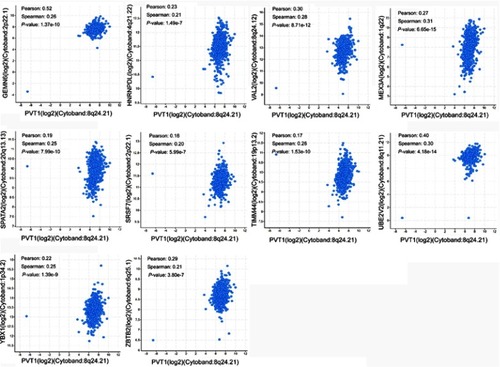
In order to find the downstream target of PVT1/miR-216a-5p axis in CRC, we shortlisted only those 200 target genes of miR-216a-5p, which were predicted by both TargetScan and miRanda databases (). Next, we shortlisted some genes that are co-expressed with PVT1, using cBioPortal (http://www.cbioportal.org). By drawing a Venn diagram, we found 10 overlapping genes () that were suspected to be the potential targets for PVT1/miR-216a-5p axis; further analyses were performed (). Next, protein–protein interaction (PPI) network analysis was performed on the selected 10 genes using STRING. YBX1 was found to be located at the central position, which indicates that YBX1 might play the key role downstream of PVT1/miR-216a-5p axis ().
Figure 6 YBX1 might be the key target of PVT1/miR-216a-5p axis in CRC. (A) Predicted target genes of miR-216a-5p from TargetScan and miRanda databases, with 200 common predicted targets. (B) Venn diagram representing the potential 10 target genes, regulated by both PVT1 and miR-216a-5p. (C) Protein–protein interaction networks of the 10 target genes regulated by PVT1/miR-216a-5p axis using STRING database. (D) RT-qPCR data showing the relative expression of YBX1 mRNA in miR-216a-5p and/or PVT1 upregulated CRC cells. (E) Illustration showing the predicted sequence of the miR-216a-5p binding site on 3ʹUTR of YBX1 mRNA. Sequence of the mutated binding site in YBX1 is also represented. (F) The relative luciferase activity pmirGLO-YBX1-WT or pmirGLO-YBX1-MUT 293T cells, upon transfection with miR-216a-5p mimics or negative control (miR-216a-5p NC). ***P<0.001.
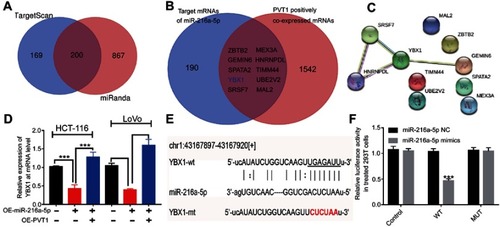
To further explore the involvement of YBX1, its mRNA level was estimated in OE-PVT1 and OE-miR-216a-5p cells. The results showed that the expression of YBX1 was found to be downregulated in OE-miR-216a-5p cells, and this effect was reversed by the overexpression of PVT1 (). We also predicted the binding regions of miR-216a-5p on 3ʹUTR of YBX1 mRNA and constructed pmirGLO-YBX1-WT and pmirGLO-YBX1-MT 293T cells (). As shown in , the luciferase activity of pmirGLO-YBX1-WT cells was dramatically reduced in the presence of miR-216a-5p mimics, which remains unchanged in pmirGLO-YBX1-MT cells (). Therefore, we concluded that YBX1 might be the key downstream regulatory target of PVT1/miR-216a-5p axis in CRC.
Discussion
The rates of colorectal cancer are rising equally among women and men,Citation1,Citation9 and despite the availability of advanced laparoscopic techniques and molecular target therapies, the 5-year survival rate is still unsatisfactory.Citation10 Thus, identification of novel biomarkers for diagnosis and prognosis of CRC is urgently needed. In recent years, a plethora of evidences suggest that miRNAs play a significant role in the development of tumors.Citation11–Citation13 The dysfunction of miRNAs interferes with gene expression at the post-transcriptional level, resulting in deregulation of tumor growth, metastasis, and drug resistance.Citation14,Citation15 For example, Guo et al have demonstrated that miRNA-532-3p can inhibit the gastric cancer cell proliferation via suppressing the expression of Rab3IP.Citation16 MiR-216a-5p has been reported as an inhibitor for several malignant tumors such as hepatocellular and thyroid carcinoma.Citation17,Citation18 However, the exact function of miR-216a-5p in CRC remains largely unknown. Therefore, in the present study, we attempted to investigate the function and underlying mechanism of miR-216a-5p in CRC.
We first demonstrated that the miR-216a-5p was downregulated in the CRC tissues. Next, the correlation analysis between the miR-216a-5p expression and the clinicopathologic characteristics of CRC patients indicated that the patients with lower expression of miR-216a-5p had poor prognosis. Consistent with the earlier findings, in vitro analyses showed that miR-216a-5p overexpression could significantly inhibit the proliferation, cellular migration, and invasion capabilities of CRC cell lines. Together, we suggest that miR-216a-5p suppresses cancer progression and might be a promising biomarker for the treatment of CRC. However, the potential mechanism of miR-216a-5p as a tumor suppressor remains unidentified.
The transition of cells from epithelial to mesenchymal phenotype (EMT) enhances the migratory and invasive properties of cancerous cells and cause metastasis of malignant tumor.Citation19,Citation20 MiRNAs are reported to regulate EMT mediated metastasis.Citation21–Citation23 MiR-320 has been shown to suppress EMT by regulating the expression of KLF5 and HIF-1α, in turn suppressing the migration and invasion of gastric cancer.Citation24 Further, Pan et al have reported that miR-4429 inhibits CDK6 expression and suppress tumor progression of clear cell renal cell carcinoma by interfering with the EMT pathway.Citation25 In our correlation analysis, a significant association of miR-216a-5p expression with tumor stage and lymphatic metastasis was observed. Furthermore, the overexpression of miR-216a-5p leads to simultaneous upregulation of E-cadherin and downregulation of N-cadherin, Vimentin, and Snail expression. Taken them together, we propose that miR-216a-5p exerts anti-metastatic role in CRC by deregulating the EMT pathway.
In recent years, a lot of attention has been directed toward long non-coding RNAs (lncRNAs), due to their significant role in the development of tumors.Citation26–Citation28 It has been established that lncRNAs suppress the function of miRNAs through molecular sponging.Citation29 A novel plasmacytoma variant translocation 1 (PVT1) lncRNA, located at 8q24.21, has been shown as an important regulator of CRC.Citation30,Citation31 Consistent with the previous reports, we demonstrated that PVT1 is upregulated in the CRC tissues. Additionally, we showed a negative correlation between PVT1 and miR-216a-5p expression levels, which was confirmed by the dual-luciferase reporter assays. Further, anti-tumor effects on proliferation, migration, invasion, and EMT process of miR-216a-5p were rescued in the cells with PVT1 overexpression. Therefore, we concluded that PVT1 might be an upstream regulator of miR-216a-5p in CRC.
Y-box binding protein 1 (YBX1) is a multifunctional oncoprotein that deregulates numerous genes involved in cell proliferation, survival, drug resistance, chromatin destabilization, and metastasis of various cancers.Citation32 Upregulation of YBX1 in CRC is demonstrated associated with local recurrence; its expression in tumor tissues was an independent prognostic factor for overall survival of CRC patients.Citation33 Furthermore, YBX1 is reported as a key inducer of partial EMT and tumorigenicity by elevating the secretion of angiogenic factors such as TGF-β, CSF-1, NGF, VGF, ADAM9, and ADAM17.Citation34 Another study has suggested that overexpression of YBX1 in lung adenocarcinoma cells promotes TGF-β1-induced EMT via upregulation of the phosphorylation level of Akt.Citation35 In our study, using TargetScan, miRanda, and cBioPortal databases, we predicted YBX1 as a downstream target of PVT1/miR-216a-5p axis in CRC. Subsequently, the results of the luciferase reporter assay validated the relationship between the YBX1 and the PVT1/miR-216a-5p axis, where the luciferase activity was significantly lower in pmirGLO-YBX1-WT cells as compared to pmirGLO-YBX1-MT, when treated with miR-216a-5p mimics. Therefore, we propose that miR-216a-5p inhibits tumor growth and metastasis by directly regulating YBX1 expression.
Conclusion
In summary, our results revealed that the overexpression of miR-216a-5p might silence YBX1 expression, thus resulting in inhibition of cell proliferation, metastasis, and the EMT pathway of CRC cells. Furthermore, we suggest that PVT1 upregulation can reverse the anti-tumor effect of miR-216a-5p on CRC cells. Therefore, miR-216a-5p might be a promising prognostic and therapy biomarker for CRC.
Availability of data and materials
The datasets used during the present study are available from the corresponding author upon reasonable request.
Disclosure
The authors declare that they have no competing interests in this work.
Acknowledgments
We would like to thank Editage for their English language editing service. This research was supported by Guangzhou science and technology planning project (201804010077).
Supplementary materials
Figure S1 The overexpression efficiency of PVT1 by a lentivirus-based method in LoVo and HCT-116 cell lines.
Note: ***P<0.001, N.S. means not significant.
References
- Bray F, Ferlay J, Soerjomataram I, Siegel RL, Torre LA, Jemal A. Global cancer statistics 2018: GLOBOCAN estimates of incidence and mortality worldwide for 36 cancers in 185 countries. CA Cancer J Clin. 2018;68:394–424. doi:10.3322/caac.2149230207593
- Chen W, Zheng R, Baade PD, et al. Cancer statistics in China, 2015. CA Cancer J Clin. 2016;66(2):115–132. doi:10.3322/caac.2133826808342
- Kagawa Y, Yamada D, Yamasaki M, et al. The association between the increased performance of laparoscopic colon surgery and a reduced risk of surgical site infection. Surg Today. 2019;49:474–481. doi:10.1007/s00595-019-1760-130684051
- Zhang L, Yu X, Zheng L, et al. Lineage tracking reveals dynamic relationships of T cells in colorectal cancer. Nature. 2018;564(7735):268–272. doi:10.1038/s41586-018-0694-x30479382
- Taucher V, Mangge H, Haybaeck J. Non-coding RNAs in pancreatic cancer: challenges and opportunities for clinical application. Cell Oncol (Dordr). 2016;39(4):295–318. doi:10.1007/s13402-016-0275-727060060
- Liu AM, Poon RT, Luk JM. MicroRNA-375 targets Hippo-signaling effector YAP in liver cancer and inhibits tumor properties. Biochem Biophys Res Commun. 2010;394(3):623–627. doi:10.1016/j.bbrc.2010.03.03620226166
- Yang B, Gao G, Wang Z, et al. Long non-coding RNA HOTTIP promotes prostate cancer cells proliferation and migration by sponging miR-216a-5p. Biosci Rep. 2018;38(5):BSR20180566.29884766
- Bai J, Yao B, Wang L, et al. lncRNA A1BG-AS1 suppresses proliferation and invasion of hepatocellular carcinoma cells by targeting miR-216a-5p. J Cell Biochem. 2019;120(6):1–13. doi:10.1002/jcb.28315
- Weinberg BA, Marshall JL, Salem ME. The growing challenge of young adults with colorectal cancer. Oncol. 2017;31(5):381–389.
- Rychahou P, Bae Y, Reichel D, et al. Colorectal cancer lung metastasis treatment with polymer-drug nanoparticles. J Controlled Release. 2018;275:85–91. doi:10.1016/j.jconrel.2018.02.008
- Huang S, Zou C, Tang Y, et al. miR-582-3p and miR-582-5p suppress prostate cancer metastasis to bone by repressing TGF-beta signaling. Mol Ther Nucleic Acids. 2019;16:91–104. doi:10.1016/j.omtn.2019.01.00430852380
- Wu G, Zheng H, Xu J, et al. miR-429 suppresses cell growth and induces apoptosis of human thyroid cancer cell by targeting ZEB1. Artif Cells Nanomed Biotechnol. 2019;47(1):548–554. doi:10.1080/21691401.2018.156432030849921
- Ren L, Chen H, Song J, et al. MiR-454-3p-mediated Wnt/beta-catenin signaling antagonists suppression promotes breast cancer metastasis. Theranostics. 2019;9(2):449–465. doi:10.7150/thno.2905530809286
- Wang T, Chen G, Ma X, et al. MiR-30a regulates cancer cell response to chemotherapy through SNAI1/IRS1/AKT pathway. Cell Death Dis. 2019;10(3):153. doi:10.1038/s41419-019-1326-630770779
- Nakamura K, Sawada K, Miyamoto M, et al. Downregulation of miR-194-5p induces paclitaxel resistance in ovarian cancer cells by altering MDM2 expression. Oncotarget. 2019;10(6):673–683. doi:10.18632/oncotarget.2658630774764
- Guo W, Chen Z, Chen Z, et al. Promotion of cell proliferation through inhibition of cell autophagy signalling pathway by Rab3IP is restrained by MicroRNA-532-3p in gastric cancer. J Cancer. 2018;9(23):4363–4373. doi:10.7150/jca.2753330519341
- Wang J, Pu J, Zhang Y, et al. DANCR contributed to hepatocellular carcinoma malignancy via sponging miR-216a-5p and modulating KLF12. J Cell Physiol. 2019;234(6):9408–9416. doi:10.1002/jcp.2762530430564
- Liang L, Xu J, Wang M, et al. LncRNA HCP5 promotes follicular thyroid carcinoma progression via miRNAs sponge. Cell Death Dis. 2018;9(3):372. doi:10.1038/s41419-018-0382-729515098
- Chen D, Yu D, Wang X, et al. Epithelial to mesenchymal transition is involved in ethanol promoted hepatocellular carcinoma cells metastasis and stemness. Mol Carcinog. 2018;57(10):1358–1370. doi:10.1002/mc.2285030295962
- Li Z, Huang J, Shen S, et al. SIRT6 drives epithelial-to-mesenchymal transition and metastasis in non-small cell lung cancer via snail-dependent transrepression of KLF4. J Exp Clin Cancer Res. 2018;37(1):323. doi:10.1186/s13046-018-0984-z30577808
- Lin X, Wang S, Sun M, et al. miR-195-5p/NOTCH2-mediated EMT modulates IL-4 secretion in colorectal cancer to affect M2-like TAM polarization. J Hematol Oncol 2019;12(1):20.
- Wu Y, Shi W, Tang T, et al. miR-29a contributes to breast cancer cells epithelial-mesenchymal transition, migration, and invasion via down-regulating histone H4K20 trimethylation through directly targeting SUV420H2. Cell Death Dis. 2019;10(3):176. doi:10.1038/s41419-019-1437-030792382
- Shi DM, Li LX, Bian XY, et al. miR-296-5p suppresses EMT of hepatocellular carcinoma via attenuating NRG1/ERBB2/ERBB3 signaling. J Exp Clin Cancer Res. 2018;37(1):294. doi:10.1186/s13046-018-0957-230486894
- Zhou Y, Xu Q, Shang J, Lu L, Chen G. Crocin inhibits the migration, invasion, and epithelial-mesenchymal transition of gastric cancer cells via miR-320/KLF5/HIF-1alpha signaling. J Cell Physiol. 2019. doi:10.1002/jcp.28418
- Pan H, Hong Y, Yu B, Li L, Zhang X. miR-4429 inhibits tumor progression and epithelial-mesenchymal transition via targeting CDK6 in clear cell renal cell carcinoma. Cancer Biother Radiopharm. 2019. doi:10.1089/cbr.2018.2697
- Wang Q, Feng Y, Peng W, et al. Long noncoding RNA Linc02023 regulates PTEN stability and suppresses tumorigenesis of colorectal cancer in a PTEN-dependent pathway. Cancer Lett. 2019. doi:10.1016/j.canlet.2019.02.041
- Gao F, Feng J, Yao H, Li Y, Xi J, Yang J. LncRNA SBF2-AS1 promotes the progression of cervical cancer by regulating miR-361-5p/FOXM1 axis. Artif Cells Nanomed Biotechnol. 2019;47(1):776–782. doi:10.1080/21691401.2019.157788330856345
- Yang C, Wang L, Sun J, et al. Identification of long noncoding RNA HERC2P2 as a tumor suppressor in glioma. Carcinogenesis. 2019. doi:10.1093/carcin/bgz043
- Ye ZM, Yang S, Xia YP, et al. LncRNA MIAT sponges miR-149-5p to inhibit efferocytosis in advanced atherosclerosis through CD47 upregulation. Cell Death Dis. 2019;10(2):138. doi:10.1038/s41419-019-1409-430755588
- Zhou DD, Liu XF, Lu CW. Long non-coding RNA PVT1: emerging biomarker in digestive system cancer. 2017;50(6): e12398. doi:10.1111/cpr.12398
- Zhang R, Li J, Yan X, et al. Long noncoding RNA Plasmacytoma Variant Translocation 1 (PVT1) promotes colon cancer progression via endogenous sponging miR-26b. Med Sci Monit. 2018;24:8685–8692. doi:10.12659/MSM.91095530504754
- Kuwano M, Shibata T, Watari K, Ono M. Oncogenic Y-box binding protein-1 as an effective therapeutic target in drug-resistant cancer. Cancer Sci. 2019;110:1536–1543. doi:10.1111/cas.2019.110.issue-530903644
- Yan X, Yan L, Zhou J, et al. High expression of Y-box-binding protein 1 is associated with local recurrence and predicts poor outcome in patients with colorectal cancer. Int J Clin Exp Pathol. 2014;7(12):8715–8723.25674237
- Gopal SK, Greening DW, Mathias RA, et al. YBX1/YB-1 induces partial EMT and tumourigenicity through secretion of angiogenic factors into the extracellular microenvironment. Oncotarget. 2015;6(15):13718–13730. doi:10.18632/oncotarget.376425980435
- Ha B, Lee EB, Cui J, Kim Y, Jang HH. YB-1 overexpression promotes a TGF-beta1-induced epithelial-mesenchymal transition via Akt activation. Biochem Biophys Res Commun. 2015;458(2):347–351. doi:10.1016/j.bbrc.2015.01.11425645014