
Abstract
Purpose
Papillary thyroid carcinoma (PTC) is the most common endocrine malignancy, and its incidence has continuously increased in recent years. Therefore, it is essential to develop more useful therapeutic strategies.
Methods
We collected 56 pairs of PTC tissues and adjacent normal tissues and determined the expression patterns of linc01278, miR-376c-3p and DNM3. In addition, we analyzed the relationship between linc01278 expression and pathological information of PTC patients. Furthermore, the effects of linc01278, miR-376c-3p and DNM3 overexpression on proliferation, clonality, apoptosis, migration and invasion of PTC cell lines TPC1 and BCPAP were evaluated. The dual luciferase reporter assay was used to confirm the direct interaction between miR-376c-3p and linc01278.
Results
Linc01278 and DNM3 were remarkably down-regulated in PTC tissues and cell lines, whereas miR-376c-3p was significantly up-regulated. In addition, lower linc01278 expression was associated with increased tumor size, lymph node metastasis and higher clinical stage. Linc01278 inhibited cell proliferation of PTC cells by inducing apoptosis, and demonstrated attenuating effects on migration and invasion abilities of PTC cells by regulating the EMT process. More importantly, dual luciferase reporter experiments demonstrated the direct interaction between miR-376c-3p and linc01278, which revealed that DNM3 was a novel target of miR-376c-3p. The miR-376c-3p mimic significantly promoted the proliferation, migration and invasion of PTC cells, and inhibited cell apoptosis. Overexpression of DNM3 abolished the effects of the miR-376c-3p mimic on PTC cells. DNM3 expression was negatively correlated with miR-376c-3p expression, but was positively correlated with linc01278 expression.
Conclusion
Overall, we found that linc01278 can act as a competing endogenous RNA (ceRNA) to sponge miR-376c-3p, thereby positively regulating DNM3 expression and ultimately acting as a tumor suppressor gene in PTC progression.
Introduction
Thyroid cancer (TC) is the most common endocrine malignancy with an increased incidence in recent years.Citation1 Papillary thyroid carcinoma (PTC) is the major histological subtype, accounting for 80–85% of all thyroid cancers.Citation2 PTC patients can be treated with surgical resection and thyroid stimulation hormone (TSH) suppression, resulting in a good prognosis for most patients.Citation3 However, some patients who are not sensitive to therapy tend to show recurrence or metastasis, leading to a poor prognosis.Citation3,Citation4 Therefore, it is essential to find alternative therapeutic strategies.
Long non-coding RNAs (lncRNAs) are transcripts of at least 200 nucleotides in length that do not contain anyprotein coding capacity.Citation5 Accumulating evidences suggest that lncRNAs participate in the development and/or progression of cancer in a variety of tumor types, including PTC, by regulating gene expression at the transcriptional, post-transcriptional and epigenetic levels.Citation6 Among them, lncRNAs have been shown to function as competitive endogenous RNAs (ceRNAs) to sponge miRNAs, thereby regulating the expression of target genes downstream.Citation7,Citation8 For example, ENS-653 was observed to be highly expressed in PTC tissue samples compared to adjacent normal tissues and was associated with larger tumor sizes and more advanced clinical stages.Citation9
In this study, we first evaluated the expression pattern of linc01278 in PTC tissues and cell lines, then examined the biological function of linc01278 in PTC cells. We determined that linc01278 can act as a ceRNA to sponge miR-376c-3p, thereby positively regulating the expression of DNM3 and ultimately acting as a tumor suppressor gene in PTC progression.
Materials and methods
Tissue collection
Fresh surgical samples were collected from 56 patients diagnosed with PTC who underwent surgical resection at the Sun Yat-Sen Memorial Hospital between February 2017 and March 2018. The PTC tissues included 31 classic subtypes, 18 diffuse follicular subtypes, 4 diffuse sclerotic subtypes, and 3 high columnar cell subtypes. None of the patients had any malignant tumors or serious disearses other than PTC, and had not received radiotherapy or any other therapy before surgery. Participants provided written informed consent prior to the beginning of this experiment.
RNA extraction and qRT-PCR
Tissues and cellular RNA were isolated using Trizol reagent (Invitrogen, Carlsbad, CA, USA). RNA concentration and purity were determined using a NanoDrop 2000 (Thermo Scientific, Wilmington, DE, USA). cDNA was synthesized using the PrimeScript RT reagent kit (Takara, Tokyo, Japan). qRT-PCR was performed with a SYBR Premix Ex Taq™ kit (TaKaRa, Dalian, China). The relative expression of genes were normalized to GAPDH or U6, and measured with the 2−ΔΔCt method.
Cell culture and transfection
Three human PTC cell lines (BCPAP, K1, and TPC1) and one normal human thyroid cell line (Nthy-ori3-1) were obtained from the Cell Resource Database of Chinese Academy of Sciences (Shanghai, China). Cells were maintained in Dulbecco’s Modified Eagle’s Medium (DMEM) (Thermo Fisher Scientific, Waltham, MA, USA) together with 100 U/mL penicillin, 100 mg/mL streptomycin and 10% fetal bovine serum (FBS) (Sigma-Aldrich, St. Louis, MO, USA) in 5% CO2 at 37 °C.
The full-length sequence of linc01278 and coding sequence (CDS) of DNM3 were cloned into pcDNA 3.1 plasmid vector (GenePharma, Shanghai, China), respectively, to aid in overexpression. Moreover, miR-376c-3p mimics and their negative controls (miR-NC) were synthesized from RiboBio (Guangzhou, China). LipofectamineTM 2000 reagent (Thermo Fisher Scientific, USA) was used to conduct the cell transfection assay in accordance with the manufacturer’s instruction.
Cell proliferation assays
Cell proliferation was analyzed by CCK-8 and colony formation assays. Cells were cultured into 96-well plates at a ratio of 2×10³ cells per well. After treatment for 0 h, 24 h, 48 h and 72 h, the culture medium was removed from each well and replaced with 100 μl of fresh medium containing 10 μl CCK8 solution (Beyotime Biotechnology, Shanghai, China), then incubated at 37 °C for 2 h. The OD value was determined using a microplate reader at a wavelength of 450 nm. For the colony forming assay, treated cells were maintained in six-well plates and normally cultured. After two weeks, cells were fixed with methanol and stained with 0.1% crystal violet. Visible colonies were counted and images were obtained.
Flow cytometry analysis
In orded to analyze of apoptosis, cells were first cultured in non-serum medium and harvested after 48 h of treatment. Subsequently, the cells were resuspended to 1-5×10⁶/mL by Annexin V binding buffer, and double stained with V-FITC and propidium iodide (BD Biosciences, Franklin Lakes, NJ, USA). Finally, cell apoptosis was analyzed by flow cytometry.
Western blot
All tissues and cellular proteins were dissolved in RIPA buffer containing protease and phosphatase inhibitors (Roche, Basel, Switzerland) and quantified with a BCA Protein Assay Kit (Tiangen, Beijing, China). Equal proteins were separated by 10% SDS-PAGE gel, then transferred onto PVDF membranes. The membranes were incubated with 5% non-fat milk for 1 h at room temperature, then primary antibodies were added prior to further incubation at 4 °C overnight. After being washed three times, the membranes were incubated with secondary antibodies at room temperature for 2 h and visualized using an enhanced chemiluminescence kit (Amersham, Little Chalfont, UK).
Transwell assays
We utilized transwell chambers with 8 μm pores. For the migration assays, 4×10⁴ cells were seeded into the upper chamber with 200 μl of serum-free medium and the lower chamber was filled with medium containing 10% FBS. After incubation for 24 h, cells that did not pass the filter were erased, and migrated cells on the reverse side of the filter were fixed with methanol for 30 min, then stained with 0.01% crystal violet for 30 min. Images were obtained using light microscopy. The invasion assay followed the same protocol, except the upper chamber was coated with Matrigel.
Wound healing assays
Cells were cultured to the appropriate confluence in 6-well plates, then a wound was created using sterile plastic tips. After washing with PBS, cells were cultured for 24 h with serum-free medium. Images were taken using a microscope. An average of five random fields of each wound was measured for quantification.
Dual luciferase reporter assay
Fragments bound to miR-376c-3p in linc01278 and DNM3 3ʹ UTR were separately mutated using the QuikChange site-directed mutagenesis kit (Stratagene, Cedar Creek, TX, USA). The chemically synthesized wild-type and mutant linc01278 or DNM3 3ʹ UTR fragments containing the miR-376c-3p binding site were separately cloned into the psiCHECK2 vector. The psiCHECK2 recombinant plasmid and miR-376c-3p mimic or miR-NC were co-transfected into BCPAP cells using Lipofectamine 2000. 48 h after transfection, firefly and Renilla luciferase activities in cell lysates were determined by the Dual Luciferase Reporting Assay System (Promega Corporation). Relative luciferase activity was normalized with Renilla luciferase activity.
Statistical analysis
Statistical analysis was performed as the mean ± SD using SPSS 22.0 (SPSS, IBM, Beijing, China) and GraphPad Prism 6 (GraphPad, San Diego, CA). The differences between groups were calculated using the Student’s t-test or one-way ANOVA. P<0.05 was considered statistically significant.
Results
Linc01278 demonstrates an abnormally low expression in PTC tissues and is associated with tumor burden of PTC
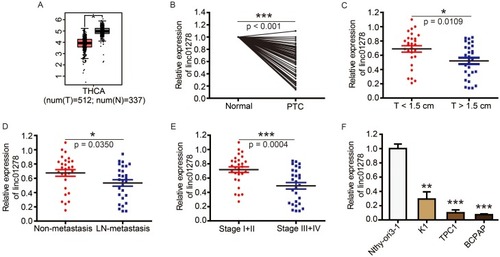
Based on genetic information from 849 clinical samples, GEPIA analysis revealed that linc01278 expression in thyroid carcinoma (THCA) samples was significantly lower than in normal thyroid samples (). In order to investigate the role of linc01278 in PTC, we further measured the expression of linc01278 in 56 pairs of PTC tissues and adjacent normal tissues. The results were consistent with the GEPIA analysis,Citation10 indicating that linc01278 was remarkably down-regulated in PTC tissues compared to the adjacent normal tissues (). In addition, we found that lower linc01278 expression was associated with increased tumor size (, P=0.0109), lymph node metastasis (, P=0.0350) and higher clinical stage (, P=0.0004). We reconfirmed the expression of linc01278 in PTC cell lines and obtained similar results (). Therefore, we hypothesize that low linc01278 expression levels are associated with more malignant phenotypes with increased proliferation and metastatic potential of PTC.
Figure 1 Linc01278 is abnormally low expressed in PTC tissues and is associated with tumor burden of PTC.
Notes: (A) The boxplot of linc01278 expression level. Red and gray boxes represent thyroid carcinoma (THCA) tissue and normal thyroid tissue, respectively. The data came from the GEPIA database. (B) Linc01278 levels in PTC tissues and adjacent normal ovarian tissues (n=56) were evaluated via qRT-PCR. (C) Relative expression of linc01278 in T<1.5 cm group and T≥1.5 cm group. (D) Relative expression of linc01278 in non-metastasis group and lymph node metastasis group. (E) Relative expression of linc01278 in stage I+II group and stage III+IV group. (F) Linc01278 levels in PTC cell lines (BCPAP, K1, and TPC1) and normal human thyroid cell line (Nthy-ori3-1) were determined via qRT-PCR. *P<0.05, **P<0.01, ***P<0.001.
Abbreviation: THCA, thyroid carcinoma.
Linc01278 inhibits cell proliferation of PTC cells by inducing apoptosis
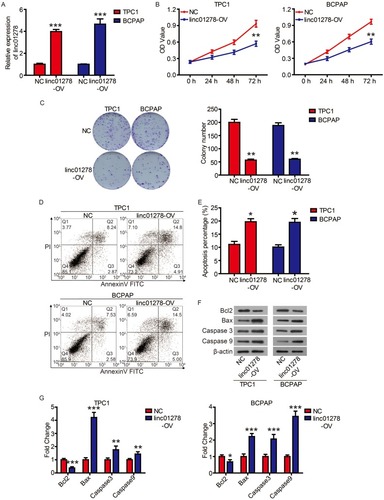
We next examined the roles of linc01278 in the proliferation of PTC cells. Considering the lower levels of linc01278 in TPC1 and BCPAP cells, we designed and performed function-gain assays in both cell lines. The overexpression efficiency in both cell lines was measured and illustrated (). CCK-8 assays showed that overexpression of linc01278 dramatically suppressed proliferation of TPC1 and BCPAP cells at 72 h after transfection compared to NC (P<0.01, ). Colony formation assays demonstrated that overexpression of linc01278 significantly reduced the number of colonies of TPC1 and BCPAP cells (P<0.01, ). These results suggested that linc01278 may regulate proliferation of PTC cells. Furthermore, we found that overexpression of linc01278 increased the rate of apoptosis of TPC1 and BCPAP cells (P<0.05, and ). And, Western blotting analysis revealed increased expression of Bax, cleaved caspase 3 and cleaved caspase 9, alongside decreased expression of Bcl2 in TPC1 and BCPAP cells transfected with pcDNA3.1-lin01278 ( and ). These findings indicated that linc01278 induced apoptosis of PTC cells.
Figure 2 Linc01278 inhibits cell proliferation of PTC cells by inducing apoptosis.
Notes: (A) Linc01278 levels were evaluated via qRT-PCR. (B) The proliferation of TPC1 and BCPAP cells was determined via CCK8 assay. (C) The clonogenicity of TPC1 and BCPAP cells was detected by clony formation assay. The apoptosis of TPC1 and BCPAP cells was detected (D) and quantified (E) by flow cytometry. (F) The expression of apoptosis-related proteins was detected and quantified (G) by Western blot. *P<0.05, **P<0.01, ***P<0.001.
Linc01278 attenuates migration and invasion abilities of PTC cells by regulating the EMT process
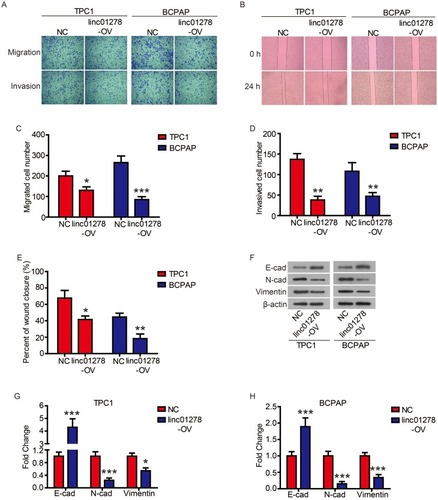
Subsequently, we evaluated the effect of linc01278 overexpression on cell motility by transwell and wound healing assays. As shown in and , the migrated number of TPC1 and BCPAP cells overexpressed by linc01278 was significantly lower than that of NC cells. Similarly, the invasion assay showed that overexpression of linc01278 resulted in fewer cells invading the membrane through Matrigel ( and ). When exogenous linc01278 was forcibly expressed in TPC1 and B-CPAP cells, the wdith of the healing wound was decreased compared to NC cells ( and ). These results suggested that linc01278 attenuated migration and invasion abilities of PTC cells. Furthermore, overexpression of linc01278 caused significant upregulation of epithelial marker E-cadherin expression. In contrast, the expression of mesenchymal markers, N-cadherin and Vimentin, was decreased compared to the NC group (–). These results indicated that linc01278 was capable of mediating the EMT process in PTC cells.
Figure 3 Linc01278 attenuates migration and invasion abilities of PTC cells by regulating EMT process.
Notes: The migration and invasion of TPC1 and BCPAP cells were determined (A) and quantified (C and D) by transwell assay. The migration of TPC1 and BCPAP cells were determined (B) and quantified (E) by wound healing assay. The expression of EMT-related proteins was detected (F) and quantified (G-H) by Western blot. *P<0.05, **P<0.01, ***P<0.001.
Linc01278 functions as a ceRNA by sponging miR-376c-3p
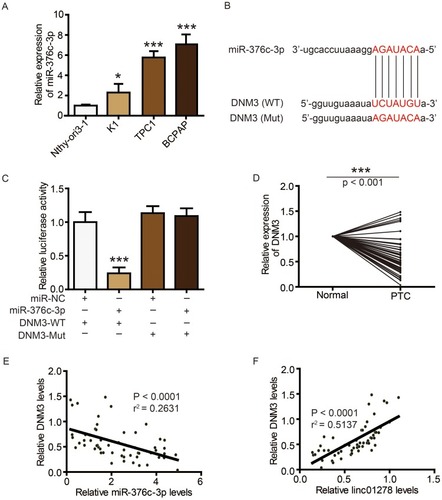
Next, we further analyzed whether linc01278 could function as a ceRNA to regulate specific gene expression. Using StarBase (http://starbase.sysu.edu.cn/), miR-376c-3p was predicted to directly interact with linc01278 (). Luciferase reporter assays performed in BCPAP cells also confirmed the direct interaction of miR-376c-3p with linc01278. The results showed that the luciferase activity of wild-type linc01278 (linc01278-WT) was reduced by transfection with the miR-376c-3p mimc, but the luciferase activity of the mutant linc01278 (linc01278-Mut) did not significantly change (). In addition, significant high expression of miR-376c-3p was also found in PTC tissues and cell lines ( and ). An inverse relationship between linc01278 expression and miR-376c-3p expression in PTC tissues was also found by correlation analysis ().
Figure 4 linc01278 functions as a ceRNA by sponging miR-376c-3p.
Notes: (A) The sequences of miR-376c-3p, wide type of linc01278 (WT) and mutated linc01278 (Mut). (B) The expression levels of luciferase of BCPAP cells transfected with wild-type (WT) or mutated (Mut) linc0127 reporters plus miR-376c-3p mimic or miR-NC were determined. (C) MiR-376c-3p levels in PTC tissues and adjacent normal ovarian tissues (n=56) were evaluated via qRT-PCR. (D) Correlation analysis between linc01278 and miR-376c-3p. ***P<0.001.
Abbreviations: WT, wild-type; Mut, mutated.
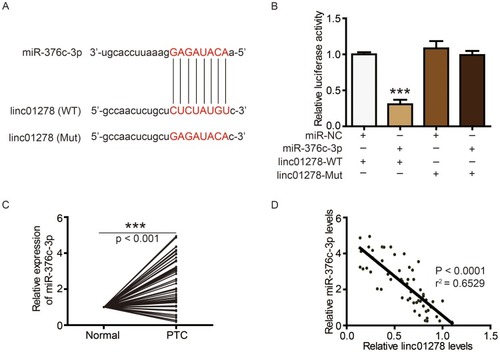
Figure 5 DNM3 is a target of miR-376c-3p in PTC.
Notes: (A) MiR-376c-3p levels in PTC cell lines (BCPAP, K1, and TPC1) and normal human thyroid cell line (Nthy-ori3-1) were determined via qRT-PCR. (B) The sequences of miR-376c-3p, wide type of DNM3 (WT) and mutated DNM3 (Mut). (C) The expression levels of luciferase of BCPAP cells transfected with wild-type (WT) or mutated (Mut) DNM3 reporters plus miR-376c-3p mimic or miR-NC were determined. (D) DNM3 levels in PTC tissues and adjacent normal ovarian tissues (n=56) were evaluated via Western blot. (E) Correlation analysis between DNM3 and miR-376c-3p. (F) Correlation analysis between DNM3 and linc01278. *P<0.05, ***P<0.001.
Abbreviations: WT, wild-type; Mut, mutated.
DNM3 is a target of miR-376c-3p in PTC
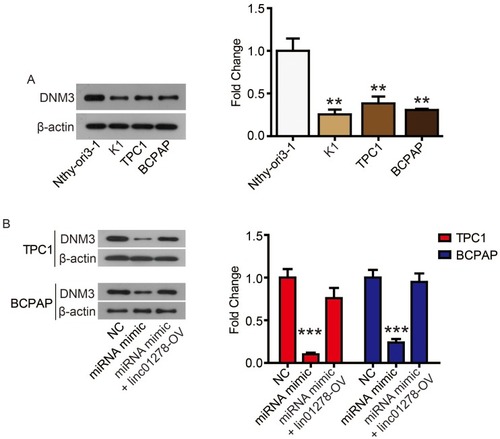
TargetScan (http://www.targetscan.org/vert_72/) also showed a putative binding site between miR-376c-3p and DNM3 (). The miR-376c-3p mimic significantly reduced the luciferase activity of wild-type DNM3 (DNM3-WT) (), and relatively low expression of DNM3 was measured in PTC tissues and cell lines ( and ). Correlation analysis showed a negative correlation between DNM3 expression and miR-376c-3p expression, but a positive correlation with linc01278 expression ( and ). In addition, miR-376c-3p mimic significantly reduced the protein expression of DNM3, but the results were reversed by co-transfection of pcDNA-linc01278 (). These results demonstrated that linc01278 positively regulated DNM3 expression by sponging miR-376c-3p in PTC.
Figure 6 DNM3 is abnormally low expressed in PTC cell lines.
Notes: (A) DNM3 levels in PTC cell lines (K1, BCPAP, and TPC1) and normal human thyroid cell line (Nthy-ori3-1) were determined via Western blot. (B) DNM3 levels in TPC1 and BCPAP cells were determined via Western blot. **P<0.01, ***P<0.001.
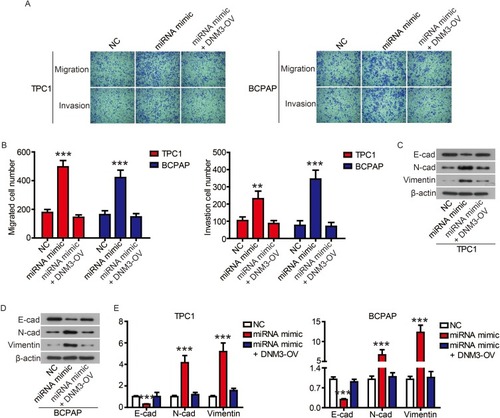
The enhancement of miR-376c-3p on PTC cellular processes was attenuated by DNM3
Finally, we performed complementation experiments to determine the role of miR-376c-3p and DNM3 in PTC progression. Transfection of the miR-376c-3p mimic significantly reduced protein expression of DNM3, whereas transfection of DNM3 plasmid neutralized this effect (). CCK-8 assays and colony formation assays showed that the miR-376c-3p mimic significantly promoted proliferation of TPC1 and BCPAP cells, but overexpression of DNM3 attenuated this effect ( and ). In addition, the miR-376c-3p mimic significantly inhibited apoptosis of TPC1 and BCPAP cells and regulated the expression of apoptosis-related proteins (). This effect was also attenuated by overexpression of DNM3 (). Furthermore, results of transwell assay revealed that DNM3 overexpression abolished the promotion of cell migration and invasion induced by the miR-376c-3p mimic ( and ). Western blot analysis revealed that the promotion of EMT progression by the miR-376c-3p mimic was reversed by DNM3 overexpression (–).
Figure 7 The promotion of miR-376c-3p on cell proliferation was attenuated by DNM3.
Notes: (A) DNM3 levels in TPC1 and BCPAP cells were determined via Western blot. (B) The proliferation of TPC1 and BCPAP cells was determined via CCK8 assay. (C) The clonogenicity of TPC1 and BCPAP cells was detected by clony formation assay. *P<0.05; **P<0.01.
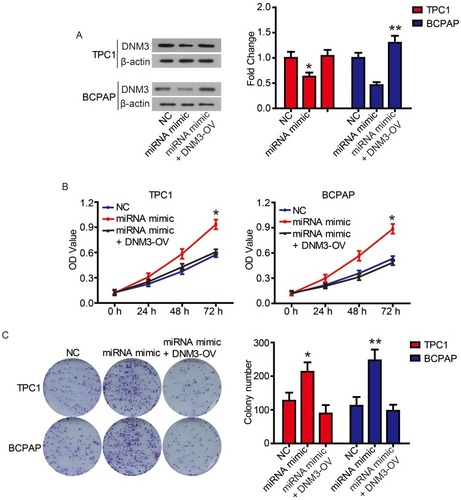
Figure 8 The inhibition of miR-376c-3p on apoptosis was attenuated by DNM3.
Notes: (A and B) The apoptosis of TPC1 and BCPAP cells was detected by flow cytometry. (C and D) The expression of apoptosis-related proteins was detected by Western blot. **P<0.01, ***P<0.001.
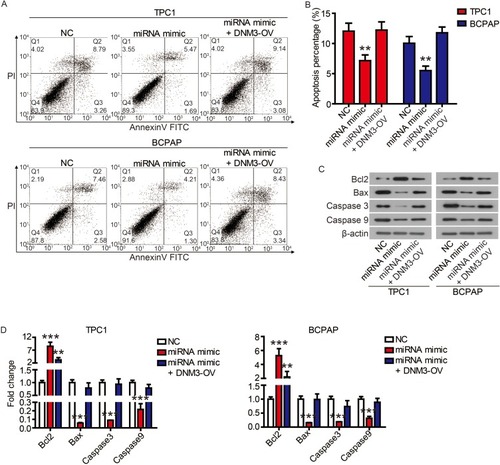
Figure 9 The promotion of miR-376c-3p on on cell migration and invasion was attenuated by DNM3.
Notes: The migration and invasion of TPC1 and BCPAP cells were determined (A) and quantified (B) by transwell assay. (C-E) The expression of EMT-related proteins was detected by Western blot. **P<0.01, ***P<0.001.
Discussion
Many studies have shown that lncRNAs have a wide range of biological activities, particularly in cell growth, differentiation and tumorigenicity.Citation11 LncRNAs are naturally expressed in different cell types and can play an important role as either oncogenes or tumor suppressors, depending on the cellular context. Increases or decreases in lncRNA expression can result in various types of cancer, such as TC. In this study, we first discovered the expression pattern of linc01278 in PTC and its roles in the development of PTC. Linc01278 demonstrated an abnormally low expression in PTC tissues and cell lines and was associated with the tumor burden of PTC. In addition, linc01278 inhibited the proliferation of PTC cells by inducing apoptosis, and attenuated the migration and invasion abilities of PTC cells by regulating the EMT process. These results indicated that linc01278 had potential as a therapeutic target for PTC.
The main challenges in the diagnosis and treatment of PTC are to identify patients with a high risk of radioactive iodine-refractory disease and to prevent over-treatment.Citation11 As a potential biomarker, lncRNA has great significance in understanding the process of PTC occurrence and development and improving the success rate of early diagnosis and treatment. Several lncRNAs (MALAT1, H19, BANCR, HOTAIR) have been identified as contributing factors to PTC development and can be used as novel biomarkers.Citation12–Citation15
In this study, we also found that linc01278 sponged miR-376c-3p to positively regulate DNM3 expression, and ultimately affected the biological function of PTC cells. MiR-376c-3p has recently been identified as a tumor-associated miRNA, which is highly expressed in hepatocellular carcinoma (HCC) tissues and cell lines,Citation16 but is down-regulated in oral cancer,Citation17 head and neck squamous cell carcinoma (HNSCC),Citation18 relapsed breast cancerCitation19 and relapsed neuroblastoma.Citation20 Expression changes of miR-376c-3p affect cell biological behaviors such as proliferation, migration and invasion, and apoptosis of HCC,Citation16 gastric cancerCitation21 and oral squamous cell carcinoma cells (OSCC).Citation22 In the current study, miR-376c-3p was found to be significantly up-regulated in PTC tissues and cell lines, and its expression was negatively correlated with linc01278 expression. miR-376c-3p promoted cell proliferation, migration and invasion of PTC cells, and inhibited cell apoptosis. These results indicate that miR-376c-3p is a momentous tumor-associated miRNA, and its role in tumorsrequires further exploration.
Currently, known target proteins of miR-376c-3p include ARID2,Citation16 HOXB7Citation22 and RUNX2.Citation23 In the current study, we found a novel target protein of miR-376c-3p, DNM3. Dual luciferase reporter experiments demonstrated the direct interaction between miR-376c-3p and DNM3. Overexpression of DNM3 abolished the effect of the miR-376c-3p mimic on cell proliferation, migration and invasion, apoptosis of PTC cells. In addition, DNM3 demonstrated significantly low expression in PTC tissues and cell lines. Its expression was negatively correlated with miR-376c-3p expression, but was positively correlated with linc01278 expression. DNM3 is highly methylated in cancer tissues, and its expression is also downregulated in HCC. Therefore, we believe DNM3 has potential as a tumor suppressor against HCC.Citation24–Citation26 Additionally, DNM3 seems to be involved in the development of glioma,Citation27,Citation28 and there are a few studies regarding the role of DNM3 in other types of tumors. Our results indicated that DNM3 also functions as a tumor suppressor gene in PTC, which has a similar expression pattern to HCC.
Conclusion
In summary, we determined the expression patterns and roles of linc01278, miR-376c-3p, and DNM3 in PTC. These results help to better understand the pathogenesis and development of PTC and provide insight to develop better diagnosis and treatment strategies.
Ethical approval
This study was approved by the Ethical Committee for Sun Yat-Sen Memorial Hospital.
Author contributions
All authors contributed to data analysis, drafting and revising the article, gave final approval of the version to be published, and agree to be accountable for all aspects of the work.
Disclosure
The authors report no conflicts of interest in this work.
References
- Chen W, Zheng R, Baade PD, et al. Cancer statistics in China, 2015. CA Cancer J Clin. 2016;66(2):115–132. doi:10.3322/caac.2133826808342
- Liu C, Chen T, Zeng W, et al. Reevaluating the prognostic significance of male gender for papillary thyroid carcinoma and microcarcinoma: a SEER database analysis. Sci Rep. 2017;7(1):11412. doi:10.1038/s41598-017-11788-828900207
- Brito JP, Hay ID, Morris JC. Low risk papillary thyroid cancer. BMJ. 2014;348:g3045. doi:10.1136/bmj.g304524935445
- Lv T, Zhu C, Di Z. Risk factors stratifying malignancy of nodules in contralateral thyroid lobe in patients with pre-operative ultrasound indicated unilateral papillary thyroid carcinoma: a retrospective analysis from single centre. Clin Endocrinol (Oxf). 2018;88(2):279–284. doi:10.1111/cen.1350629083503
- Sun T. Long noncoding RNAs act as regulators of autophagy in cancer. Pharmacol Res. 2018;129:151–155. doi:10.1016/j.phrs.2017.11.00929133213
- Schmitt A, Chang H. Long noncoding RNAs in cancer pathways. Cancer Cell. 2016;29(4):452–463. doi:10.1016/j.ccell.2016.03.01027070700
- Lee H, Park JE, Nam JM. Bio-barcode gel assay for microRNA. Nat Commun. 2014;5:3367. doi:10.1038/ncomms597224569571
- Tay Y, Rinn J, Pandolfi PP. The multilayered complexity of ceRNA crosstalk and competition. Nature. 2014;505(7483):344–352. doi:10.1038/nature1298624429633
- Song B, Li R, Zuo Z, et al. LncRNA ENST00000539653 acts as an oncogenic factor via MAPK signalling in papillary thyroid cancer. BMC Cancer. 2019;19(1):297. doi:10.1186/s12885-019-5699-930940124
- Tang Z, Li C, Kang B, Gao G, Li C, Zhang Z. GEPIA: a web server for cancer and normal gene expression profiling and interactive analyses. Nucleic Acids Res. 2017;45(W1):W98–W102. doi:10.1093/nar/gkx24728407145
- Mahmoudian-Sani MR, Jalali A, Jamshidi M, et al. Long non-coding RNAs in thyroid cancer: implications for pathogenesis, diagnosis, and therapy. Oncol Res Treat. 2019;42(3):136–142. doi:10.1159/00049515130799425
- Goedert L, Plaça JR, Fuziwara CS, et al. Identification of long noncoding RNAs deregulated in papillary thyroid cancer and correlated with BRAF V600E mutation by bioinformatics integrative analysis. Sci Rep. 2017;7(1):1662. doi:10.1038/s41598-017-01957-028490781
- Liao T, Qu N, Shi RL, et al. BRAF-activated LncRNA functions as a tumor suppressor in papillary thyroid cancer. Oncotarget. 2016;8(1):238–247.
- Wang XM, Liu Y, Fan YX, et al. LncRNA PTCSC3 affects drug resistance of anaplastic thyroid cancer through STAT3/INO80 pathway. Cancer Biol Ther. 2018;19(4):1–18. doi:10.1080/15384047.2018.144961029281559
- Takashi N, Mitchell JA, Sanz LA, et al. The air noncoding RNA epigenetically silences transcription by targeting G9a to chromatin. Science. 2008;322(5908):1717–1720. doi:10.1126/science.116380218988810
- Wang Y, Chang W, Chang W, et al. MicroRNA-376c-3p facilitates human hepatocellular carcinoma progression via repressing AT-rich interaction domain 2. J Cancer. 2018;9(22):4187–4196. doi:10.7150/jca.2793930519319
- Zeljic K, Jovanovic I, Jovanovic J, Magic Z, Stankovic A, Supic G. MicroRNA meta-signature of oral cancer: evidence from a meta-analysis. Ups J Med Sci. 2018;123(1):43–49. doi:10.1080/03009734.2018.143955129482431
- Nunez Lopez YO, Victoria B, Golusinski P, Golusinski W, Masternak MM. Characteristic miRNA expression signature and random forest survival analysis identify potential cancer-driving miRNAs in a broad range of head and neck squamous cell carcinoma subtypes. Rep Pract Oncol Radiother. 2018;23(1):6–20. doi:10.1016/j.rpor.2017.10.00329187807
- Huo D, Clayton WM, Yoshimatsu TF, Chen J, Olopade OI. Identification of a circulating microRNA signature to distinguish recurrence in breast cancer patients. Oncotarget. 2016;7(34):55231–55248. doi:10.18632/oncotarget.1048527409424
- Bhavsar SP, Lokke C, Flaegstad T, Einvik C. Hsa-miR-376c-3p targets Cyclin D1 and induces G1-cell cycle arrest in neuroblastoma cells. Oncol Lett. 2018;16(5):6786–6794. doi:10.3892/ol.2018.943130405823
- Tu L, Zhao E, Zhao W, et al. hsa-miR-376c-3p regulates gastric tumor growth both in vitro and in vivo. Biomed Res Int. 2016;2016:9604257. doi:10.1155/2016/960425727965982
- Wang K, Jin J, Ma T, Zhai H. MiR-376c-3p regulates the proliferation, invasion, migration, cell cycle and apoptosis of human oral squamous cancer cells by suppressing HOXB7. Biomed Pharmacother. 2017;91:517–525. doi:10.1016/j.biopha.2017.04.05028482289
- Chang WM, Lin YF, Su CY, et al. Dysregulation of RUNX2/Activin-A axis upon miR-376c downregulation promotes lymph node metastasis in head and neck squamous cell carcinoma. Cancer Res. 2016;76(24):7140–7150. doi:10.1158/0008-5472.CAN-16-118827760788
- Gu C, Yao J, Sun P. Dynamin 3 suppresses growth and induces apoptosis of hepatocellular carcinoma cells by activating inducible nitric oxide synthase production. Oncol Lett. 2017;13(6):4776–4784. doi:10.3892/ol.2017.605728599479
- Inokawa Y, Nomoto S, Hishida M, et al. Dynamin 3: a new candidate tumor suppressor gene in hepatocellular carcinoma detected by triple combination array analysis. Onco Targets Ther. 2013;6:1417–1424. doi:10.2147/OTT.S5191324143113
- Zhang Z, Chen C, Guo W, Zheng S, Sun Z, Geng X. DNM3 attenuates hepatocellular carcinoma growth by activating P53. Med Sci Monit. 2016;22:197–205. doi:10.12659/msm.89654526784388
- Yang JK, Yang JP, Tong J, et al. Exosomal miR-221 targets DNM3 to induce tumor progression and temozolomide resistance in glioma. J Neurooncol. 2017;131(2):255–265. doi:10.1007/s11060-016-2308-527837435
- Yang JK, Song J, Huo HR, et al. DNM3, p65 and p53 from exosomes represent potential clinical diagnosis markers for glioblastoma multiforme. Ther Adv Med Oncol. 2017;9(12):741–754. doi:10.1177/175883401773747129449895