
Abstract
Introduction
LncRNA mortal obligate RNA transcript (MORT) is downregulated in different types of cancer, indicating its involvement in cancer biology.
Methods
In this study, MORT and miRNA-16 were both downregulated in plasma of mantle cell lymphoma (MCL) patients than that in the controls. The low levels of MORT and miRNA-16 were correlated with poor survival of MCL patients. The expression of MORT and miRNA-16 was positively correlated only in MCL patients.
Results
Overexpression of MORT and miRNA-16 suppressed cell proliferation but promoted cancer cell apoptosis, while miRNA-16 inhibitor reduced the effects of MORT overexpression. Overexpression of MORT led to upregulated expression of miRNA-16, while overexpression of miRNA-16 had no effect on the expression of MORT.
Conclusion
Therefore, MORT may inhibit cancer cell proliferation and promote apoptosis in mantle cell lymphoma by upregulating miRNA-16.
Introduction
As a subtype of non-Hodgkin lymphoma, mantle cell lymphoma (MCL) is characterized by the proliferation of CD5-expressing mature B lymphocytes.Citation1,Citation2 With the development of anti-cancer therapies, the overall survival rate of MCL patients has been significantly increased.Citation3 However, although most patients respond well to the initial treatment, recurrence and the development of radio- or chemo-resistance is common, resulting in failure of the treatment.Citation2 In addition, the relatively low early diagnosis rate of MCL is another major challenge of survival.Citation4,Citation5 More than 70% of MCL patients were diagnosed at stage IV, which is the end stage of this disease.Citation4,Citation5 At present, early diagnosis is still the key to the treatment of MCL.
Long non-coding RNAs (lncRNAs) are key regulators involved in human diseases.Citation6 It has been well established that the development of MCL is accompanied by changes in expression patterns of a large set of lncRNAs.Citation7 A recent study working on the gene expression data collected by The Cancer Genome Atlas (TCGA) revealed that MORT was downregulated in 16 types of cancer.Citation8 However, the expression pattern of MORT in MCL is unknown. We reported that MORT was also downregulated in MCL and its overexpression inhibited MCL cell proliferation and promoted MCL cell apoptosis possibly by upregulating miRNA-16, which is a well-established tumor suppressor miRNA in different types of cancers.Citation9,Citation10
Materials and Methods
Patients and Cell Lines
A total of 48 patients with MCL (28 males and 20 females, 26 to 67 years old, mean age 45.3 ± 4.7 years old) and 42 healthy volunteers (24 males and 18 females, 29 to 63 years old, mean age 44.1 ± 5.2 years old) were enrolled in this study. These participants were admitted by the First Affiliated Hospital of Chongqing Medical University from May 2013 to March 2018. Inclusion criteria of MCL patients: 1) patients at stage I or II; 2) newly diagnosed cases. Exclusion criteria of MCL patients: 1) patients who were suffering from other diseases; 2) patients who were treated within 3 months before admission. The 48 MCL patients included 18 cases at stage I and 30 cases at stage II. Distributions of age and gender were not significantly different between MCL and the control group. Informed consent was signed by all participants. Blood was extracted from each participant 1 day after admission. Plasma was prepared using conventional method. This study was approved by the ethics committee of the First Affiliated Hospital of Chongqing Medical University. Two human MCL cell lines, JVM-2 and Z-138, were used in this study. Cells of these two cell lines were purchased from ATCC (Manassas, VA, USA). Cells were cultured following the instructions provided by ATCC.
Isolation of B Lymphocytes
Using the same blood samples (both MCL patients and healthy controls) collected, B lymphocytes were isolated using CD19+ magnetic beads and the cells were released using DETACHaBEAD CD19 (Invitrogen). Samples with the purify and/or viability below 95% were selected for use.
Total RNA Extractions and qPCR
To detect the expression of MORT, total RNAs from 105 cells and 0.4 mL plasma were extracted using Ribozol (Sigma-Aldrich, USA). cDNAs were synthesized using qScript MicroRNA cDNA Synthesis Kit (Genbiotech SRL). The qPCR mixtures were prepared using qScript One-Step RT-qPCR Kit (Quantabio, Beverly, MA). To detect the expression of miRNA-16, miRNAs were extracted using mirPremier microRNA Isolation Kit (SNC10, Sigma-Aldrich). Reverse transcription was performed using TaqMan MicroRNA Reverse Transcription Kit (Thermo Fisher Scientific). PCR reaction systems were prepared using mirVana qRT-PCR miRNA Detection Kit (Thermo Fisher Scientific). The qPCR mixtures were prepared following the manufacturer’s instruction. All PCR reactions were performed on the StepOne Real-Time PCR System (Thermo Fisher Scientific). Reaction conditions were: 95°C for 1 min, followed by 40 cycles of 95°C for 20 s and 57.0°C for 35 s. Ct values were calculated using the 2−ΔΔCT method. Expression levels of MORT and Caspase-3 mRNA were normalized to GAPDH endogenous control (18S rRNA was also used as an endogenous control and similar results were obtained). Expression level of miRNA-16 was normalized to U6 endogenous control. Primer sequences used were: 5ʹ-TGCTATCTTAACCATGTTGAA-3ʹ (forward) and 5ʹ-AGCTAGGAGCAGAGGGGCTG-3ʹ (reverse) for MORT; 5ʹ-GCAGCAAACCTCAGGGAAAC-3ʹ (forward) and 5ʹ-TGTCGGCATACTGTTTCAGC-3ʹ (reverse) for Caspase-3; 5ʹ-GTCTCCTCTGACTTCAACAGC-3ʹ (forward) and 5ʹ-ACCACCCTGTTGCTGTAGCC-3ʹ (reverse) for GAPDH. Forward primer of miR-16 was 5ʹ-CTAGCCTGCAGGGATCTAGGA-3ʹ. Reverse primers of U6 and miR-16 were included in the kit.
Cell Transfection
MORT expressing vector (pcRNA3.1) was purchased from Sangon (Shanghai, China). Negative control (NC) miRNA and miR-16 mimic, as well as miRNA-16 inhibitor and inhibitor NC were purchased from Sigma-Aldrich. Lipofectamine 2000 reagent (Invitrogen) was used to transfect 10 nM vector (empty vector as NC group), or 50 nM miRNAs (NC miRNA as NC group) or 50 nM miRNA inhibitor (inhibitor NC as NC group) into 106 cells. Untransfected cells were used as control (C). Cells harvested at 24 h post-transfection were used to perform subsequent experiments.
Cell Apoptosis Assay
Cells were harvested and cell pellets containing 5 ×10⁴ cells were resuspended in 1 mL non-serum medium. Cells were then cultivated in 6-well plates (2 mL per well). Annexin V-FITC (Dojindo, Japan) and propidium iodide staining were performed after 48 h of cultivation. Apoptotic cells were detected by flow cytometry using BD Biosciences 2 Laser 4 Color FacsCalibur w/HTS.
CCK-8 Assay for Cell Proliferation
Cells were harvested and cell pellets containing 5 ×10⁴ cells were resuspended in 1 mL culture medium containing 10% FBS. Cells were cultivated in 96-well plates (0.1 mL per well). CCK-8 solution (10 µL) was added 4 h before the end of cell culture. OD values at 450 nm wavelength were measured to reflect cell proliferation.
Statistical Analysis
Values of mean ± standard deviation were calculated using the data from 3 replicate experiments. All statistical analyses were performed using GraphPad Prism 6 software. Unpaired t test was used to explore differences between 2 groups. One-way ANOVA and Tukey’s test were used to explore difference among multiple groups. Diagnostic values of MORT and miRNA-16 for MCL were analyzed by ROC curve. In ROC curve, true positive cases were MCL patients and true negative cases were healthy controls. Pearson’s correlation coefficient was used to analyze the correlations between plasma levels of MORT and miRNA-16. p < 0.05 was statistically significant.
Results
MORT and miRNA-16 Were Both Downregulated in Early Stage MCL Patients
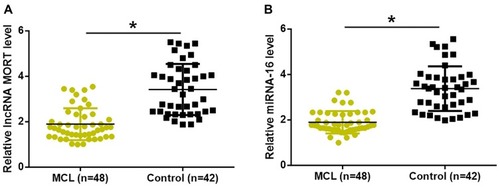
Expression levels of MORT and miRNA-16 in plasma samples of 48 patients with early-stage MCL and 42 healthy volunteers were detected by qPCR. As shown in , compared to the controls, expression levels of MORT () and miRNA-16 () were significantly lower in patients with early-stage MCL (p < 0.05).
Figure 1 MORT and miRNA-16 were both downregulated in early-stage MCL patients. Expression levels of MORT (A) and miRNA-16 (B) were significantly lower in patients with early-stage MCL than that in healthy controls (*p < 0.05).
Dysregulated Plasma MORT and miRNA-16 Indicated an Application Potential in the Early Diagnosis of MCL
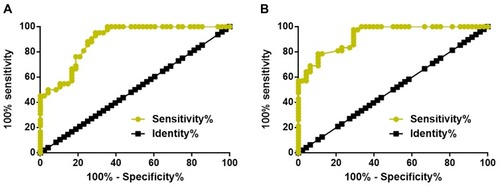
ROC curve analysis was performed and as shown in , the area under the curve (AUC) was 0.8916 (standard error: 0.03241; 95% confidence interval: 0.8281–0.9552; p < 0.0001). For plasma miRNA-16 expression, AUC was 0.9256 (standard error: 0.02522; 95% confidence interval: 0.8762–0.9750; p < 0.0001).
Figure 2 Dysregulated plasma MORT and miRNA-16 indicated an application potential in the early diagnosis of MCL. ROC curve analysis showed that dysregulated plasma MORT (A) and miRNA-16 (B) distinguished early-stage MCL patients from healthy controls.
Expression of MORT and miRNA-16 Were Positively Correlated in MCL Patients
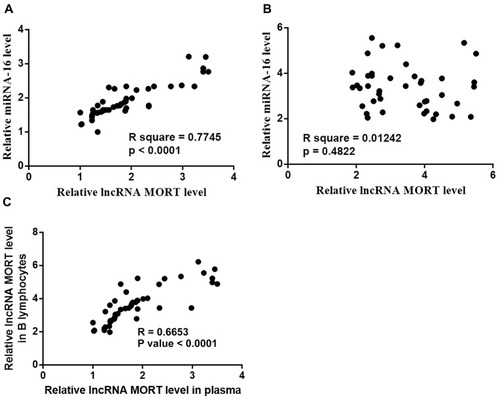
Pearson’s correlation coefficient results showed a positive and significant correlation between the expression of MORT and miRNA-16 in MCL patients (). In contrast, expression levels of MORT and miRNA-16 were not significantly correlated in healthy controls (). Besides, the correlation between expression levels of MORT in plasma and B lymphocytes was analyzed as well. It was observed that plasma levels of MORT expression were significantly correlated with its expression levels in B lymphocytes ().
Figure 3 Expression of MORT and miRNA-16 was positively correlated only in MCL patients. Pearson’s correlation coefficient revealed a positive and significant correlation between plasma levels of MORT and miRNA-16 in MCL patients (A) but not in healthy controls (B). Plasma levels of MORT were significantly correlated with its expression levels in B lymphocytes (C).
MORT Is a Potential Positive Regulator Upstream of miRNA-16 in MCL
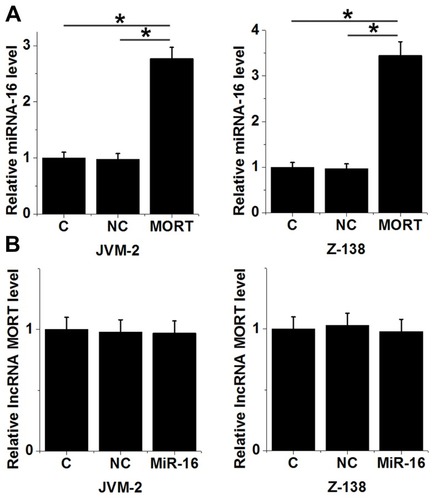
After transfection, overexpression rates of both MORT and miRNA-16 reached to 180−220% at 24 h (data not shown). Compared with the control (C) and negative control (NC) cells, increased expression levels of miRNA-16 were observed in both JVM-2 and Z-138 cell lines (, p < 0.05). However, no significant changes in expression levels of MORT were observed in these two cell lines after overexpression of miRNA-16 (, p > 0.05).
Figure 4 MORT is a potential positive regulator upstream of miRNA-16 in MCL. Overexpression of MORT led to increased expression levels of miRNA-16 in both JVM-2 and Z-138 cell lines (A). Overexpression of miRNA-16 showed no significant effects on MORT expression in both JVM-2 and Z-138 cell lines (B) (*p > 0.05).
MORT Promoted Cancer Cell Apoptosis and Inhibited Cancer Cell Proliferation Through miRNA-16
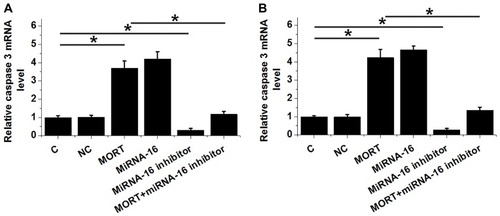
Cell apoptosis assay and cell proliferation assay revealed that compared with the control (C) and negative control (NC) cells, overexpression of MORT and miRNA-16 significantly promoted cancer cell apoptosis () and inhibited cancer cell proliferation () (p < 0.05). In contrast, treatment with miRNA-16 inhibitor significantly inhibited cancer cell apoptosis () and promoted cancer cell proliferation () (p < 0.05). In addition, treatment with miRNA-16 inhibitor reduced the effects of overexpressing MORT on cancer cell apoptosis () and proliferation () (p < 0.05). It was also observed that overexpression of MORT and miRNA-16 significantly promoted the expression of caspase 3 in both JVM-2 () and Z-138 () cell lines (p < 0.05). MiRNA-16 inhibitor played an opposite role and reduced the effects of overexpressing MORT (p < 0.05).
Figure 5 MORT promoted cancer cell apoptosis and inhibited cancer cell proliferation possibly through miRNA-16. Overexpression of MORT and miRNA-16 significantly promoted cancer cell apoptosis (A) and inhibited cancer cell proliferation (B). Treatment with miRNA-16 inhibitor played an opposite role. Treatment with miRNA-16 inhibitor significantly attenuated the effects of overexpressing MORT on cancer cell apoptosis and proliferation (*p < 0.05).
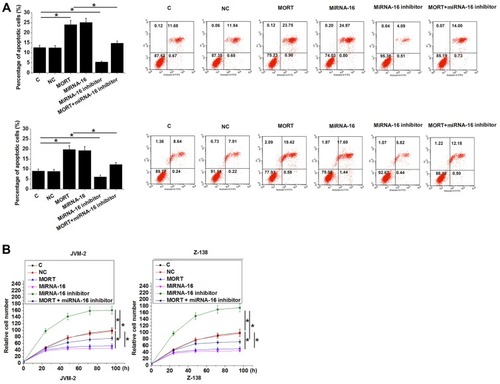
Figure 6 MORT promoted the expression of Caspase-3 through miRNA-16. The effects of transfections on the expression of Caspase-3 in JVM-2 (A) and Z-138 (B) cell lines analyzed by qPCR. Experiments were performed in triplicate manner and mean values were presented. (*p < 0.05).
Discussion
The key finding of the present study is that MORT was downregulated in MCL and the downregulation of MORT may assist the early diagnosis of MCL. We also provided experimental evidences that overexpression of MORT may provide novel insight into clinical treatment of MCL.
MiRNA-16 is a well-established tumor suppressor miRNA in different types of human malignancy. Downregulation of miRNA-16 has been observed in oral squamous carcinoma and multiple myeloma.Citation9,Citation10 Overexpression of miRNA-16 inhibited tumor growth in oral squamous carcinoma by targeting Wnt/β-catenin signaling pathway. In addition to the direct roles in cancer development and progression, miRNA-16 also participates in the development of drug resistance of cancer treatment.Citation11 Our study reported the downregulation of miRNA-16 in MCL. In effect, downregulation of miRNA-16 effectively distinguished early-stage MCL patients from healthy controls. The in vitro cell experiments also showed that miRNA-16 could inhibit tumor cell proliferation and promote cell apoptosis in MCL. Therefore, miRNA-16 functions as a tumor suppressor miRNA in MCL.
The development of MCL also involves the regulations of lncRNAs.Citation7 MCL-related lncRNAs regulate cancer cell behaviors through the interactions with multiple pathways.Citation12 Our study is the first to report the downregulation of MORT in MCL. The in vitro cell experiments also demonstrated that MORT acts as a tumor suppressor in MCL by regulating cancer cell proliferation and apoptosis. Our data suggest that overexpression of MORT could improve the conditions of MCL. However, more clinical trials and in vivo experiments are needed to further confirm this conclusion.
The crosstalk between miRNAs and lncRNAs in cancer biology has been extensively reported in previous studies.Citation13–Citation15 Our study first revealed the interactions between MORT and miRNA-16 in MCL. Overexpression and inhibition experiments using MCL cell lines also showed that MORT was likely a positive regulator upstream of miRNA-16. Our study provided new insights into the pathogenesis of MCL.
It is worth noting that the interaction between MORT and miRNA-16 is likely indirect due to the lack of obvious correlation between these two factors in healthy people. Therefore, the future direction of our study is to identify the pathological factors that mediate the interactions between MORT and miRNA-16.
In conclusion, MORT is downregulated in MCL and overexpression of MORT could inhibit MCL cell proliferation and promote MCL cell apoptosis possibly by upregulating miRNA-16.
Ethics Approval
The research has been carried out in accordance with the World Medical Association Declaration of Helsinki, and that all subjects provided written informed consent.
Author Contributions
All authors contributed to data analysis, drafting or revising the article, gave final approval of the version to be published, and agree to be accountable for all aspects of the work.
Disclosure
The authors declare that they have no competing interests.
References
- Thieblemont C. Mantle Cell Lymphoma. Tropical Hemato-Oncology. Cham: Springer; 2015:233–243.
- Cheah CY, Seymour JF, Wang ML. Mantle cell lymphoma. J Clin Oncol. 2016;34(11):1256–1269. doi:10.1200/JCO.2015.63.590426755518
- Eskelund CW, Kolstad A, Jerkeman M, et al. 15‐year follow‐up of the Second Nordic Mantle Cell Lymphoma trial (MCL 2): prolonged remissions without survival plateau. Br J Haematol. 2016;175(3):410–418. doi:10.1111/bjh.1424127378674
- Dabaja BS, Zelenetz AD, Ng N, et al. Early-stage mantle cell lymphoma: a retrospective analysis from the International Lymphoma Radiation Oncology Group (ILROG). Ann Oncol. 2017;28(9):2185–2190. doi:10.1093/annonc/mdx33428911068
- Vose JM. Mantle cell lymphoma: 2015 update on diagnosis, risk‐stratification, and clinical management. Am J Hematol. 2015;90(8):739–745. doi:10.1002/ajh.v90.826103436
- Shi X, Sun M, Liu H, et al. Long non-coding RNAs: a new frontier in the study of human diseases. Cancer Lett. 2013;339(2):159–166. doi:10.1016/j.canlet.2013.06.01323791884
- Hu G, S K G, T P T, et al. Long non-coding RNA profile in mantle cell lymphoma identifies a functional lncRNA ROR1-AS1 associated with EZH2/PRC2 complex. Oncotarget. 2017;8(46):80223–80234. doi:10.18632/oncotarget.1795629113297
- Vrba L, Futscher BW. Epigenetic silencing of MORT in 16 TCGA cancer types. F1000Res. 2018;7:211. doi:10.12688/f1000research.13944.129707199
- Liu L, Jiang H, Zhao J, et al. MiRNA-16 inhibited oral squamous carcinoma tumor growth in vitro and in vivo via suppressing Wnt/β-catenin signaling pathway. Onco Targets Ther. 2018;11:5111–5119. doi:10.2147/OTT30197522
- Zhang L, Zhou L, Shi M, et al. Downregulation of miRNA‑15a and miRNA‑16 promote tumor proliferation in multiple myeloma by increasing CABIN1 expression. Oncol Lett. 2018;15(1):1287–1296. doi:10.3892/ol.2017.742429399181
- Xia L, Zhang D, Du R, et al. miR‐15b and miR‐16 modulate multidrug resistance by targeting BCL2 in human gastric cancer cells. Int J Cancer. 2008;123(2):372–379. doi:10.1002/ijc.2350118449891
- Hu G, Nair A, Price-Troska T, et al. Mantle cell lymphoma associated long non-coding RNAs regulate polycomb repressive complex-2. Blood. 2014;124(21):140. doi:10.1182/blood.V124.21.140.140
- Braconi C, Kogure T, Valeri N, et al. microRNA-29 can regulate expression of the long non-coding RNA gene MEG3 in hepatocellular cancer. Oncogene. 2011;30(47):4750–4756. doi:10.1038/onc.2011.19321625215
- Liu X, Sun M, Nie F, et al. Lnc RNA HOTAIR functions as a competing endogenous RNA to regulate HER2 expression by sponging miR-331-3p in gastric cancer. Mol Cancer. 2014;13(1):92. doi:10.1186/1476-4598-13-9224775712
- Liz J, Esteller M. lncRNAs and microRNAs with a role in cancer development. Biochim Biophys Acta Gene Regul Mech. 2016;1859(1):169–176. doi:10.1016/j.bbagrm.2015.06.015