
Abstract
Background
Tremendous efforts have been made to explore biomarkers for classifying and grading glioma. However, the majority of the current understanding is based on public databases that might not accurately reflect the Asian population. Here, we investigated the genetic landscape of Chinese glioma patients using a validated multigene next-generation sequencing (NGS) panel to provide a strong rationale for the future classification and prognosis of glioma in this population.
Methods
We analyzed 83 samples, consisting of 71 initial treatments and 12 recurrent surgical tumors, from 81 Chinese patients with gliomas by performing multigene NGS with an Acornmed panel targeting 808 cancer-related hotspot genes, including genes related to glioma (hotspots, selected exons or complete coding sequences) and full-length SNPs located on chromosomes 1 and 19.
Results
A total of 76 (91.57%) glioma samples had at least one somatic mutation. The most commonly mutated genes were TP53, TERT, IDH1, PTEN, ATRX, and EGFR. Approximately one-third of cases exhibited more than one copy number variation. Of note, this study identified the amplification of genes, such as EGFR and PDGFRA, which were significantly associated with glioblastoma but had not been previously used for clinical classification (P<0.05). Significant differences in genomic profiles between different pathological subtypes and WHO grade were observed. Compared to the MSKCC database primarily comprised of Caucasians, H3F3A mutations and MET amplifications exhibited higher mutation rates, whereas TERT mutations and EGFR and CDKN2A/B copy number variations presented a lower mutation rate in Chinese patients with glioma (P<0.05).
Conclusion
Our multigene NGS in the simultaneous evaluation of multiple relevant markers revealed several novel genetic alterations in Chinese patients with glioma. NGS-based molecular analysis is a reliable and effective method for diagnosing brain tumors, assisting clinicians in evaluating additional potential therapeutic options, such as targeted therapy, for glioma patients in different racial/ethnic groups.
Introduction
Gliomas are the most common tumors in the brain and central nervous system (CNS).Citation1 However, gliomas comprise a diverse collection of entities, each with its own unique clinical and biological characteristics.Citation2 According to the 2016 World Health Organization (WHO) standards, gliomas include grade II–III astrocytoma (A) and oligodendroglioma (O), as well as grade IV glioblastoma (GBM) and diffuse midline glioma (DMG).Citation3 Previous brain tumor classification was primarily based on histopathological characteristics confirmed by hematoxylin and eosin staining (H&E) and immunohistochemistry (IHC). Detection of IDH mutations, 1p/19q codeletion, and H3F3A mutations (midline position) are now recommended according to their histologic diagnosis.Citation4–Citation6 Emerging evidence has shown that inclusion of molecular characterization could improve the prognostic and predictive stratification of CNS tumors.Citation7–Citation9 In fact, many key mutations in the TERT, ATRX, TP53, and EGFR genes found in gliomasCitation10,Citation11 could be used as diagnostic, prognostic, and therapeutic biomarkers. However, these mutation markers have not been included in the latest WHO CNS tumor classification criteria;Citation3 therefore, they are not used in routine clinical analyses of glioma prognosis or classification.Citation12 In addition, malignant gliomas are intrinsic primary CNS tumors, and a recent sequencing analysis reported that these tumors have high intertumoral molecular heterogeneity.Citation13 This causes difficulties in the classification and prognostic determinations with implications for targeted therapies in CNS tumors.Citation14 Therefore, a comprehensive genetic analysis is urgently needed for precise tumor classification, guiding clinicians in treatment decision-making for this disease.
Targeted next-generation sequencing (NGS) is an effective and practical method because it can rapidly analyze a wide variety of molecular abnormalities in the entire genome, with low DNA input and low cost.Citation15 These advantages have made NGS an attractive and efficient molecular platform for the recent classification of gliomas according to the WHO classification.Citation16 However, there are several criteria that should be considered when using targeted NGS analysis. The panel should have enough gene numbers to cover a wide range of targets and their various types of genetic mutations, which may have diagnostic, prognostic, predictive, and therapeutic significance for the targeted tumors. The analysis should also have high reliability in formalin-fixed, paraffin-embedded (FFPE) tissues.Citation15,Citation17
In this study, we used a validated multigene NGS panel to retrospectively analyze the sequencing results of 83 glioma samples. The panel included multiple genetic tests for simultaneously identifying single nucleotide variants (SNVs), small insertions and deletions, copy number variations (CNVs), splice variants, and gene rearrangements. We identified frequent and novel genetic alterations in Chinese gliomas. These genetic alterations could be explored as a new set of predictive biomarkers for stratifying each glioma subtype and could help clinicians improve the clinical management of glioma in Chinese patients.
Materials and Methods
Patient Samples
In this study, a total of 83 samples, including two matched cerebrospinal fluid samples, were obtained from 81 patients recruited by the Department of Neurosurgery, Peking University International Hospital from January 2018 to December 2019. The histological subtypes and grades of all cases were determined by the morphological characteristics of the tumor tissues analyzed by immunohistochemistry (IHC) and the WHO 2016 classification criteria.Citation16 The study was conducted in accordance with the Declaration of Helsinki (as revised in 2013). This study was approved by the Medical Ethics Committee of Peking University International Hospital (YN2020QN03), and written informed consent was obtained from all patients.
Genomic DNA Isolation and Targeted NGS
Next-generation sequencing was performed at AcornMed Biotechnology (Beijing, China) using an Illumina Hiseq4000 platform (Illumina, San Diego, CA, USA). Genomic DNA was isolated from 200μL whole blood with the QIAGEN DNeasy Blood and Tissue Kit (Qiagen, Shanghai, China) according to the manufacturer’s instructions. Then, gDNA was sheared before library construction with a Covaris M220 instrument using the recommended settings for 200-bp fragments. The NGS libraries were constructed using the KAPA Hyper Library Preparation Kit (Kapa Biosystems) following the manufacturer`s protocol. Hybrid selection was performed with a custom SeqCap EZ Choice Library (Roche NimbleGen). The various libraries were hybridized with the 808 gene panel, which including genes related to glioma (hotspots, selected exons, or complete coding sequences) and full-length SNPs located on chromosomes 1 and 19. NimbleGen SeqCap EZ Choice was used according to the manufacturer’s protocol with modifications. Following hybrid selection, the captured DNA fragments were amplified with 12 cycles of PCR using 1× KAPA HiFi Hot Start Ready Mix and 2 µM Illumina backbone oligonucleotides in 50-µL reactions. Library concentration was assessed by Fluorometer (Qubit 4.0) and qPCR (KAPA Biosystems), Fragment length was determined on a 2100 Bioanalyzer using the DNA 1000 Kit (Agilent). Finally, the library was sequenced on one lane using 150 paired-end (2*150 bp) strategies.
To ensure the quality of data, the following criteria were used to filter raw variant results: average effective sequencing depth on target per sample ≥ 300×; allele mutation frequency ≥ 10% for single nucleotide variation and insertion or deletion; all reads were filtered by high mapping quality (≥30) and base quality (≥30); and the mutant reads needed to be supported by positive and negative strands.
NGS Data Analysis
Raw data recognition, analysis, and feedback were implemented by an automatic analysis and monitoring system. Quality control statistics and preprocessing of raw sequence data were performed by using an in-house QC tool. Burrows-Wheeler Aligner software (BWA, version 0.5.9) was used to align reads to the hg19 version of the human reference genome. PCR duplicates were marked using the MarkDuplicates tool in Picard. We used IndelRealigner and BaseRecalibrator on Genome Analysis Toolkit (GATK; version 3.8) for realignment and recalibration of the BWA alignment results, respectively. The final alignment results were used for variant calling after multialign reads were filtered from the alignment results. The HaplotypeCaller on Genome Analysis Toolkit (GATK; version 3.8) was used to identify variant calling of SNPs and INDELs. All variants were annotated using Annovar. This analysis focused on targetable genetic alterations annotated by categories of evidence Level 1–3 and Level R1 in OncoKB (Memorial Sloan Kettering Cancer Center, New York, NY, http://oncokb.org/). Synonymous mutations are detected and maintained in database but not clinically reported.
Copy Number Variation Analysis
CNV analysis was performed using CONTRA (version 2.1.0),Citation18 which indicated CNV gain or loss for genes within the panel coverage. The software computes regions per read and calculates the likelihood possibility based on dispersion measurements and coverage ratios. The hidden Markov model was then used to calculate a CNV classification. The ratios for each region given were 3.5 for copy number gain and 0.5 for copy number loss. LOHs were detected using Control-FREEC (version 11.5)Citation19 based on the pileup files and the known human SNP information (dbSNP142 from UCSC). The 1p/19q codeletion status was predicted using CollectReadCounts, CollectAllelicCounts, DenoiseReadCounts, and ModelSegments of GATK4. We defined ratio thresholds of less than 0.9 as deletions.
Methylguanine-DNA Methyltransferase (MGMT) Methylation Detection
MGMT promoter methylation status was determined by methylation-specific PCR (MSP). In total, 2 μg of DNA was subjected to bisulfite treatment using the EpiTect Bisulfite kit (Qiagen, Cat. 59104). DNA was cleaned following the manufacturer’s instructions and quantified. In all, 30 ng of DNA per sample was PCR-amplified with Platinum SuperFi DNA polymerase (Invitrogen, Cat. 12351–010) and specific primers to detect methylated and unmethylated MGMT promoters. The PCR amplification protocol was as follows: 94°C for 1 min, denaturation at 94°C for 30 s, annealing at 60°C for 30 s, and extension at 70°C for 30 s for 35 cycles, followed by a 7-min final extension.
Statistical Analysis
Statistical analysis was performed using GraphPad Prism (Version 7.01, La Jolla, CA, USA). An unpaired t-test was used to assess differences between continuous variables. Fisher’s exact test or χ2 test was used to analyze clinical features and genetic features between different groups. Spearman’s rank correlation coefficient was used to assess the correlation between variables. P<0.05 was considered to indicate statistical significance.
Results
Patient Characteristics
A total of 83 glioma samples from 81 patients were collected in this study, two of which were matched cerebrospinal fluid samples, including 71 initial treatment and 12 recurrent surgical tumors. Median patient age was 46 years (5–75 years). Fifty-nine patients were males (72.84%), and 22 were females (27.16%). The analysis included 56 glioma samples with high-grade glioma (HGG): 32 cases of GBM (38.55%), 8 cases of DMG (9.64%), 10 cases of anaplastic astrocytoma (AA) (12.05%), and 6 cases of anaplastic oligodendroglioma (AO) (7.23%). Twenty-seven glioma samples were low-grade glioma (LGG): 10 cases of A (12.05%), 11 cases of O (13.25%), 5 cases of pilocytic astrocytoma (PA) (6.02%), and one other case (1.20%). Clinical characteristics of the samples are summarized in .
Table 1 Clinical Characteristics of 81 Patients with Glioma
Comparing the Genomic Profile of the Chinese Cohort to the MSKCC Database
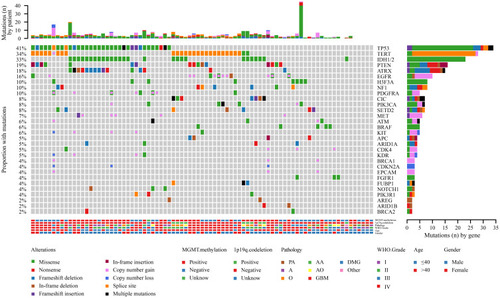
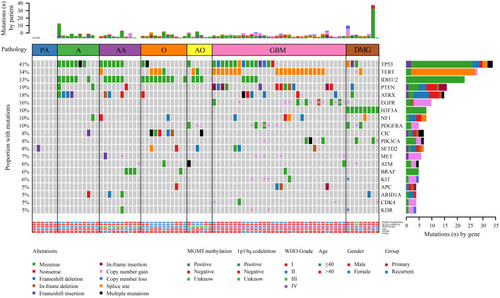
In this study, genomic analysis was performed using targeted sequencing based on hybrid capture. Of the 83 samples in our cohort, 76 (91.57%) had at least one somatic mutation or CNV, and the median number of mutations per patient was 4 (range 0–45). A total of 401 nonsynonymous somatic mutations were identified in 148 genes. Similar to previous reports,Citation20 the most frequently mutated genes in our cohort of gliomas included TP53, TERT, IDH1/2, PTEN, ATRX, and EGFR (). Notably, all IDH1 mutations replaced the arginine residue on codon 132, all of which were R132H (25/25) (). The frequency of H3F3A gene mutations in this study was relatively high (9.64%) (). MGMT methylation was positive in 51.81% (43/83), and 1p19q codeletion was positive in 12.05% (10/83) (). MGMT methylation was found in almost all patients with IDH1 mutations (P<0.0001) (). Of the 83 samples, 7 simultaneously had IDH mutations, MGMT methylation, and 1p/19q codeletion (). Regarding CNVs, EGFR, PDGFRA, MET, KIT, CDK4 amplification, and CDKN2A deletion were common events (). In addition, there was a case of YAP1-PARN fusion ().
Figure 1 The landscape of genetic alterations in 75 of 83 samples (90.36%) from 81 glioma cases. Genetic mutations were identified by targeted next-generation sequencing in the tumor tissues of patients. The upper panel shows the numbers of nonsynonymous single‑nucleotide variants, small insertions or deletions and copy number variants in each tumor. The heat map below shows genes with somatic mutations sorted according to the mutation frequency. Mutations (n) is the number of mutations per gene.
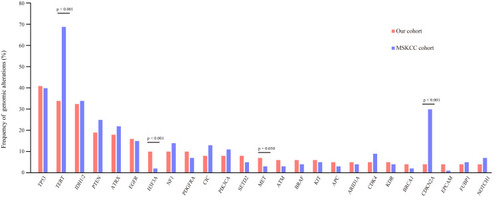
When we compared the 25 most frequently mutated genes found in this study to the Memorial Sloan Kettering Cancer Center database (MSKCC, Clin Cancer Res 2019, 923 glioma patients, which primarily includes Caucasian patients),Citation21 we found that the most commonly mutated genes were TP53, TERT, and IDH1, followed by PTEN, ATRX, EGFR, NF1, and H3F3A (). There was no significant difference in the frequency of TP53, IDH1, PTEN, ATRX, EGFR, or CIC gene mutations between our cohort of glioma patients and the MSKCC database (). However, we found that TERT and H3F3A exhibited a higher mutation frequency in our cohort, whereas MET and CDKN2A presented a lower mutation frequency in our cohort of glioma patients (). These results suggest that there is a difference in genes between Chinese and Caucasian racial backgrounds with respect to glioma.
Figure 2 Comparison of mutation frequencies of the top 25 genes from the Chinese and MSKCC cohorts. Commonly mutated genes are arranged in order on the horizontal axis. The vertical axis represents the mutation frequency obtained from a different cohort.
Concurrent and Exclusive Gene Analysis
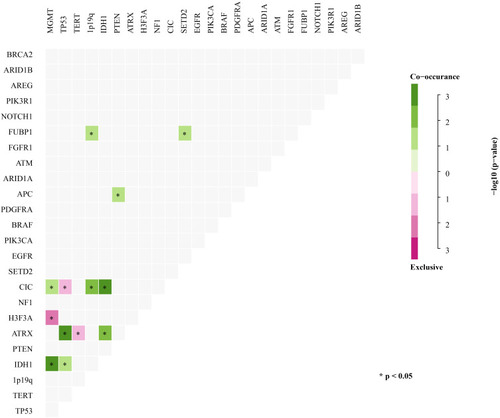
Previous studies using genomic landscape studies have reported multiple cooccurring or mutually exclusive mutations of genes in different cancer types.Citation22,Citation23 For example, the coexistence of PDGFRA and EGFR gene amplifications is commonly found in glioblastoma (GBM).Citation24 In addition, EGFR amplification and IDH1 mutations are mutually exclusive in low-grade gliomas.Citation25 Similarly, our study showed that the mutual exclusion and coexistence of these gene mutations occurred in at least five samples (). However, our analysis showed that additional genetic alterations coexisting in gliomas, such as MGMT methylation and IDH1, ATRX, TP53, and CIC somatic mutations, significantly coexisted (). Other considerable coexisting genes included ATRX and TP53, PTEN and APC, CIC and MGMT methylation, and 1p/19q codeletion, as well as FUBP1 and TERT and SETD2 (P<0.05) (). In contrast, mutual gene exclusion was relatively rare in gliomas. Only CIC and TP53, TERT and ATRX, MGMT methylation and H3F3A showed significant mutual exclusion ().
Figure 3 Concurrent and mutually exclusive somatic mutation patterns of significantly mutated genes. Significance was calculated using Fisher’s exact test, *p < 0.05.
Copy Number Variation (CNV) Analysis
Copy number variation is a prevalent form of abnormal change in the copy number of several specific genes that commonly occur in tumor development and progression and results in altered gene expression.Citation26,Citation27 In this study, NGS-based CNV analysis was used to examine the impact of CNV in glioma in a Chinese cohort. A total of 61 CNVs were identified in 26 samples (31%), with an average of 2.35 CNVs (1–14) per sample (). There were 53 copy number amplifications and copy number deletions (). CNVs frequently occurred in the age group older than 40 years (17, 20%) (). In addition, high-grade gliomas, such as GBM, were characterized by more frequent CNVs (18, 22%), while low-grade gliomas rarely exhibited CNV (P=0.0001), suggesting that CNV is closely related to patient survival ().
Table 2 Distributions of Representative Genomic Alterations and Clinical Characteristics Between the Different Pathological Subtypes with Glioma
Figure 4 Copy number variation (CNV) analysis. (A) Distribution shift of CNVs in 26 of 83 glioma samples (31.33%). Copy number losses (blue) and gains (pink) were determined from sequencing data. CNVs (n) is the number of mutations per gene. (B) Comparison of mutation frequencies of CNVs among the top 15 genes from the Chinese and MSKCC cohorts. The commonly CNV genes are arranged in order on the horizontal axis. The vertical axis represents the CNV frequency obtained from a different cohort.
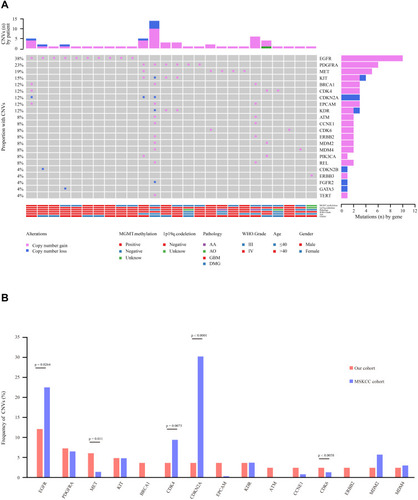
Previous studies have shown that CNV involves a set of tumor suppressor genes and oncogenes found in GBM.Citation28,Citation29 Importantly, these studies showed that GBM with EGFR amplification was significantly associated with both worse disease-free survival (DFS) and overall survival (OS) rates.Citation28,Citation29 Hence, the CNV profile in glioma is worth noting in our cohort. In comparison to the 13 genes with the highest CNV in the MSKCC cohort, we found that the frequencies of CNV in MET, EPCAM, ATM, CCNE1, CDK6, and ERBB2 were much higher, while EGFR, CDK4, and CDKN2A were much lower in our cohort (). However, the frequencies of CNV in PDGFRA, KIT, KDR, and MDM2/4 were not significantly different from those in the MSKCC cohort ().
Mutational Landscape in Pathological Subtypes
There were fewer gene mutations in PA, which were primarily found in males aged ≤40 years and were under WHO grade I (). Those >40 years old (P=0.007) were the majority in GBM patients compared to PA, A, AA, O, AO, and DMG () (). Similarly, mutations in TP53 (P=0.0101), TERT (P=0.0005), IDH1 (P<0.0001), PIK3CA (P=0.0095), PTEN (P=0.0123), EGFR amplification (P<0.0001), MGMT methylation (P=0.0042), and CNV (P<0.0001) were dominant in GBM compared to the other subtypes () (). In addition, GBM also exhibited recurring genetic mutations, including ATRX mutations (6/32, 19%) and PDGFRA amplification (5/32, 16%) () (). Hence, as expected, among patients with grade II–III A/AA, TP53 mutation was the most common genomic alteration (13/20, 65%), followed by IDH1/2 mutation (11/20, 55%) and ATRX (7/20, 35%) (). Moreover, in the Grade II–III O/AO subgroup, IDH1/2 mutation (12/17, 71%), TERT mutation (6/17, 35%), and 1p19q codeletion (10/17, 59%) were the major genetic alterations () (). Most O/AOs exhibited TERT promoter (6/17, 35%), CIC (6/17, 35%), and FUBP1 (3/17, 18%) mutations (). The H3K28M mutation only occurred in DMG patients. Other common genetic alterations in DMG included TP53 mutation (3/8, 38%), TERT promoter mutation (2/8, 25%), PDGFRA amplification (2/8, 25%), PTEN mutation (1/8, 13%), and ATRX mutation (1/8, 13%), but no mutations were observed in IDH, EGFR, or MGMT methylation (). In addition, MGMT methylation was evenly distributed among the three major subtypes: A/AA (13/20), O/AO (13/17), and GBM (15/32) () (). These findings indicate that each subtype of glioma has a distinct pattern of genetic alterations, and only multigene NGS analysis is able to identify these gene markers simultaneously.
Figure 5 Comprehensive molecular profiles of different pathological subtypes.
Our results found that among 17 patients with oligodendroglial tumors only 10 patients with IDH mutations and 1p19q codeletion. The molecular classification results of 7 patients were inconsistent with the pathological classification results. Two of these cases harbored an IDH1 R132H mutation, so the status of 1p/19q was of additional diagnostic import. The two cases were classified as based on morphology but harbored 1p19q-intacted and TP53 mutation, which is sufficient for the revised diagnosis of IDH mutation type A (2016 WHO CNS criteria). Five cases harbored IDH-wild mutation and 1p19q-intacted, but two cases of them mutated in FGFR1, one case mutated in BRAF V600E, and two cases mutated in other mutations (eg, ATM, PDGFRA), which is for the revised diagnosis of FGFR mutation type, BRAF mutation type and NEC diffuse glioma (cIMPACT-NOW update4).Citation30 Here we have demonstrated the utility of NGS panel in identifying the relevant alterations necessary for subtyping O/AO using the updated glioma classification.
Analysis of Genomic Features in Different WHO Grades
In this study, targeted sequencing was used to analyze the pattern of mutations frequently associated with high-grade and low-grade gliomas. We evaluated SNVs, short insertions, deletions, and CNVs of 28 genes in 27 low-grade gliomas (LGGs) and 56 high-grade gliomas (HGGs). There was a significant difference between low-grade and high-grade gliomas with respect to sex and age () (). Patients ≤40 years old were often found to have low-grade gliomas (P=0.0248), while women were more likely to develop high-grade gliomas (P=0.019). We found that mutations in IDH1/2 (P=0.0019) and CIC (P=0.0017) were more prevalent in low-grade gliomas () (). On the other hand, mutations in TERT (P=0.0398), EGFR (P=0.0064), H3F3A (P=0.0388), PDGFRA (P=0.0388), and CNV (P<0.0001) were primarily found in high-grade (III–IV) gliomas () (). Seven gene mutations (TERT, IDH1, EGFR, H3F3A, PDGFRA, and CIC) and CNV were typically observed in HGG () (). Of note, several genomic mutations have been found only in high-grade tumors, including EGFR and MET amplification, PTEN genomic deletion, and PIK3CA mutations, indicating that mutations in these genes may represent biomarkers for predicting poor prognosis in high-grade gliomas.
Table 3 Comparison of Important Genes with Somatic Alterations and Clinical Characteristics in Low-Grade (I–II) and High-Grade (III–IV) of Glioma
Figure 6 Comparison of the mutational landscape between low-grade (I–II) and high-grade (III–IV) glioma.
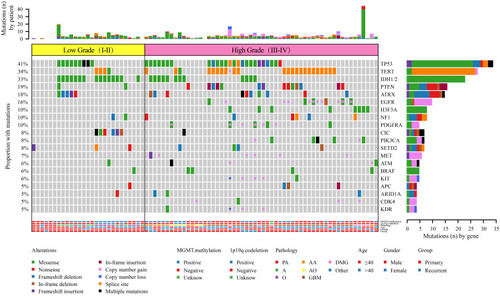
Although high frequencies of IDH1/2 mutations are typically used for the molecular genetic classification of gliomas according to the modern WHO CNS tumor classification,Citation3,Citation25 our findings indicated that the mutational frequency of IDH1/2 in LGG (15/27) and HGG (12/56) did not provide high accuracy in the classification for grading gliomas (). On the other hand, previous reports have documented that amplification of chromosome 7 and deletion of chromosome 10 are the primary tumor-driving events in low-grade gliomas.Citation31 Consistently, our targeted sequencing results demonstrated that the EGFR gene, which is located on chromosome 7, was amplified in 13/27 LGGs, and the ATRX gene, which is located on chromosome 10, was deleted in 5/27 LGGs, while there was no detection of either gene in HGGs (). This suggests that WHO reclassification should consider not only IDH1/IDH2 mutationsCitation3 but also EGFR amplification and ATRX deletion simultaneously for the diagnosis of glioma tumor grading.
Analysis of Mutated Genes by Different Disease States
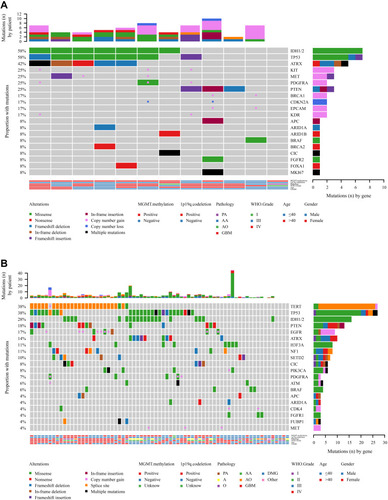
The significant differences in mutated genes between the initial treatment and recurrent groups included IDH1/2, ATRX, CIC, MET, and KIT genes. IDH1/2 (P=0.0391), ATRX (P=0.0365), CIC (P<0.0001), MET (P=0.0367), and KIT (P=0.0201) mutations were significantly higher in recurrent gliomas than in gliomas receiving initial treatment () (). In addition, the frequency of CNV was 2-fold higher in the recurrence group than in the initial treatment group () (). However, additional data with a larger sample size are needed for further confirmation.
Table 4 Overview of the Distinctive Characteristics for Primary and Recurrent Glioma
Figure 7 Mutational landscape of (A) primary gliomas and (B) recurrent gliomas.
Discussion
Improved classification of gliomas using molecular criteria led to a significant revision of the WHO criteria for brain tumors in 2016.Citation32 To date, the neuropathology diagnostic laboratory has performed individual tests for selected biomarkers, such as IDH1, IDH2, ATRX, and TERT, as well as mutations in H3F3A and BRAF and 1p/19q chromosome deletion.Citation33 This involves a variety of detection methods, including the use of mutation-specific antibodies, such as IHC against IDH1-R132H, BRAF-V600E, and H3K28M,Citation34 conventional Sanger sequencing or tumor DNA pyrosequencing to detect mutations/methylation, and fluorescence or chromogenic in situ hybridization (FISH/CISH) and microsatellite analysis to detect 1p/19q chromosome deletion.Citation35 However, emerging genetic mutations have broad prospects for screening, prognosis, and use as biomarkers.Citation36 Recent studies have shown that these standards can be achieved using NGS-based methods. Several studies have found that NGS panels are able to detect known genetic mutations identified by traditional techniques.Citation37,Citation38 Our multigene NGS panel simultaneously evaluated multiple mutations, insertions, gene rearrangements, and CNVs associated with gliomas in Chinese patients. Our molecular analysis confirmed that the significant value of NGS targeting gliomas could help improve the classification of brain tumors and could help physicians choose the best targeted therapy.Citation39 However, our detection panel was limited in that MGMTmethylation detection was not included in the detection range and must be tested separately using other methods.
A clear distinction among glioma subgroups remains insufficient and needs to be improved to dissect these neoplasms into meaningful biological subgroups. For example, it is unclear how to distinguish between high‐risk and low‐risk patients with LGG.Citation40 Diffuse gliomas comprise most brain tumors, including A/AA and O/AO.Citation41 Their correct pathologic classification could absolutely convey a better outcome in response to targeted therapy. However, diagnosis of these tumors remains challenging because they cannot be confirmed simply based on histological findings, and there is a need for reliable genetic and immunohistochemical markers.Citation42 In contrast, targeted NGS or massive parallel sequencing allows accurate examination of a wide range of genetic alterations in tumors simultaneously within a short time.Citation43 According to the 2016 WHO CNS tumor classification, targeted NGS used for molecular diagnosis has been routinely applied for diagnosis of these brain tumors.Citation37,Citation44 Indeed, numerous studies have reported the analytic value of targeted NGS for routine brain tumor diagnostics. Zacher et al used 20 gene panels to conduct a comprehensive histological and molecular classification of 111 diffuse gliomas, reclassifying OA and GBM based on the status of IDH mutations and identifying tumors with H3F3A mutations.Citation45 Ballester et al used a broader NGS panel (46–50 genes) in 381 brain tumors and found that the marker genes most relevant to brain tumor classification were IDH1/2, TP53, PIK3CA, BRAF, EGFR, PDGFRA, and FGFR1/2/3.Citation46 Indeed, in our study, 17 samples contained oligodendrocyte components and were originally diagnosed as Grade II–III O/AO. In the subgroup, IDH1/2 mutation (12/17, 71%), TERT mutation (6/17, 35%), and 1p19q codeletion (10/17, 59%) were the major genetic alterations. Except for mutations in IDH1/2 and TERT, O/AO also had CIC and FUBP1 mutations. Seven patients did not conform to the 2016 WHO CNS classification criteria of IDH mutated and 1p19q codeletion. We re-analyzed a series of AO/O cases and using an 808-panel NGS assay, refined or reclassified the diagnoses based on the molecular-rich criteria (eg, BRAF, FGFR) provided in the cIMPACT-NOW update4(2) CNS tumor classification. The pathological of these patients have been redefined. In addition, Sahm et al found that their NGS panel identified diagnostic markers and actionable targets for brain tumors.Citation47 However, none of these studies further improved the diagnostic value due to a lack of large NGS panel data. In contrast, our study found not only similar genetic markers in brain tumors but also additional and novel mutational and genetic alterations used for the classification and prognosis of brain tumors, such as mutations in CIC, FUBP1, TP53, BRAF, PIK3CA, NF1, FGFR, NOTCH1, EGFR, ATM, and PDGFRA amplification. These novel and clinically actionable variants could assist in exploring better-targeted therapies for glioma treatment.
In this study, the most common mutations in invasive glioma were TP53, TERT, IDH1, PTEN, ATRX, and EGFR, consistent with other reports.Citation48,Citation49 In astrocytoma grade II/III, 10/11 (91%) IDH mutation cases also exhibited TP53 mutations, and 4/4 (100%) IDH1 mutations in GBM also contained TP53 mutations. Neither grade II/III astrocytoma nor grade IV GBM with IDH1 mutation exhibited EGFR mutations or PDGFRA amplification. All LGGs and HGGs with gene amplification evidence were primarily IDH wild type, particularly GBM, which was 100% IDH wild type and exhibited gene amplification. Only 2 IDH mutant gliomas had MET amplification comutations, indicating that IDH1/2 and copy numbers rarely cooccur. IDH2 mutations are rare in GBM. These data are consistent with the existence of distinct genetic pathways for primary (IDH-WT) and secondary (IDH-mutant) GBM.Citation50
Our estimated gene amplification events based on NGS coverage data were 0% O (grade II), 10% A/AA (grade II/III), 11.76% AO tumors (grade III), and 56.25% GBM (grade IV), indicating that copy number variation is more frequent in high-grade gliomas. EGFR and PDGFR amplification events can be detected by NGS analysis and may guide therapeutic intervention.Citation23 For example, clinical trials (NCT01257594, NCT02331693, NCT02101905, and NCT02233049) evaluating EGFR or PDGFR inhibitors, such as erlotinib, lapatinib, and nilotinib, or immunotherapy-based methods for EGFR-overexpressing tumors, as well as regorafenib in relapsed glioblastoma (REGOMA) (NCT02926222)Citation51 (https://clinicaltrials.gov/), are ongoing. However, before using gene amplification results for clinical decision-making, it is best to use other molecular analyses for proper clinical validation to guide targeted therapy in glioblastoma.Citation52,Citation53
Herein, we found that the frequency of CNV events in high-grade gliomas was significantly higher than in low-grade tumors, and the recurrence group had significantly more CNV events than the initial treatment group. Previous studies have found that the existence of EGFR amplification in CNV analysis was significantly associated with both worse disease-free survival (DFS) and overall survival (OS) in gliomas.Citation28,Citation29 Obviously, DNA copy number variations, especially amplification on chromosome 7, including EGFR/MET/CDK6, and chromosome 4, including PDGFRA, are commonly observed in gliomas.Citation23 IDH mutation is a well-known prognostic factor. According to previous reports, the CNV pattern in IDH-mutated gliomas is distinct from that in IDH wild-type groups, and the prognosis is worse.Citation28 In comparing our cohort to the MSKCC cohort, which has a primarily Caucasian racial background, some gene mutations, especially the incidence of CNVs, were different. The reason may be differences in ethnicity and clinical characteristics between the two cohorts. In addition, we noted that CDKN2A has a lower mutation frequency in Chinese patients. Previous studies have shown that in terms of OS, loss of CDKN2A is associated with poor treatment response and shorter OS in diffuse glioma.Citation54 However, MET, EPCAM, and ERBB2 CNVs have a higher mutation frequency in Chinese patients, indicating that it is reasonable and feasible to identify risk stratification factors from recurring characteristics.
Conclusions
Routine use of multigene NGS in the simultaneous evaluation of multiple relevant markers is a reliable and effective method for identifying novel genetic alterations for better classification of brain tumors. This allows clinicians to evaluate prognosis and additional potential therapeutic options, such as targeted therapy, for patients with gliomas according to different racial or ethnic groups. Our findings implicate gene panel NGS as a promising diagnostic technique that may facilitate integrated histological and molecular glioma classification. It is expected that NGS-based molecular analysis may play an increasingly important role in formal cancer classification and treatment of brain tumors in the future.
Ethical Statement
The study was conducted in accordance with the Declaration of Helsinki (as revised in 2013). This study was approved by the Medical Ethics Committee of Peking University International Hospital (YN2020QN03), and the written informed consent was obtained from each patient. We confirmed all the data used in this study was anonymized or maintained with confidentiality.
Author Contributions
All authors made substantial contributions to conception and design, acquisition of data, or analysis and interpretation of data; took part in drafting the article or revising it critically for important intellectual content; agreed to submit to the current journal; gave final approval of the version to be published; and agree to be accountable for all aspects of this work.
Disclosure
Mingwei Li, Huina Wang, Feng Lou, and Shanbo Cao are from Acornmed Biotechnology Co., Ltd. Dr Changyu Lu report non-financial support, other from Acornmed Biotechnology Co., Ltd, during the conduct of the study. All other authors have declared no conflicts of interest.
Acknowledgments
The authors wish to thank all patients who participated in this study.
References
- Ostrom QT, Gittleman H, Fulop J, et al. CBTRUS statistical report: primary brain and central nervous system tumors diagnosed in the United States in 2008–2012. Neuro Oncol. 2015;17(Suppl 4):iv1–iv62. doi:10.1093/neuonc/nov18926511214
- Onizuka H, Masui K, Komori T. Diffuse gliomas to date and beyond 2016 WHO classification of tumours of the central nervous system. Int J Clin Oncol. 2020;25(6):997–1003. doi:10.1007/s10147-020-01695-w32468200
- Louis DN, Perry A, Reifenberger G, et al. The 2016 world health organization classification of tumors of the central nervous system: a summary. Acta Neuropathol. 2016;131(6):803–820. doi:10.1007/s00401-016-1545-127157931
- Akagi Y, Yoshimoto K, Hata N, et al. Reclassification of 400 consecutive glioma cases based on the revised 2016WHO classification. Brain Tumor Pathol. 2018;35(2):81–89. doi:10.1007/s10014-018-0313-429569163
- Ebrahimi A, Skardelly M, Bonzheim I, et al. ATRX immunostaining predicts IDH and H3F3A status in gliomas. Acta Neuropathol Commun. 2016;4(1):60. doi:10.1186/s40478-016-0331-627311324
- Zheng L, Zhang M, Hou J, et al. High-grade gliomas with isocitrate dehydrogenase wild-type and 1p/19q codeleted: atypical molecular phenotype and current challenges in molecular diagnosis. Neuropathology. 2020;40(6):599–605. doi:10.1111/neup.1267232761642
- Ghidini M, Petrelli F, Hahne JC, et al. Clinical outcome and molecular characterization of brain metastases from esophageal and gastric cancer: a systematic review. Med Oncol. 2017;34(4):62. doi:10.1007/s12032-017-0919-028315230
- Ducray F, Idbaih A, Wang XW, et al. Predictive and prognostic factors for gliomas. Expert Rev Anticancer Ther. 2011;11(5):781–789. doi:10.1586/era.10.20221554053
- Cho HJ, Zhao J, Jung SW, et al. Distinct genomic profile and specific targeted drug responses in adult cerebellar glioblastoma. Neuro Oncol. 2019;21(1):47–58. doi:10.1093/neuonc/noy12330085274
- Appin CL, Brat DJ. Biomarker-driven diagnosis of diffuse gliomas. Mol Aspects Med. 2015;45:87–96. doi:10.1016/j.mam.2015.05.00226004297
- Cantero D, Mollejo M, Sepulveda JM, et al. TP53, ATRX alterations, and low tumor mutation load feature IDH-wildtype giant cell glioblastoma despite exceptional ultra-mutated tumors. Neurooncol Adv. 2020;2(1):vdz059. doi:10.1093/noajnl/vdz05932642724
- Barritault M, Meyronet D, Ducray F. Molecular classification of adult gliomas: recent advances and future perspectives. Curr Opin Oncol. 2018;30(6):375–382. doi:10.1097/CCO.000000000000048230148717
- Parker NR, Khong P, Parkinson JF, et al. Molecular heterogeneity in glioblastoma: potential clinical implications. Front Oncol. 2015;5:55. doi:10.3389/fonc.2015.0005525785247
- Ene CI, Holland EC. Personalized medicine for gliomas. Surg Neurol Int. 2015;6(Suppl1):S89–95. doi:10.4103/2152-7806.15135125722938
- Parilla M, Kadri S, Patil SA, et al. Integrating a large next-generation sequencing panel into the clinical diagnosis of gliomas provides a comprehensive platform for classification from FFPE tissue or smear preparations. J Neuropathol Exp Neurol. 2019;78(3):257–267. doi:10.1093/jnen/nly13030698790
- Nikiforova MN, Wald AI, Melan MA, et al. Targeted next-generation sequencing panel (GlioSeq) provides comprehensive genetic profiling of central nervous system tumors. Neuro Oncol. 2016;18(3):379–387. doi:10.1093/neuonc/nov28926681766
- Movassaghi M, Shabihkhani M, Hojat SA, et al. Early experience with formalin-fixed paraffin-embedded (FFPE) based commercial clinical genomic profiling of gliomas-robust and informative with caveats. Exp Mol Pathol. 2017;103(1):87–93. doi:10.1016/j.yexmp.2017.06.00628663030
- Li J, Lupat R, Amarasinghe KC, et al. CONTRA: copy number analysis for targeted resequencing. Bioinformatics. 2012;28(10):1307–1313. doi:10.1093/bioinformatics/bts14622474122
- Boeva V, Popova T, Bleakley K, et al. Control-FREEC: a tool for assessing copy number and allelic content using next-generation sequencing data. Bioinformatics. 2012;28(3):423–425. doi:10.1093/bioinformatics/btr67022155870
- Eckel-Passow JE, Lachance DH, Molinaro AM, et al. Glioma groups based on 1p/19q, IDH, and TERT promoter mutations in tumors. N Engl J Med. 2015;372(26):2499–2508. doi:10.1056/NEJMoa140727926061753
- Jonsson P, Lin AL, Young RJ, et al. Genomic correlates of disease progression and treatment response in prospectively characterized gliomas. Clin Cancer Res. 2019;25(18):5537–5547. doi:10.1158/1078-0432.Ccr-19-003231263031
- Okamoto I, Sakai K, Morita S, et al. Multiplex genomic profiling of non-small cell lung cancers from the LETS Phase III trial of first-line S-1/carboplatin versus paclitaxel/carboplatin: results of a West Japan oncology group study. Oncotarget. 2014;5(8):2293–2304. doi:10.18632/oncotarget.190624810493
- Szerlip NJ, Pedraza A, Chakravarty D, et al. Intratumoral heterogeneity of receptor tyrosine kinases EGFR and PDGFRA amplification in glioblastoma defines subpopulations with distinct growth factor response. Proc Natl Acad Sci U S A. 2012;109(8):3041–3046. doi:10.1073/pnas.111403310922323597
- Munoz-Hidalgo L, San-Miguel T, Megias J, et al. Somatic copy number alterations are associated with EGFR amplification and shortened survival in patients with primary glioblastoma. Neoplasia. 2020;22(1):10–21. doi:10.1016/j.neo.2019.09.00131751860
- Brito C, Azevedo A, Esteves S, et al. Clinical insights gained by refining the 2016 WHO classification of diffuse gliomas with: EGFR amplification, TERT mutations, PTEN deletion and MGMT methylation. BMC Cancer. 2019;19(1):968. doi:10.1186/s12885-019-6177-031623593
- Liu B, Morrison CD, Johnson CS, et al. Computational methods for detecting copy number variations in cancer genome using next generation sequencing: principles and challenges. Oncotarget. 2013;4(11):1868–1881. doi:10.18632/oncotarget.153724240121
- Shao X, Lv N, Liao J, et al. Copy number variation is highly correlated with differential gene expression: a pan-cancer study. BMC Med Genet. 2019;20(1):175. doi:10.1186/s12881-019-0909-531706287
- Mirchia K, Sathe AA, Walker JM, et al. Total copy number variation as a prognostic factor in adult astrocytoma subtypes. Acta Neuropathol Commun. 2019;7(1):92. doi:10.1186/s40478-019-0746-y31177992
- Zhang L, Liu Z, Li J, et al. Genomic analysis of primary and recurrent gliomas reveals clinical outcome related molecular features. Sci Rep. 2019;9(1):16058. doi:10.1038/s41598-019-52515-931690770
- Berzero G, Di Stefano AL, Ronchi S, et al. IDH-wildtype lower grade diffuse gliomas: the importance of histological grade and molecular assessment for prognostic stratification. Neuro Oncol. 2020. doi:10.1093/neuonc/noaa258
- Crespo I, Vital AL, Nieto AB, et al. Detailed characterization of alterations of chromosomes 7, 9, and 10 in glioblastomas as assessed by single-nucleotide polymorphism arrays. J Mol Diagn. 2011;13(6):634–647. doi:10.1016/j.jmoldx.2011.06.00321884817
- Blumcke I, Aronica E, Becker A, et al. Low-grade epilepsy-associated neuroepithelial tumours - the 2016 WHO classification. Nat Rev Neurol. 2016;12(12):732–740. doi:10.1038/nrneurol.2016.17327857123
- Reifenberger G, Wirsching HG, Knobbe-Thomsen CB, et al. Advances in the molecular genetics of gliomas - implications for classification and therapy. Nat Rev Clin Oncol. 2017;14(7):434–452. doi:10.1038/nrclinonc.2016.20428031556
- Cai J, Zhang C, Zhang W, et al. ATRX, IDH1-R132H and Ki-67 immunohistochemistry as a classification scheme for astrocytic tumors. Oncoscience. 2016;3(7–8):258–265. doi:10.18632/oncoscience.31727713914
- Jha P, Sarkar C, Pathak P, et al. Detection of allelic status of 1p and 19q by microsatellite-based PCR versus FISH: limitations and advantages in application to patient management. Diagn Mol Pathol. 2011;20(1):40–47. doi:10.1097/PDM.0b013e3181e961e921326038
- Silantyev AS, Falzone L, Libra M, et al. Current and future trends on diagnosis and prognosis of glioblastoma: from molecular biology to proteomics. Cells. 2019;8(8):863. doi:10.3390/cells8080863
- Carter JH, McNulty SN, Cimino PJ, et al. Targeted next-generation sequencing in molecular subtyping of lower-grade diffuse gliomas: application of the world health organization’s 2016 revised criteria for central nervous system tumors. J Mol Diagn. 2017;19(2):328–337. doi:10.1016/j.jmoldx.2016.10.01028042970
- Cantero D, Rodriguez de Lope A, Moreno de la Presa R, et al. Molecular study of long-term survivors of glioblastoma by gene-targeted next-generation sequencing. J Neuropathol Exp Neurol. 2018;77(8):710–716. doi:10.1093/jnen/nly04830010995
- Shin H, Sa JK, Bae JS, et al. Clinical targeted next-generation sequencing panels for detection of somatic variants in gliomas. Cancer Res Treat. 2020;52(1):41–50. doi:10.4143/crt.2019.03631096737
- Geurts M, van den Bent MJ. On high-risk, low-grade glioma: what distinguishes high from low? Cancer. 2019;125(2):174–176. doi:10.1002/cncr.3183430512190
- Esparragosa I, Diez-Valle R, Tejada S, et al. Management of diffuse glioma. Presse Med. 2018;47(11–12Pt2):e199–e212. doi:10.1016/j.lpm.2018.04.01430385181
- Iorgulescu JB, Torre M, Harary M, et al. The misclassification of diffuse gliomas: rates and outcomes. Clin Cancer Res. 2019;25(8):2656–2663. doi:10.1158/1078-0432.CCR-18-310130635340
- Moller RS, Hammer TB, Rubboli G, et al. From next-generation sequencing to targeted treatment of non-acquired epilepsies. Expert Rev Mol Diagn. 2019;19(3):217–228. doi:10.1080/14737159.2019.157314430661434
- Na K, Kim HS, Shim HS, et al. Targeted next-generation sequencing panel (TruSight Tumor 170) in diffuse glioma: a single institutional experience of 135 cases. J Neurooncol. 2019;142(3):445–454. doi:10.1007/s11060-019-03114-130710203
- Zacher A, Kaulich K, Stepanow S, et al. Molecular diagnostics of gliomas using next generation sequencing of a glioma-tailored gene panel. Brain Pathol. 2017;27(2):146–159. doi:10.1111/bpa.1236726919320
- Ballester LY, Fuller GN, Powell SZ, et al. Retrospective analysis of molecular and immunohistochemical characterization of 381 primary brain tumors. J Neuropathol Exp Neurol. 2017;76(3):179–188. doi:10.1093/jnen/nlw11928395087
- Sahm F, Schrimpf D, Jones DT, et al. Next-generation sequencing in routine brain tumor diagnostics enables an integrated diagnosis and identifies actionable targets. Acta Neuropathol. 2016;131(6):903–910. doi:10.1007/s00401-015-1519-826671409
- Vaubel RA, Tian S, Remonde D, et al. Genomic and phenotypic characterization of a broad panel of patient-derived xenografts reflects the diversity of glioblastoma. Clin Cancer Res. 2020;26(5):1094–1104. doi:10.1158/1078-0432.CCR-19-090931852831
- Baldock AL, Yagle K, Born DE, et al. Invasion and proliferation kinetics in enhancing gliomas predict IDH1 mutation status. Neuro Oncol. 2014;16(6):779–786. doi:10.1093/neuonc/nou02724832620
- Miyata S, Tominaga K, Sakashita E, et al. Comprehensive metabolomic analysis of IDH1(R132H) clinical glioma samples reveals suppression of beta-oxidation due to carnitine deficiency. Sci Rep. 2019;9(1):9787. doi:10.1038/s41598-019-46217-531278288
- Lombardi G, De Salvo GL, Brandes AA, et al. Regorafenib compared with lomustine in patients with relapsed glioblastoma (REGOMA): a multicentre, open-label, randomised, controlled, Phase 2 trial. Lancet Oncol. 2019;20(1):110–119. doi:10.1016/S1470-2045(18)30675-230522967
- Indraccolo S, De Salvo GL, Verza M, et al. Phosphorylated Acetyl-CoA carboxylase is associated with clinical benefit with regorafenib in relapsed glioblastoma: REGOMA trial biomarker analysis. Clin Cancer Res. 2020;26(17):4478–4484. doi:10.1158/1078-0432.CCR-19-405532518098
- Santangelo A, Rossato M, Lombardi G, et al. A molecular signature associated with prolonged survival in glioblastoma patients treated with regorafenib. Neuro Oncol. 2020. doi:10.1093/neuonc/noaa156
- Reis GF, Pekmezci M, Hansen HM, et al. CDKN2A loss is associated with shortened overall survival in lower-grade (World Health Organization Grades II–III) astrocytomas. J Neuropathol Exp Neurol. 2015;74(5):442–452. doi:10.1097/NEN.000000000000018825853694