
Abstract
Objective
Tripartite motif 66 (TRIM66) is reported to be closely associated with human cancers. However, the roles of TRIM66 in glioma remain unclear. The present study aimed to investigate the clinical significance and biological roles of TRIM66 in human glioma.
Methods
TRIM66 expression in glioma tissues was examined by immunohistochemistry. TRIM66 overexpression and siRNA knockdown were performed in glioblastoma cell lines. CCK8, colony formation assay, transwell assay, Annexin V and JC1 staining, glucose uptake assay, and Western blotting were used to explore the biological roles and potential underlying mechanisms of TRIM66 in glioma progression.
Results
Our results showed that TRIM66 was overexpressed in 52/95 glioma cases. The rates of TRIM66 overexpression in Grade I, Grade II, Grade III, and Grade IV gliomas were 16.6%, 41.3%, 58.6%, and 70.9%, respectively. Oncomine data showed that TRIM66 was upregulated in glioblastoma and oligodendroglioma compared with normal brain tissues. TRIM66 expression was higher in glioblastoma cell lines compared with normal SVG p12 glial cell line. TRIM66 promoted in vitro and in vivo proliferation, invasion, and inhibited temozolomide (TMZ)-induced apoptosis. Notably, TRIM66 increased glucose metabolism by upregulating glucose uptake, glucose consumption, and ATP production. Western blotting showed that TRIM66 positively regulated cMyc and GLUT3. Depletion of cMyc by siRNA abolished the effect of TRIM66 on GLUT3. Chromatin immunoprecipitation (ChIP) assay showed that cMyc could bind to the promoter regions of GLUT3 in glioblastoma cells.
Conclusion
TRIM66 was upregulated in human gliomas, where it promoted cell growth and chemoresistance. Our data also identified novel roles of TRIM66 in glioma progression. TRIM66 upregulates glucose uptake and mitochondrial function through the cMyc/GLUT3 signaling, which makes it a potential therapeutic target.
Introduction
Glioma is the most common malignant tumor in the central nervous system. Despite the improvement in earlier diagnosis, surgery, and chemotherapy, the prognosis for this malignancy remains poor.Citation1 Overexpression of oncogenes plays a vital role in the development and progression of human glioma and identifying molecular targets in tumor progression is an important task.Citation2,Citation3
Tripartite motif (TRIM) superfamily proteins, most of which have E3 ubiquitin ligase activities and characterized by conserved tripartite motif (TRIM), exhibit various cellular functions and biological processes including transcription regulation, intracellular signaling, cell growth, apoptosis, innate immunity, autophagy, developmental processes, and carcinogenesis.Citation4–Citation6 Tripartite motif 66 (TRIM66) is a member of the TRIM family which possesses potential functions as a transcriptional repressor.Citation7 TRIM66 has emerged as an oncogenic protein that is closely related to multiple malignant tumors. In hepatocellular carcinoma (HCC), overexpression of TRIM66 promoted cell proliferation and invasion.Citation8 TRIM66 activated Wnt signaling by increasing glycogen synthase kinase-3β (GSK-3β) phosphorylation and β-catenin expression.Citation8 TRIM66 deficiency suppressed cell viability, proliferation, migration, and invasion in prostate cancer cells, possibly through regulation of STAT2/IL-2 signaling.Citation9 These studies indicated that TRIM66 might function as an oncogenic protein. However, its expression pattern and biological effects in glioma have not been investigated.
Here, we investigated the expression pattern of TRIM66 in glioma tissues. We then explored the biological effects of TRIM66 on proliferation, invasion, and TMZ-induced apoptosis in glioma cells. The possible underlying mechanism was also investigated.
Methods and Materials
Patients and Specimens
This study was approved by the Institutional Review Boards of China Medical University and was conducted following the principles expressed in the Declaration of Helsinki. Informed consent was obtained from patients. The paraffin-embedded breast cancer specimens were obtained from the Pathology archives of the Fourth Affiliated Hospital of China Medical University, which contain specimens no longer required to be maintained.
Immunohistochemical Staining
The glioma tissue samples were fixed with paraformaldehyde and embedded in paraffin. Sections (4 µm thick) were prepared and the sections were deparaffinized with xylene and blocked for endogenous peroxidase with H2O2. The sections were washed with PBS buffer three times and incubated with TRIM66 (1:100, Sigma, USA) primary antibody at 4°C overnight. Subsequently, the sections were treated with Elivision plus Polymer HRP (Mouse/Rabbit) IHC Kit (Maixin Biotech, Fuzhou, China). After incubation, the sections were washed with PBS buffer and stained with DAB plus kit (Maixin Biotech).
Two pathologists (Huihui Xu and Qi Gao) who were blinded to all clinical data independently evaluated all samples and scored for protein immunoreactivity as well as for intensity of positively stained tumor cells. A third pathologist (Yahao Li, Associate professor) reviewed the slide when there was a discrepancy. Staining for each of the proteins was scored using the methods of modified immunoreactive score (IRS).Citation10,Citation11 The intensity of TRIM66 staining was scored as 0 negative; 1 weak; 2 moderate/strong. The percentage score was divided as: 0, 0%; 1 1–25%; 2, 26–50%; 3, 51–75% and 4, 76–100%. The two scores were multiplied to get a final staining score from 0–8. Samples with scores <4 were considered as TRIM66 low expression. Samples with scores between 4–8 were considered as TRIM66 high expression. Images were captured using Olympus BX53 microscope and Olympus CellSens software (Tokyo, Japan).
Cell Culture and Transfection
In this study, human glioma cell lines including A172, U87MG, U251, and human normal astrocyte SVG p12 were obtained from American Typical Culture Collection (ATCC, Manassas, VA, USA). A172 and U251 cells were cultured in DMEM medium. U87MG and SVG p12 cells were cultured in EMEM medium. Cells were cultured with mediums supplied with 10% fetal bovine serum (FBS). TRIM66 overexpression plasmid and negative control plasmid were purchased from Origene (Origene, Rockville, USA). Lipofectamine 3000 (Invitrogen, USA) was used for plasmid transfection. TRIM66 knockdown small interfering RNA and the corresponding non-targeting siRNA were obtained from Dharmacon. Dharmafect1 reagent (Horizon, Cambridge, UK) was used for siRNA knockdown.
Western Blot Analysis
Total proteins were harvested and extracted using lysis mixture with phosphatase inhibitor cocktail and protease inhibitor cocktail. Then, the protein samples were quantified and the same amount of proteins were transferred to PVDF membranes (EMD Millipore, MA, USA). The membranes were blocked with BSA at room temperature for 2 hours. Then, the membranes were washed with TTBS buffer and incubated with primary antibodies at 4°C overnight. Primary antibodies used were listed as follows: TRIM66 (1:1000, Sigma, USA), GLUT3 (1:800, Cell signaling technology, USA), cMyc (1:3000, Abcam, UK). Then, membranes were incubated with HRP-conjugated goat anti-rabbit or goat anti-mouse secondary antibodies for 2 h at 37°C. The immunoreactive bands were detected and reported using SuperSignal West Dura Extended Duration Substrate (Thermo, MA, USA) and Bio-Imaging Systems (DNR, Israel).
Real-Time Fluorescent Quantitative PCR
Total RNA solution of glioma cells was prepared using TRIzol reagent. After quantification, reverse transcription was performed using PrimeScript RT Kit (Takara, Dalian, China). And the reverse transcription reaction was conducted as follows: 37°C for 45 minutes and 85°C for 2 minutes. SYBR select master Mix Kit (Thermo, MA, USA) was used for qPCR, and the reaction was conducted as follows: 96°C for 3 minutes, 40 cycles of 95°C for 20 seconds, and 60°C for 30 seconds. The sequences of primers were listed as follows: TRIM66 for 5′-GAGGAAGCTGCAAAAGAAGGAC-3′, rev 5′-TGAGGCGCACATCTGATACCA-3′; GLUT3 for 5′- CCTTTGGCACTCTCAACCAGC −3′, rev 5′- AACCCAGTAGCAGCGGCCAT −3′; GADPH for 5′-GAAATCCCATCACCATCTTCCAG-3′, rev 5′-GAGCCCCAGCCTTCTCCAT-3′. Relative expression of TRIM66 was normalized to GAPDH and calculated according to 2-ΔΔct. This experiment was repeated three times.
CCK8 and Colony Formation Assay
The cell viability assay was performed using the Cell Counting Kit-8 solution. Cells were plated in 96-well plates at a concentration of 5000 cells/well. For quantitation of cell proliferation rate, 10μL of CCK8 solution was added to each well and incubated for 4 h at 37°C. Optical density was measured at 450nm using a microplate reader.
For colony formation assay, cells were seeded into dishes (about 1000 cells), incubated for 2 weeks, and then washed and stained with Giemsa. Colonies with more than fifty cells were counted using a microscope.
Flow Cytometry
Cells were harvested by trypsinization and centrifuged at 1200 rpm for 10 minutes to pellets. Then, the pellets were washed with PBS buffer (twice, 3 minutes each time). Annexin V/PI kit (BD bioscience, USA) was used for staining. Cells were re-suspended in 500μL binding buffer (1×). 5μL Annexin V-FITC and 5μL PI were incubated with the cell suspension in the dark for 15 minutes.
For cell cycle analyses, cells were harvested and washed in ice-cold phosphate-buffered saline (PBS) 3 times. Cells were fixed in 75% ethanol at −20°C overnight. Then, cells were centrifuged at 1200rpm for 10 minutes and the supernatant was discarded. The pellets were washed with ice-cold PBS 3 times (5 minutes each time). Cells were stained with 50µg/mL propidium iodide (Sigma-Aldrich, Germany), 10 µg/mL RNase A and 0.2% Triton X-100 for 30 minutes in the dark. A flow Cytometer was used to analyze the apoptosis rate and cell cycle distribution.
Analysis of Mitochondrial Membrane Potential
Mitochondrial membrane potential was analyzed using JC-1 dye (Cell signaling technology, MA, USA). Cells were collected and then incubated with 1µg/mL JC-1 for 30 min at 37°C. The stained cells were centrifuged at 1200 rpm for 10 minutes and washed with PBS 3 times. The cells were re-suspended in 300µL PBS buffer. The mitochondrial membrane potential was determined by Flow Cytometer.
Glucose Uptake Assay
Cells were trypsinized from the plate and washed with PBS buffer. Then, cells were centrifuged at 1200 rpm for 5 minutes. The pellets were re-suspended in PBS with 2% FBS (FBS/PBS). The 2-NBDG (Thermo Fisher Scientific, USA) stock solution was added to each cell suspension at a final concentration of 10 μM and incubated for 30 minutes at 37°C. Cells were collected, washed with ice-cold PBS, and re-suspended in 300 μL ice-cold FBS/PBS. The fluorescence intensity was measured using Flow Cytometer.
Glucose Consumption and ATP Level Measurement
The supernatants were collected and the glucose consumption was measured using the Glucose Oxidase (GOD) Assay Kit (Applygen Technologies, Beijing, China) according to the manufacturer′s instructions. For ATP level measurement, cells were lysed in 200μL of ATP Assay Buffer and the lysates were centrifuged at 12,000 rpm for 5 minutes. 100μL ATP reaction solution was added into a 96-well plate and 20μL samples were added to the ATP reaction solution. A standard curve was performed and the fluorescence was measured using a microplate reader.
Transwell Invasion Assay
Cell invasive capacity was determined by transwell invasion assay using the 24-well transwell chamber (Corning, NY, USA). Matrigel (BD bioscience, CA, USA) was coated in the upper compartment chamber and incubated for four hours. Cells in 100μL of serum-free DMEM medium were seeded on the upper chamber, and DMEM medium with 10% FBS was added into the bottom chamber. The cells were incubated for 24 hours; then, the cells on the bottom surface were fixed 4% paraformaldehyde and stained with 0.1% crystal violet for 2 hours.
Chromatin Immunoprecipitation (ChIP)
Cells were cross-linked with formaldehyde and resuspended in lysis buffer. The lysates were sonicated to yield 300–1000 bp DNA fragments. The DNA-protein complex was incubated with cMyc antibody (Abcam, USA) and IgG antibody (Cell signaling technology, USA) overnight at 4°C in the presence of protein A/G beads (Millipore, Hayward, CA, USA). qPCR was performed by using primers for the promoter of the SLC2A3/GLUT3 gene. The primers for ChIP were listed as follows:
SLC2A3/GLUT3 position 1 forward, 5ʹ CACCTCAGCCTCCCAAGTAGC 3ʹ
SLC2A3/GLUT3 position 1 reverse, 5ʹ GCAACACAGTGAGACCCCTT 3ʹ
SLC2A3/GLUT3 position 2 forward, 5ʹ CTCACGCCTGTAATCCCAGCA 3ʹ
SLC2A3/GLUT3 position 2 reverse, 5ʹ GTCTCCATCTCCTGACCTCGT 3ʹ
Nude Mice Xenograft
U251 cell line with stable TRIM66 overexpression was selected using G418 after transfection. BALB/c athymic nude mice were obtained from Slac Laboratory Animals company (Shanghai, China). Xenograft model was established by subcutaneous injection of stable cells (5 million cells/mouse). Tumor size was measured and recorded. Animals were sacrificed and xenograft tumors were removed 25 days after injection.
Statistical Analysis
The data were analyzed using SPSS 22.0 software for Windows (SPSS, Chicago, IL, USA). Data of TRIM66 expression was downloaded from the Oncomine database and statistically analyzed by Mann–Whitney U-test. Overall survival was visualized using Kaplan–Meier curves, and the differences were compared by Log rank test. Comparisons of biological experiments between different groups were performed using the Student′s t-test. P<0.05 was considered a statistically significant difference.
Results
TRIM66 is Overexpressed in Glioma
We first examined the protein expression of TRIM66 in 95 glioma specimens by immunohistochemistry. Staining intensity and percentage were combined to evaluate TRIM66 expression levels. Normal glial cells showed negative or weak expression (). In contrast, TRIM66 overexpression was observed in 54.7% (52/95) of glioma tissues (–).
Figure 1 Expression of TRIM66 in glioma specimens. (A) Negative TRIM66 staining in normal glial cells. (B) Negative TRIM66 staining in a case of Grade I glioma (pilocytic astrocytoma). (C) Negative TRIM66 staining in a case of Grade II glioma (diffuse astrocytoma). (D) High TRIM66 staining in a case of Grade III glioma (anaplastic astrocytoma). (E) Negative TRIM66 staining in a case of Grade IV glioma (glioblastoma multiforme). (F) High TRIM66 staining in a case of Grade IV glioma (glioblastoma multiforme).
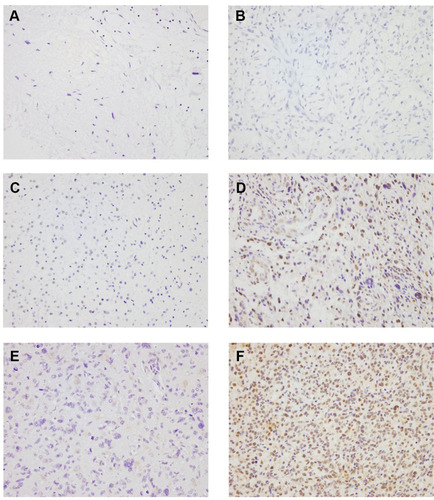
Next, we analyzed the correlation between clinicopathological factors and TRIM66. The results showed that the rate of TRIM66 protein upregulation in Grade I (pilocytic astrocytoma), Grade II (diffuse astrocytoma), Grade III (anaplastic astrocytoma), and Grade IV glioma (glioblastoma multiforme, GBM) were 16.6%, 41.3%, 58.6%, and 70.9%, respectively () (p=0.0284). Grade III glioma and glioblastoma multiforme (GBM) showed a significantly higher positive rate compared with Grade I and II gliomas. Since grade I glioma (pilocytic astrocytoma) samples are uncommon compared with higher grade gliomas. The cohort of grade I gliomas is only 6 patients and therefore it might be hard to have a representative TRIM66 expression in this subgroup of patients.
Table 1 The Relationship Between TRIM66 and Clinical Features of Astrocytoma
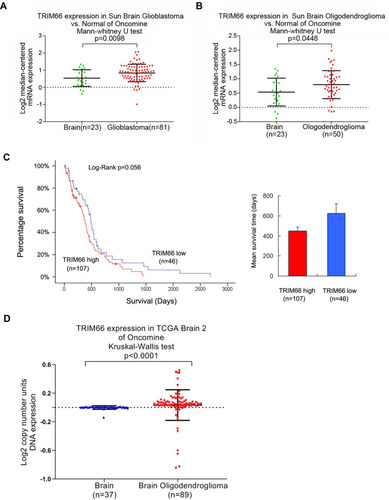
We also analyzed data from the Oncomine database. The Sun Brain Glioblastoma dataset showed TRIM66 mRNA was higher in glioblastoma tissues compared with normal brain tissues (). Sun Brain Oligodendroglioma dataset showed that TRIM66 expression was higher in Oligodendroglioma compared with the normal brain (). The Cancer Genome Atlas (TCGA) glioma cohort showed that glioma patients with high TRIM66 expression have shorter overall survival time compared with those with low TRIM66 expression, although the p-value did not reach a statistical significance (Log rank test, p=0.056, ). In addition, TCGA dataset analysis showed that TRIM66 DNA copy number in was higher in Oligodendroglioma compared with the normal brain ().
Figure 2 TRIM66 in gliomas according to Oncomine and TCGA data. (A) Analysis of Sun Brain Glioblastoma data suggested that TRIM66 mRNA was increased in glioblastoma tissues compared with normal brain tissues. (B) Analysis of Sun Brain Oligodendroglioma dataset of Oncomine showed that TRIM66 expression was higher in Oligodendroglioma compared with the normal brain. (C) Analysis of the TCGA dataset showed that glioma patients with high TRIM66 expression have shorter overall survival time compared with those with low TRIM66 expression, although the p-value did not reach a statistical significance (Log rank test, p=0.056). (D) TCGA dataset analysis showed that TRIM66 DNA copy number in was higher in Oligodendroglioma compared with the normal brain.
TRIM66 Promotes Proliferation and Invasion
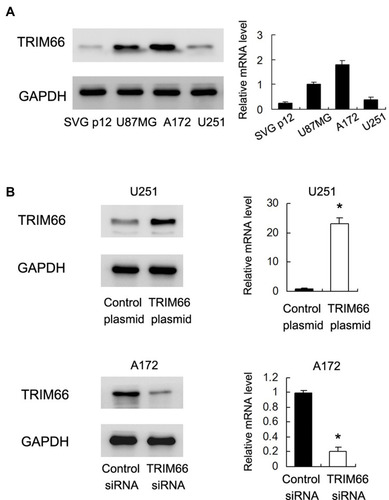
We examined protein and mRNA levels of TRIM66 in GBM cell lines U87MG, U251, A172, and normal glial cell line SVG p12. As shown in , U87 and A172 cell lines showed relatively high endogenous TRIM66 expression compared with SVG p12 cell line. To investigate the biological function of TRIM66, TRIM66 siRNA knockdown and overexpression was performed in A172 and U251 cell line, respectively. The transfection efficiencies were confirmed by Western blotting and RT-qPCR ()
Figure 3 TRIM66 expression in glioma cell lines. (A) Western blot and RT-qPCR results showed that TRIM66 protein was low in normal glial cell line SVG p12. TRIM66 showed high expression in glioblastoma cell lines U87MG and A172. (B) Transfection and siRNA knockdown efficiencies were confirmed by Western blot and RT-qPCR in U251 and A172 cells, respectively. *p<0.05.
CCK-8 assays demonstrated that TRIM66 overexpression significantly increased proliferation rate in U251 cell line while TRIM66 knockdown decreased cellular growth rate in A172 cell line (). Colony formation assays demonstrated that TRIM66 transfection significantly increased colony numbers in U251 cell line while TRIM66 knockdown decreased colony formation ability in A172 cell line (). We also evaluated the change in invasiveness after TRIM66 overexpression and knockdown. TRIM66 overexpression increased invasive ability in U251 cells while TRIM66 depletion inhibited invasion in A172 cells (). We also performed siRNA knockdown in U87MG cell line. Knockdown efficiency was confirmed using Western blot and real-time PCR (Supplementary Figure 1A). CCK-8 and colony formation assays showed that TRIM66 knockdown decreased proliferation rate and colony formation ability (Supplementary Figure 1B and C). Matrigel invasion assay showed that TRIM66 knockdown inhibited invasion in U87MG cell line (Supplementary Figure 1D). In addition, To examine the effect of TRIM66 on tumor growth in vivo, we established TRIM66 overexpressing U251 cell line by G418 selection and cells were subcutaneously injected into nude mice. As shown in Supplementary Figure 2A and B, the in vivo growth rate and tumor sizes of TRIM66 overexpressing U251 cells were much larger than control cells, suggesting TRIM66 promoted glioma growth in vivo. We also examined the change in cell cycle transition. As shown in , TRIM66 overexpression significantly increased the S phase percentage and decreased the G1 phase percentage. TRIM66 depletion decreased the S phase percentage and increased the G1 phase percentage. The above results suggested that TRIM66 regulated malignant proliferation and invasion of glioma cells.
Figure 4 TRIM66 regulates proliferation and invasion in glioma cells. (A) CCK8 assay results showed TRIM66 overexpression significantly increased proliferation rate in U251 cells while TRIM66 knockdown decreased cellular growth rate in A172 cells. (B) Colony formation assay results showed TRIM66 transfection significantly increased colony numbers in U251 cells while TRIM66 knockdown decreased colony numbers in A172 cells. (C) TRIM66 overexpression increased the numbers of invading cell number in U251 cells while TRIM66 depletion decreased the numbers of invading number in A172 cells. *p<0.05.
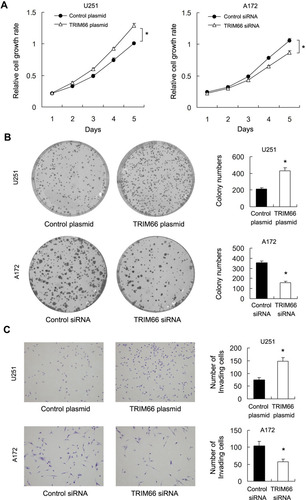
Figure 5 TRIM66 promotes cell cycle, apoptosis and mitochondrial function. (A) Flow cytometry showed that TRIM66 overexpression elevated the S phase percentage and decreased the G1 phase percentage in U251 cells. TRIM66 depletion decreased the S phase and increased the G1 phase percentage in A172 cells. (B) Annexin V/PI results showed that the TMZ-induced apoptosis rate was decreased in U251 cells transfected with TRIM66. TRIM66 depletion upregulated TMZ-induced apoptosis in A172 cells. (C) JC1 staining showed that TRIM66 siRNA increased the percentage of green fluorescence in A172 cells while TRIM66 overexpression decreased green fluorescence in U251 cells. *p<0.05.
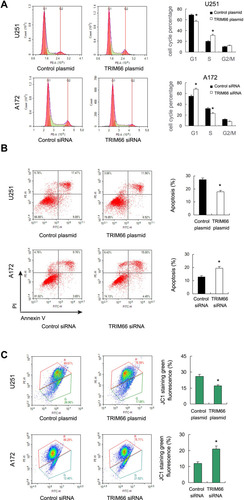
TRIM66 Regulates Temozolomide (TMZ)-Induced Apoptosis and Mitochondrial Function
We also explored the role of TRIM66 on chemo-sensitivity. According to previous studies,Citation13–Citation15 temozolomide (100μM) was used to treat glioma cells after TRIM66 plasmid and siRNA transfection. Annexin V/PI staining was used to determine the change of apoptosis. AnnexinV/PI staining showed that TRIM66 depletion upregulated the levels of TMZ-induced apoptosis after 24h of treatment. TRIM66 overexpression reduced the apoptosis rate, suggesting TRIM66 could decrease chemo-sensitivity to chemotherapeutic drugs (). In addition, TRIM66 knockdown also increased apoptosis rate in U87MG cell line (Supplementary Figure 1E).
Sensitivity to chemotherapy is often regulated by the mitochondrial apoptosis pathway, which could be reflected by mitochondrial membrane potential. Low membrane potential induces green fluorescence after JC-1 staining (). Our data showed that TRIM66 siRNA increased the percentage of green fluorescence while TRIM66 overexpression decreased green fluorescence, suggesting that TRIM66 plays an important role in maintaining normal mitochondrial membrane potential ()
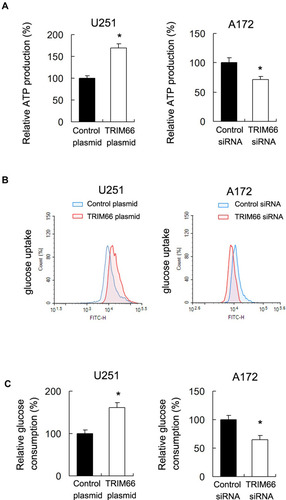
TRIM66 Regulates ATP Production and Glucose Uptake
Cancer cells use glucose metabolism to produce ATP, which is essential for the growth and development of chemoresistance. Glucose uptake is an important step in glucose metabolism. Our data showed that TRIM66 overexpression upregulated ATP levels while TRIM66 knockdown decreased ATP levels (), suggesting TRIM66 is a regulator of energy production in glioma cells. Next, we explored the change of glucose uptake and consumption. Using 2-NBDG uptake assay, we showed that TRIM66 overexpression upregulated glucose uptake while TRIM66 knockdown inhibited the level of glucose uptake (). As shown in , TRIM66 overexpression increased glucose consumption, while TRIM66 siRNA reduced it.
Figure 6 TRIM66 regulates ATP production and glucose uptake. (A) ATP production assay showed that TRIM66 overexpression upregulated ATP levels while TRIM66 knockdown decreased ATP levels. (B) 2-NBDG glucose uptake showed that TRIM66 overexpression increased glucose uptake rate in U251 cells. TRIM66 depletion downregulated glucose uptake rate in A172 cells. (C) Glucose consumption assay showed that TRIM66 overexpression increased glucose consumption in U251 cells, while TRIM66 siRNA reduced it in A172 cells. *p<0.05.
TRIM66 Regulates cMyc/GLUT3 Signaling
To find out the potential mechanism of TRIM66 activity, we screened several potentially related proteins. Using Western blot, we validated TRIM66 overexpression and downregulation on the immunoblot to confirm TRIM66 level of expression in the cells (). Our results demonstrated that TRIM66 positively regulated both cMyc and GLUT3 protein expression (). We also screened the possible change of p-AKT, p-ERK, E-cadherin, ZO-1, beta-catenin, p-c-Met after TRIM66 overexpression and knockdown. However, there was no significant change in these proteins/signaling pathways (data not shown). cMyc has been reported as a transcriptional regulator of glucose metabolism. To validate the association between cMyc and TRIM66-induced GLUT3 upregulation, cMyc siRNA was used in the U251 cell line, which was co-transfected with the TRIM66 plasmid. As shown in , cMyc knockdown downregulated protein and mRNA levels of GLUT3. cMyc depletion abolished the effect of TRIM66 on GLUT3 upregulation.
Figure 7 TRIM66 regulates GLUT3 through cMyc. (A) Western blot results showed that TRIM66 overexpression upregulated TRIM66, GLUT3, and cMyc protein while TRIM66 siRNA knockdown downregulated TRIM66, GLUT3 and cMyc protein. (B) cMyc siRNA was transfected with TRIM66 plasmid. cMyc siRNA significantly decreased the expression of cMyc and GLUT3. In cells transfected with cMyc siRNA, the effect of TRIM66 overexpression on GLUT3 protein and mRNA was significantly ameliorated. (C) Prediction of cMyc binding sites on SLC2A3/GLUT3 promoter by JASPAR database analysis. ChIP assay showed that cMyc could bind to the SLC2A3/GLUT3 promoter region. *p<0.05.
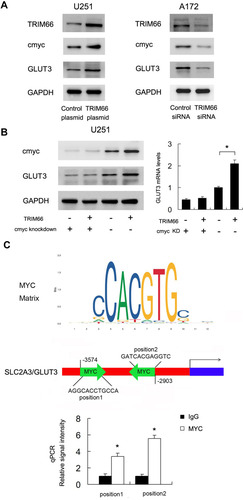
We also investigated if cMyc regulated SLC2A3/GLUT3 gene by binding to its promoter in glioma cells. The cMyc matrix and potential binding sites on the SLC2A3/GLUT3 promoter were predicted by JASPAR (). Binding of cMyc to SLC2A3/GLUT3 promoter was examined using ChIP assays followed by qPCR assay (). These results suggested that TRIM66 transcriptional regulated SLC2A3/GLUT3 through cMyc in glioma cells.
Discussion
Growing evidence showed elevated expression of TRIM66 protein in various cancers. TRIM66 overexpression contributes to osteosarcoma carcinogenesis and indicates poor survival outcomes.Citation16 TRIM66 expression is upregulated in hepatocellular carcinoma and confers tumorigenicity by regulating GSK3 Wnt signaling.Citation8 TRIM66 is overexpressed in NSCLC patients and serves as a prognostic marker.Citation17 Knockdown of TRIM66 inhibits malignant behavior and epithelial–mesenchymal transition in NSCLC cells.Citation18 TRIM66 knockdown inhibits tumor growth by regulating JAK2/STAT3 signaling in colorectal cancer cells.Citation19 However, the expression pattern and potential mechanism of TRIM66 in glioma remain unexplored. In the present study, we demonstrated that TRIM66 was upregulated in 54.7% of glioma and correlated with the higher grade, which was supported by data from the Oncomine database, indicating the potential use of TRIM66 as a clinical indicator of the malignant feature.
TRIM66 has been implicated in a variety of oncogenic processes. CCK-8 and colony formation assays confirmed that ectopically expressed TRIM66 stimulated proliferation, invasion, cell cycle transition. TRIM66 depletion showed the opposite results. The data indicate TRIM66 plays important role in the malignant proliferation of glioma. Furthermore, our data confirmed that TRIM66 overexpression decreased TMZ sensitivity and reduced apoptosis. Mitochondrial function plays an important role in regulating chemo-sensitivity.Citation20 We further showed that TRIM66 was able to maintain mitochondrial membrane potential after TMZ treatment, suggesting TRIM66 could protect mitochondrial function.
Many cancers have long been thought to primarily metabolize glucose for energy production. Both proliferation and chemoresistance in tumor cells rely on energy supply and glucose uptake is the initial step during the process.Citation21,Citation22 Our results showed that increased TRIM66 overexpression increased glucose uptake, consumption, and ATP production in glioma cells, indicating that TRIM66 serves as a positive regulator of glucose metabolism. Growing evidence indicates that glucose metabolism plays an important role in the development and growth of glioma.Citation23 Malignant cells are highly dependent on glycolysis for ATP generation, known as the Warburg effect in which withdrawal of glucose resulted in apoptosis of glioma cells.Citation24 In addition, many report has shown that ATP provided by glycolysis is essential for the development of chemoresistanceCitation25 and inhibition of glucose metabolism increased apoptosis in glioma cells.Citation24,Citation26 In addition, recent reports showed key regulators of glucose metabolism could control invasion phenotype of glioma cells.Citation27,Citation28 Based on these reports and our results, the positive regulation of TRIM66 on glucose metabolism/ATP production might contribute to its biological roles such as promoting proliferation, invasion and inhibiting apoptosis. Our findings linked the role of TRIM66 on glucose metabolism to its biological functions, which has not been previously reported.
Upregulation of glucose metabolic enzymes plays an important role in elevated glucose consumption and ATP production of cancer cells.Citation29,Citation30 After screening several glucose metabolic-related enzymes we found that TRIM66 induced GLUT3 protein, which was an important glucose transporter during the glucose uptake process.Citation31 The involvement of GLUT3 in glioma progression has been previously reported.Citation32,Citation33 GLUT3 is overexpressed in glioma and correlates with pathological grade.Citation34 GLUT3 upregulation promotes metabolic reprogramming associated with antiangiogenic therapy resistance in glioblastomas.Citation35 A recent study showed that GLUT3 is a druggable target in a subpopulation of glioblastoma.Citation32 Thus, TRIM66 might regulate glucose metabolism through GLUT3 in glioma.
We also found that TRIM66 upregulated cMyc protein expression. cMyc is an important malignant biomarker in glioma and regulates various biological processes such as apoptotic cell death, proliferation, survival, differentiation.Citation12,Citation36,Citation37 cMyc is also required for the maintenance of glioma cancer stem cells.Citation38 It has been reported that cMyc could regulate glucose metabolism by activating transcription of related genes.Citation39 Using cMyc siRNA knockdown, we were able to show that cMyc could mediate TRIM66-induced GLUT3 upregulation. This was further supported by ChIP data that cMyc is directly bound to the GLUT3 promoter in glioma cells. Together, these findings showed a strong link among TRIM66, cMyc, and GLUT3 in glioma cells.
In summary, our results reveal that TRIM66 is overexpressed in human glioma. Our data provide evidence that TRIM66 overexpression in glioma plays an important role in proliferation, apoptosis, and glucose uptake, possibly by regulating cMyc/GLUT3 signaling. TRIM66 might function as a novel therapeutic target in gliomas.
Disclosure
The authors declare that they have no competing interests.
Acknowledgments
The present study was funded by Science Research Foundation of Liaoning Provincial Department of Education (FWZR2020015).
References
- Siegel R, Naishadham D, Jemal A. Cancer statistics, 2012. CA Cancer J Clin. 2012;62(1):10–29. doi:10.3322/caac.2013822237781
- Krupkova O, Loja T, Redova M, et al. Analysis of nuclear nestin localization in cell lines derived from neurogenic tumors. Tumour Biol. 2011;32(4):631–639. doi:10.1007/s13277-011-0162-921340483
- Zadran S, Amighi A, Otiniano E, Wong K, Zadran H. ENTPD5-mediated modulation of ATP results in altered metabolism and decreased survival in gliomablastoma multiforme. Tumour Biol. 2012;33(6):2411–2421. doi:10.1007/s13277-012-0505-122992974
- Hatakeyama S. TRIM family proteins: roles in autophagy, immunity, and carcinogenesis. Trends Biochem Sci. 2017;42(4):297–311. doi:10.1016/j.tibs.2017.01.00228118948
- Hatakeyama S. TRIM proteins and cancer. Nat Rev Cancer. 2011;11(11):792–804. doi:10.1038/nrc313921979307
- Jaworska AM, Wlodarczyk NA, Mackiewicz A, Czerwinska P. The role of TRIM family proteins in the regulation of cancer stem cell self-renewal. Stem Cells. 2020;38(2):165–173. doi:10.1002/stem.310931664748
- McAvera RM, Crawford LJ. TIF1 proteins in genome stability and cancer. Cancers. 2020;12(8):2094. doi:10.3390/cancers12082094
- Fan W, Du F, Liu X. TRIM66 confers tumorigenicity of hepatocellular carcinoma cells by regulating GSK-3beta-dependent Wnt/beta-catenin signaling. Eur J Pharmacol. 2019;850:109–117. doi:10.1016/j.ejphar.2019.01.05430710548
- Cao H, Gao R, Chen L, Feng Y. TRIM66 promotes malignant progression of prostate carcinoma through the JAK/STAT pathway. FEBS Open Bio. 2020;10:515–524. doi:10.1002/2211-5463.12798
- Remmele W, Stegner HE. [Recommendation for uniform definition of an immunoreactive score (IRS) for immunohistochemical estrogen receptor detection (ER-ICA) in breast cancer tissue]. Der Pathologe. 1987;8(3):138–140. German.3303008
- Fedchenko N, Reifenrath J. Different approaches for interpretation and reporting of immunohistochemistry analysis results in the bone tissue - a review. Diagn Pathol. 2014;9:221. doi:10.1186/s13000-014-0221-925432701
- Annibali D, Whitfield JR, Favuzzi E, et al. Myc inhibition is effective against glioma and reveals a role for Myc in proficient mitosis. Nat Commun. 2014;5:4632. doi:10.1038/ncomms563225130259
- Plummer S, Wallace S, Ball G, et al. A human iPSC-derived 3D platform using primary brain cancer cells to study drug development and personalized medicine. Sci Rep. 2019;9(1):1407. doi:10.1038/s41598-018-38130-030723234
- Lee SY. Temozolomide resistance in glioblastoma multiforme. Genes Dis. 2016;3(3):198–210. doi:10.1016/j.gendis.2016.04.00730258889
- Agnihotri S, Burrell K, Buczkowicz P, et al. ATM regulates 3-methylpurine-DNA glycosylase and promotes therapeutic resistance to alkylating agents. Cancer Discov. 2014;4(10):1198–1213. doi:10.1158/2159-8290.CD-14-015725100205
- Chen Y, Guo Y, Yang H, et al. TRIM66 overexpresssion contributes to osteosarcoma carcinogenesis and indicates poor survival outcome. Oncotarget. 2015;6(27):23708–23719. doi:10.18632/oncotarget.429126247633
- Ma Y, Dai HY, Zhang F, Zhao D. TRIM66 expression in non-small cell lung cancer: a new predictor of prognosis. Cancer Biomark. 2017;20(3):309–315. doi:10.3233/CBM-17020728946563
- Dai HY, Ma Y, Da Z, Hou XM. Knockdown of TRIM66 inhibits malignant behavior and epithelial-mesenchymal transition in non-small cell lung cancer. Pathol Res Pract. 2018;214(8):1130–1135. doi:10.1016/j.prp.2018.06.00829929749
- He T, Cui J, Wu Y, Sun X, Chen N. Knockdown of TRIM66 inhibits cell proliferation, migration and invasion in colorectal cancer through JAK2/STAT3 pathway. Life Sci. 2019;235:116799. doi:10.1016/j.lfs.2019.11679931472144
- Fu L, Dong Q, He J, et al. SIRT4 inhibits malignancy progression of NSCLCs, through mitochondrial dynamics mediated by the ERK-Drp1 pathway. Oncogene. 2017;36(19):2724–2736. doi:10.1038/onc.2016.42527941873
- Vander Heiden MG, Cantley LC, Thompson CB. Understanding the Warburg effect: the metabolic requirements of cell proliferation. Science. 2009;324(5930):1029–1033. doi:10.1126/science.116080919460998
- Xu M, Chen S, Yang W, et al. FGFR4 links glucose metabolism and chemotherapy resistance in breast cancer. Cell Physiol Biochem. 2018;47(1):151–160. doi:10.1159/00048975929763898
- Bao Z, Chen K, Krepel S, et al. High glucose promotes human glioblastoma cell growth by increasing the expression and function of chemoattractant and growth factor receptors. Transl Oncol. 2019;12(9):1155–1163. doi:10.1016/j.tranon.2019.04.01631207546
- Jelluma N, Yang X, Stokoe D, Evan GI, Dansen TB, Haas-Kogan DA. Glucose withdrawal induces oxidative stress followed by apoptosis in glioblastoma cells but not in normal human astrocytes. Mol Cancer Res. 2006;4(5):319–330. doi:10.1158/1541-7786.MCR-05-006116687487
- Wang T, Ning K, Sun X, Zhang C, Jin LF, Hua D. Glycolysis is essential for chemoresistance induced by transient receptor potential channel C5 in colorectal cancer. BMC Cancer. 2018;18(1):207. doi:10.1186/s12885-018-4123-129463225
- Atif F, Yousuf S, Espinosa-Garcia C, Sergeeva E, Stein DG. Progesterone treatment attenuates glycolytic metabolism and induces senescence in glioblastoma. Sci Rep. 2019;9(1):988. doi:10.1038/s41598-018-37399-530700763
- Miyai M, Kanayama T, Hyodo F, et al. Glucose transporter Glut1 controls diffuse invasion phenotype with perineuronal satellitosis in diffuse glioma microenvironment. Neuro Oncol Adv. 2021;3(1):vdaa150. doi:10.1093/noajnl/vdaa150
- Abbadi S, Rodarte JJ, Abutaleb A, et al. Glucose-6-phosphatase is a key metabolic regulator of glioblastoma invasion. Mol Cancer Res. 2014;12(11):1547–1559. doi:10.1158/1541-7786.MCR-14-0106-T25001192
- Cho H, Lee YS, Kim J, Chung JY, Kim JH. Overexpression of glucose transporter-1 (GLUT-1) predicts poor prognosis in epithelial ovarian cancer. Cancer Invest. 2013;31(9):607–615. doi:10.3109/07357907.2013.84972224164300
- Brown RS, Wahl RL. Overexpression of Glut-1 glucose transporter in human breast cancer. An immunohistochemical study. Cancer. 1993;72(10):2979–2985. doi:10.1002/1097-0142(19931115)72:10<2979::AID-CNCR2820721020>3.0.CO;2-X8221565
- Barron CC, Bilan PJ, Tsakiridis T, Tsiani E. Facilitative glucose transporters: implications for cancer detection, prognosis and treatment. Metabolism. 2016;65(2):124–139. doi:10.1016/j.metabol.2015.10.00726773935
- Cosset E, Ilmjarv S, Dutoit V, et al. Glut3 addiction is a druggable vulnerability for a molecularly defined subpopulation of glioblastoma. Cancer Cell. 2017;32(6):856–868 e855. doi:10.1016/j.ccell.2017.10.01629198914
- Zheng C, Yang K, Zhang M, et al. Specific protein 1 depletion attenuates glucose uptake and proliferation of human glioma cells by regulating GLUT3 expression. Oncol Lett. 2016;12(1):125–131. doi:10.3892/ol.2016.459927347112
- Liu Y, Li YM, Tian RF, et al. The expression and significance of HIF-1alpha and GLUT-3 in glioma. Brain Res. 2009;1304:149–154. doi:10.1016/j.brainres.2009.09.08319782666
- Kuang R, Jahangiri A, Mascharak S, et al. GLUT3 upregulation promotes metabolic reprogramming associated with antiangiogenic therapy resistance. JCI Insight. 2017;2(2):e88815. doi:10.1172/jci.insight.8881528138554
- Ashrafizadeh M, Zarabi A, Hushmandi K, et al. C-Myc signaling pathway in treatment and prevention of brain tumors. Curr Cancer Drug Targets. 2020;20:104–114. doi:10.2174/156800961966619102310004631657687
- Shervington A, Cruickshanks N, Wright H, et al. Glioma: what is the role of c-Myc, hsp90 and telomerase? Mol Cell Biochem. 2006;283(1–2):1–9. doi:10.1007/s11010-006-2495-z16444580
- Wang J, Wang H, Li Z, et al. c-Myc is required for maintenance of glioma cancer stem cells. PLoS One. 2008;3(11):e3769. doi:10.1371/journal.pone.000376919020659
- Osthus RC, Shim H, Kim S, et al. Deregulation of glucose transporter 1 and glycolytic gene expression by c-Myc. J Biol Chem. 2000;275(29):21797–21800. doi:10.1074/jbc.C00002320010823814