
Abstract
Background
Obesity is defined as a chronic, low-grade inflammatory disease that can cause obesity-associated disorders, such as cancer. Obesity has traditionally been thought to be a risk factor for ovarian cancer. Few reports have focused on the specific pathogenesis of obesity-related ovarian cancer. When considering the correlation between obesity and the relative risk of death from ovarian cancer, we investigated whether obesity promotes tumor immune escape in ovarian cancer.
Results
In the present study, obese mice were found to have higher rates of tumor growth and tumor infiltration than mice of normal weight. Obesity increased the proportion of myeloid-derived suppressor cells (MDSCs) in peripheral blood compared with mice of normal weight. In addition, the levels of CCL25, CD40L, GM-CSF, IL-5, IGFBP2, IL-6, MMP3, and MMP9 in the peripheral blood, bone marrow, and ovarian tissue of obese mice were higher than in mice of normal weight. Moreover, IL-5 and IL-6 significantly enhanced the expression levels of S100A8 and S100A9 in MDSCs. When compared with the levels in mice of normal weight, the expression levels of S100A8 and S100A9 in the MDSCs of OB/OB mice were also higher within the tumor microenvironment. The infiltration of MDSCs in ovarian cancer was found to be positively correlated with the expression levels of IL-6. The IL-6 expression levels in ovarian cancer tissue are positively correlated with the expression levels of S100A8 and S100A9, which is consistent with the results of previous animal experiments. Finally, we found that LMT28 can suppress the tumor growth by inhibiting IL-6.
Conclusion
Obesity promotes the expression of the MDSC-related immunosuppressive genes S100A8 and S100A9 by upregulating IL-6, thus promoting tumor immune evasion and metastasis in ovarian cancer.
Keywords:
Introduction
Ovarian cancer is the most malignant type of cancer; it has the highest mortality rate among gynecological tumors and seriously threatens the lives and health of women. Ovarian cancer patients are rarely diagnosed at early time points; additionally, they have poor prognosis and suffer frequent recurrence. Furthermore, there were 22,530 new cases and 13,980 deaths from ovarian cancer in the United States in 2019.Citation1 More than 70% of patients diagnosed with ovarian cancer are in the late stages of the disease, and this constitutes the principal cause of the high rate of mortality.Citation2
Obesity represents a major global health problem. The incidence of overweight and obesity-related cancers has globally increased over the past decades. Studies have indicated that obesity is related to the development of a variety of malignant tumors, including ovarian cancer.Citation3 However, the mechanism by which obesity promotes the occurrence of ovarian cancer is not fully understood; therefore, additional studies are required to explore the mechanism by which obesity promotes its occurrence.
Myeloid-derived suppressor cells (MDSCs) are immature cells with powerful immunosuppressive functions that are elicited in abnormal conditions, such as during acute or chronic inflammation, trauma, and tumor formation.Citation4 The mechanisms of MDSC-mediated immune suppression include the activation of regulatory T-cells, increased expression of the immune-suppressive cytokines transforming growth factor β (TGF-β) and interleukin 10 (IL-10), the sequestration of cysteine, and decreased expression levels of L-selectin by T-cells, among other mechanisms.Citation5 Studies have also demonstrated that MDSCs can enhance gene expression in ovarian cancer stem cells and promote tumor formation and metastasis.Citation6 Previous studies have also found that the frequency of MDSCs is significantly increased in obese individuals; however, the question of whether obesity promotes the occurrence of ovarian cancer by promoting the generation of MDSCs has not been studied.
Methods
Ethics Approval and Consent to Participate
This study received approval from the Ethics Committee of Tongji University Laboratory Animal Resources Agency (Approve number: TJAB05720101). Significant efforts were made to minimize both the number of animals and their suffering. All of the procedures were strictly conducted in conformity to the International Code of Ethics in Laboratory Animals and national regulations.
Animals and Cells
Animals: Female C57BL/6J mice (4–6-weeks-old) and female BALB/c nude mice (4–6-weeks-old) were purchased from Slac Laboratory Animals (Shanghai). Female OB/OB mice (4-weeks-old) were purchased from Gempharmatech Co., Ltd. (Jiangsu) and housed in specific pathogen-free (SPF) conditions within the Tongji University School (Shanghai). All of the animal experimental protocols were approved by the University Laboratory Animal Resources Agency.
Cell lines: The mouse EOC cell line ID8 was obtained from FuHeng Bio at 2015 (FuHeng Cell Center; FH1075). The ID8 cell line was cultured in high-glucose Dulbecco’s modified Eagle medium (DMEM, Gibco, BJ, China) supplemented with 10% fetal bovine serum (FBS, Gibco, BJ, China) and 1% streptomycin/penicillin (Gibco, BJ, China) at 37 °C in a humidified atmosphere containing 5% CO2.
Mouse Model
For the diet-induced obesity (DIO) model, 5-week-old female C57BL/6J mice were fed a high-fat (HF; 60% kcal, Beijing HFK Bioscience Co., Ltd) or low-fat (LF; 10% kcal, Jiangsu Xietong Pharmaceutical Bioengineering Co., Ltd) irradiated rodent diet for 18 weeks to establish the DIO model. Weight was monitored once per week. After the DIO model was established, the mice were injected with tumor cells or euthanized for the analysis of MDSCs in the peripheral blood by using flow cytometry.
For the OB/OB model, 4-week-old female OB/OB mice were fed a low-fat (LF; 10% kcal)-irradiated rodent diet. In these mice, weight gain was due to a homozygous mutation in the leptin (Lep) gene, which resulted in overeating and rapid weight gain. Weight was monitored once per week starting at 5-weeks-old. After the weight of the mice reached > 40 g, the mice were injected with tumor cells or euthanized for the analysis of MDSCs in the peripheral blood by using flow cytometry.
For the Balb/c obesity-resistant model, 5-week-old WT Balb/c mice were fed either a HF or LF diet for 18 weeks. Balb/c mice did not gain weight even when fed a HF diet. The mice were euthanized after 18 weeks for the analysis of MDSCs in the peripheral blood by using flow cytometry.
In vivo Experiments
Mice were administered 5×10⁶ ID8-Luc-pur cells in 0.5 mL phosphate buffered saline (PBS) (Gibco, BJ, China) by using intraperitoneal injections. D-luciferin (100 mg/kg) (Gold Bio, US) was used to detect the expression of Luc, which indicated tumors in the DIO model mice. Tumor progression was evaluated by capturing images with the use of a NightOWL II LB 983 in vivo imaging system twice per week or once a week. IndiGo software was used for the image analysis. The peritoneum, diaphragm, and mesentery were harvested from mice and preserved by using formalin fixation and paraffin embedding (FFPE) at the time of sacrifice. The endpoint of the experiment was death due to the effects of the tumor.
Two group OB/OB mice were used to confirm the role of IL-6 in obesity-mediated ovarian cancer metastasis. LMT28 (MCE, SH, China) as an IL-6 inhibitor was used in the experiment. LMT28 (5mg/kg) in 100 μL normal saline (group LMT28) and 100 μL normal saline (group Ctrl) was injected intraperitoneally every day after mice were administered 5×10⁶ ID8-Luc-pur cells.
Flow Cytometry
Blood was collected from the mice via the orbital vein and subsequently centrifuged at low speed to ensure that the complete sample was at the bottom of the tube. A total of 100 μL of whole blood was tested in each sample. Red cell lysate (Biogems, WV, CA) was added, and tubes were centrifuged immediately at 1500 rpm/min for 5 minutes. The cells were incubated with the appropriate conjugated antibody at 4 °C for 5 minutes prior to analysis. Mouse MDSCs were defined as Cd11b+Ly-6G+ cells.
ELISA
Mouse C-C motif chemokine ligand 25 (CCL25), CD40 ligand (CD40L), granulocyte-macrophage colony-stimulating factor (GM-CSF), interleukin 5(IL-5), insulin like growth factor binding protein 2(IGFBP2), interleukin 6(IL-6), matrix metallopeptidase 3(MMP3), and matrix metallopeptidase 9(MMP9) ELISA kits (MEXN, SH, China) were used to measure the expression levels of CCL25, CD40L, GM-CSF, IL-5, IGFBP2, IL-6, MMP3, and MMP9, respectively, in the peripheral blood, bone marrow and ovarian tissue of mice in the different groups (in accordance with the manufacturer’s instructions). The optical density of each well was measured by using a microplate reader at a wavelength of 450 nm.
Quantitative Real Time PCR (qRT–PCR) Analysis
Total RNA was extracted by using the RNAiso reagent (Takara, DL, China), in accordance with the manufacturer’s instructions. cDNA was synthesized by using a PrimeScript RT reagent kit (Takara, DL, China). qRT–PCR analysis was performed by using SYBR Green qPCR Master Mix (Bio–Rad, SH, China). Mouse S100 calcium binding protein A8 (S100A8) and S100 calcium binding protein A9 (S100A9), and β-actin (the internal control) expression levels were quantified. Primer sequences are detailed in Table S1 of the Supporting Information.
Analysis of Ovarian Cancer in the TCGA Database
The tumor-immune system interactions database (TISIDB, cis.hku.hk/TISIDB/), which is an integrated repository web portal, was used to validate the association between IL-6 and the infiltration of MDSCs in ovarian cancer. The results were measured by using a Spearman correlation analysis (P < 0.05). The cBioPortal for Cancer Genomics (http://cbioportal.org), which is used to explore, visualize, and analyze multidimensional cancer genomics data,Citation7 was used to determine gene co-expression relationships in ovarian cancer based on data from the TCGA database. The significance of gene co-expression in ovarian cancer was calculated by using a Spearman correlation analysis (P < 0.05).
Statistical Analysis
Data were analyzed by using GraphPad Prism 7 software for Windows. Student’s t-tests were used to determine the significance of the differences. Data are presented as means ± s.d. The following P values (*P < 0.05; **P < 0.01; and ***P < 0.001) were considered to be statistically significant.
Results
Obesity Promotes Tumor Progression and Metastasis in Ovarian Cancer
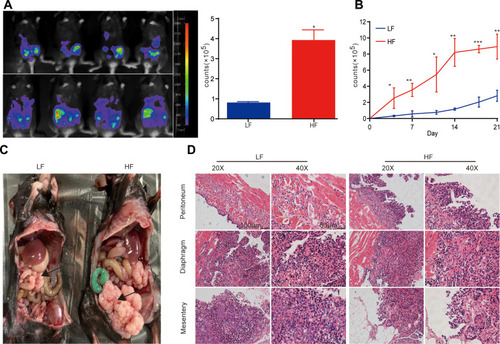
To explore the effect of obesity on the development of ovarian cancer, a ID8 cell line was used to establish a metastasizing ovarian cancer C57BL/6 model, in order to observe ovarian cancer growth and metastasis. After the injection of ID8-Luc-pur cells, tumor growth was observed twice a week until death by using a bioluminescence imaging system. After tumor cells were injected into the peritoneal cavity of the mice, fluorescent signals from the tumor cells could be detected in the organs of the mice. The intensity of the bioluminescent signal depended on the tumor load. The HF group exhibited an enhanced tumor load after week 3, compared with the LF group (). Furthermore, tumor load in the HF group increased more rapidly than that in the LF group (). The peritoneum, diaphragm, and mesentery displayed greater degrees of tumor invasion in the HF group (). In addition, the presence of tumors was confirmed via haematoxylin-eosin (H&E) staining (). The results demonstrated that the presence of obesity promoted tumor growth in vivo.
Figure 1 Obesity promotes tumor progression and metastasis of ovarian cancer. (A) The tumor flux (counts) was observed twice per week using a bioluminescence imaging system. The first week was defined as days 1 to 8. Fluorescent intensity (counts) from tumors in the two groups was compared at week 3 (n = 3 mice/per group); t-test. (B) Fluorescent intensity (counts) in the two groups was compared during weeks 1–3 twice per week (n = 3 mice/per group); t-test. (C) Typical images of mice from the two groups displaying tumors in the enterocoelia. (D) H&E staining of the peritoneum, diaphragm, and mesentery tissue in the two groups. *P < 0.05, **P < 0.01, ***P < 0.001.
Obesity Upregulates the Proportion of MDSCs in the Peripheral Blood of Mice
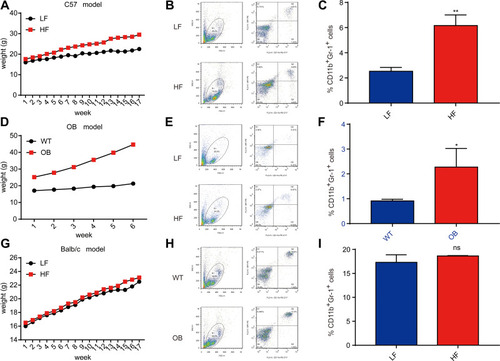
The DIO model was used to investigate the effects of obesity on MDSCs. Wild-type (WT) C57BL/6 female mice were fed either a high-fat (HF; 60% kcal) or low-fat (LF; 10% kcal) diet for 18 weeks, followed by a flow cytometric analysis. When compared with the LF group, the HF group exhibited an elevated proportion of CD11b + Gr1+ myeloid cells (∼1.36–6.85% of total cells) (–). To establish whether the increase in MDSCs in the peripheral blood was due to high levels of adiposity or the content of the diet, OB/OB and BALB/c models were used. The OB/OB model of obesity was initially studied. The mice were fed a low-fat diet and displayed rapid weight gain () due to leptin deficiency. An elevated proportion of MDSCs was observed in the peripheral blood, as demonstrated by flow cytometry (). A BALB/c model of obesity resistance was used in a reciprocal experiment. WT BALB/c mice did not gain weight when fed either a HF or LF diet for 18 weeks (). Unlike the majority of other mouse strains, BALB/c mice exhibit an inherently obesity-resistant phenotype. There was no significant difference in the proportion of MDSCs between the two diets (), in contrast to the DIO or OB/OB mice. The previously described data indicate that the increase in MDSCs in the peripheral blood is due to the high adiposity of obese mice rather than due to the nutrient content of the diet.
Figure 2 Obesity upregulates the proportion of MDSC in peripheral blood in mice. (A) Weight curves in DIO model mice. Five-week-old female BL6 mice were fed an LF or HF diet for 18 weeks. n=5 mice per group; means ± s.e.m. (B) Representative flow cytometry plots of myeloid-derived suppressor cells (MDSCs) from peripheral blood. (C) Flow cytometry plots of MDSCs in peripheral blood in the DIO model after 18 weeks. n=5 mice per group. (D) Weight curves in OB/OB model mice. Female OB/OB or wild-type (WT) mice were fed a normal diet until a predefined weight endpoint of >40g. n=5 mice per group; means ± s.e.m. (E) Representative flow cytometry plots, as displayed in (B). (F) Flow cytometry plots of MDSCs in peripheral blood in the Ob/Ob model after 6 weeks. n=5 mice per group. (G) Weight curves for Balb/c model mice. Five-week-old female Balb/c mice were fed an LF or HF diet for 18 weeks. n=5 mice per group; means ± s.e.m. (H) Representative flow cytometry plots, as displayed in (B). (I) Flow cytometry of MDSCs in peripheral blood in Balb/c model mice after 18 weeks. n=5 mice per group. t test, *P < 0.05, **P < 0.01.
Obesity Upregulates Cytokine Levels in Peripheral Blood, Bone Marrow, and Ovaries of Mice
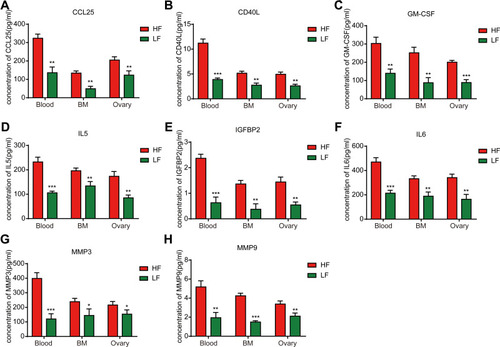
Afterwards, we wished to establish potential regulators of MDSC elevation in the peripheral blood due to obesity. We hypothesized that circulating factors may be involved in regulating the numbers of MDSCs. Previous studies have demonstrated that 8 factors are elevated in both humans and mice; namely, CCL25, CD40L, GM-CSF, IL-5, IGFBP2, IL-6, MMP3, and MMP98.Citation8 The expression of these factors was measured in the peripheral blood, bone marrow, and ovarian tissue of mice by using ELISA. The results confirmed that the expression levels of CCL25, CD40 L, GM-CSF, IL-5, IGFBP2, IL-6, MMP3, and MMP9 were significantly higher in the peripheral blood, bone marrow, and ovaries of HF mice than in those of LF mice (–). In summary, the expression levels of CCL25, CD40L, GM-CSF, IGFBP2, IL-5, IL-6, MMP-3, and MMP-9 were shown to be significantly increased in the peripheral blood, bone marrow, and ovaries of obese mice. These data indicate that obesity upregulates the expression of cytokines in the circulatory systems and target organs of mice and promotes the immunosuppressive function of MDSCs, thus promoting the development of ovarian cancer.
Figure 3 Obesity upregulates cytokine levels in peripheral blood, bone marrow, and ovarian tissue in mice. ELISA analyses of the cytokine expression: (A) CCL25, (B) CD40L, (C) GM-CSF, (D) IL-5, (E) IGFBP2, (F) IL-6, (G) MMP3, (H) MMP9. t-test, *P < 0.05, **P < 0.01, ***P < 0.001.
Obesity Enhances MDSC Immune Suppression by IL-6 in the Tumor Microenvironment
We investigated whether obesity affects the capability of MDSCs to exhibit immune suppression in the tumor microenvironment. We hypothesized that obesity would enhance immune suppression via MDSCs. First, we established that the expression levels of S100A8 and S100A9 in MDSCs in OB/OB mice were higher in the tumor microenvironment than in mice of a normal weight (). Afterwards, we investigated the relationship between S100A8 and S100A9 and the upregulated cytokines. We found that recombinant proteins of IL-5 and IL-6 upregulated the expression levels of S100A8 and S100A9 in MDSCs in vitro (). TISIDB was used to validate the association between IL-6 and the MDSCs. The results indicated that the infiltration of MDSCs in ovarian cancer was positively correlated with IL-6 (). Finally, the cBioPortal website was used to analyze gene co-expression in ovarian cancer patients. The results demonstrated that the expression levels of IL-6 in ovarian cancer tissue were also positively correlated with the expression levels of S100A8 and S100A9, which is consistent with the results of previous animal experiments (–). Thus, in both mice and humans, obesity enhanced MDSCs immune suppression by upregulating IL-6 in ovarian cancer.
Figure 4 Obesity can enhance MDSC immune suppression via IL-6 in the tumor microenvironment. (A and B) Quantitative real-time PCR analysis of S100A8 and S100A9 expression in MDSCs from the bone marrow of different groups, t test. *P < 0.05, **P < 0.01, ***P < 0.001. (C) Relationship between MDSCs and IL-6. The relationship between S100A8, S100A9 and cytokines: (D) IL-5, (E) IL-6. (F) Fluorescent intensity (counts) from tumors in the two groups was compared at week 6 (n = 3 mice/per group); t-test. (G) Fluorescent intensity (counts) in the two groups was compared during weeks 1–6 (n = 3 mice/per group); t-test. (H) H&E staining of the peritoneum, diaphragm, and mesentery tissue in the two groups. *P < 0.05, **P < 0.01, ***P < 0.001.
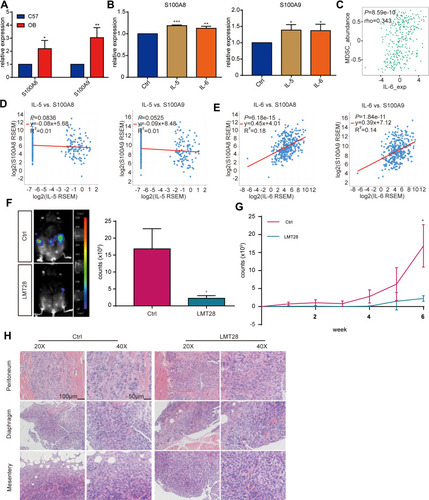
Furthermore, we used LMT28 to confirm the role of IL-6 in obesity-mediated ovarian cancer metastasis by building a metastasizing ovarian cancer OB/OB mice model. The LMT28 group exhibited an attenuated tumor load after week 6, compared with the Ctrl group (). Furthermore, tumor load in the LMT28 group increased more slower than that in the Ctrl group (). In addition, the presence of tumors was confirmed via haematoxylin-eosin (H&E) staining (). The results demonstrated that the IL-6 did promote tumor growth in obese mice in vivo while LMT28 attenuated its effect.
Discussion
Ovarian cancer elicits the greatest mortality for female reproductive system malignant tumors throughout the world. Ovarian cancer is usually diagnosed at an advanced stage, as the early stages of the disease have no apparent symptoms; additionally, to date, the efficacy of screening has not been demonstrated in prospective randomized controlled trials. Therefore, the identification of risk factors for ovarian cancer is of great importance in reducing its lethality. We found that obesity promotes tumor progression and metastasis in ovarian cancer.
When compared with the tumor volume in the control group, the tumor volume was found to more rapidly increase in obese mice. Studies have shown that obesity can promote tumor progression via inflammation, changes in microenvironmental fat in local and circulatory metabolism, and inflammatory mediators that are associated with fat inflammation.Citation9 Moreover, adipose tissue not only stores fat, but also acts as an endocrine organ that is able to overproduce the proinflammatory cytokines tumor necrosis factor (TNF), C-C motif chemokine ligand (CCL-2), and interleukin 4(IL-4), thus inducing chronic inflammation, which is believed to be a principal mechanism in ovarian cancer.Citation10 However, the mechanism of obesity and the occurrence of ovarian cancer have not been clarified. Our data indicate that obesity can indeed promote the progression and metastasis of ovarian cancer.
By using the DIO model, the proportion of MDSCs in the peripheral blood was found to be higher in obese mice. MDSCs appear to play an important role in promoting ovarian cancer cell proliferation. MDSCs are a type of immature immunosuppressive cell that is produced under abnormal conditions and are concentrated in the blood, lymph, bone marrow, and other tissues, and they possess strong immunosuppressive properties. MDSCs can suppress anti-tumor immunity through a variety of mechanisms, such as via the prevention of activation signals in CD4+ and CD8+ T-cells through the amino acid metabolic pathway;Citation11,Citation12 the inhibition of T-cell activation via the production of ROS or PD-L1;Citation13,Citation14 and the secretion of immunosuppressive factors (TGF-β, IL-10, and interleukin 12 (IL-12), among other factors),Citation15,Citation16 thus allowing tumor cells to escape immune surveillance and attack the host, as well as the promotion of tumor progression. In addition, we also found that obesity upregulates the expression levels of CCL25, CD40L, GM-CSF, IGFBP2, IL-5, IL-6, MMP-3, and MMP-9 in the blood, bone marrow, and ovaries in mice. CCL25 promotes the metastasis and invasion of ovarian cancer by interacting with C-C motif chemokine receptor 9(CCR9) produced by ovarian cancer cells.Citation17 Moreover, GM-CSF directly promotes the proliferation of tumor cells.Citation18 Furthermore, IL-5 can induce chemotaxis, and the activation of integrin CD11bCitation19 and IL-6 reduces T-cell activation, thus stimulating proliferation and metastasis in ovarian cancer.Citation20,Citation21 The MMP family causes the degradation of the extracellular matrix and participates in tumor-related angiogenesis.Citation22
Next, we found that expression level of immunosuppressive associated genes in MDSCs, including S100A8 and S100A9 were upregulated in OB/OB mice in the tumor microenvironment. And S100A8 and S100A9 can also be upregulated by IL-5 and IL-6 in vitro. Further, we found that the expression level of S100A8 and S100A9 in ovarian cancer tissue were positively correlated with those of IL-6, as displayed in the TCGA database. And the infiltration of MDSCs in ovarian cancer was positively correlated with the expression level of IL-6. Previous studies have shown that the majority of obese patients present a reduced release of the anti-inflammatory adipokine adiponectin and an increased release of the pro-inflammatory adipokine leptin. Moreover, a shift from the M2 anti-inflammatory to the M1 pro-inflammatory macrophages that infiltrate the adipose tissue, triggers the release of pro-inflammatory cytokines, mainly TNFα and IL-6.Citation23 IL-6 can recruit MDSCs into the tumor microenvironment and promote the release of immunosuppressive associated genes in MDSCs by activating the STAT3 signaling pathway.Citation24,Citation25 Finally, we found that IL-6 inhibitor LMT28 can suppress the growth of ovarian cancer in obese mice which may be a potential treatment for ovarian cancer in obese patients. These data suggest that obesity can upregulate the expression levels of S100A8 and S100A9 by promoting IL-6 expression, which enhances the progression and metastasis of ovarian cancer.
Conclusion
In summary, these data suggest that obesity effectively increases the proportion of MDSCs in the peripheral blood and promotes ovarian cancer tumor immune evasion through immune suppression by MDSCs via the upregulation of IL-6 in ovarian cancer. These data suggest that maintaining a physically fit lifestyle may have a beneficial effect on the progression of ovarian cancer and provide helpful information and direction for elucidation of therapeutic marker of ovarian cancer in obese patients.
Abbreviations
MDSCs, myeloid-derived suppressor cells; TISIDB, tumor-immune system interactions database; DIO model, Diet-induced obesity model; HF, high-fat; LF, low-fat; qRT-PCR, Quantitative real time PCR.
Disclosure
The authors report no conflicts of interest in this work.
Acknowledgments
This research was supported by Shanghai Hospital Development Center (grant No. SHDC12019113) to Jing Sun, Shanghai Municipal Health Commission (grant No. 2019SY002) to Jing Sun, Shanghai Committee of Science and Technology (grant No. 19411960300) to Jing Sun, National Natural Science Foundation of China (Grant No. 82073172) to Ang Li and Shanghai Natural Science Foundation (Grant No. 21ZR1466300) to Ang Li.
References
- SiegelRL, MillerKD, JemalA. Cancer statistics, 2019. CA Cancer J Clin. 2019;69(1):7–34. doi:10.3322/caac.2155130620402
- TorreLA, TrabertB, DeSantisCE, et al. Ovarian cancer statistics, 2018. CA Cancer J Clin. 2018;68(4):284–296. doi:10.3322/caac.2145629809280
- KimB, KimHS, KimS, et al. Adipose stromal cells from visceral and subcutaneous fat facilitate migration of ovarian cancer cellS via IL-6/JAK2/STAT3 pathway. Cancer Res Treat. 2017;49(2):338–349. doi:10.4143/crt.2016.17527456942
- SolitoS, PintonL, DamuzzoV, MandruzzatoS. Highlights on molecular mechanisms of MDSC-mediated immune suppression: paving the way for new working hypotheses. Immunol Invest. 2012;41(6–7):722–737. doi:10.3109/08820139.2012.67802323017143
- GabrilovichDI, Ostrand-RosenbergS, BronteV. Coordinated regulation of myeloid cells by tumours. Nat Rev Immunol. 2012;12(4):253–268. doi:10.1038/nri317522437938
- CuiTX, KryczekI, ZhaoL, et al. Myeloid-derived suppressor cells enhance stemness of cancer cells by inducing microRNA101 and suppressing the corepressor CtBP2. Immunity. 2013;39(3):611–621. doi:10.1016/j.immuni.2013.08.02524012420
- GaoJ, AksoyBA, DogrusozU, et al. Integrative analysis of complex cancer genomics and clinical profiles using the cBioPortal. Sci Signal. 2013;6(269):pl1. doi:10.1126/scisignal.200408823550210
- QuailDF, OlsonOC, BhardwajP, et al. Obesity alters the lung myeloid cell landscape to enhance breast cancer metastasis through IL5 and GM-CSF. Nat Cell Biol. 2017;19(8):974–987. doi:10.1038/ncb357828737771
- IyengarNM, GucalpA, DannenbergAJ, HudisCA. Obesity and cancer mechanisms: tumor microenvironment and inflammation. J Clin Oncol. 2016;34(35):4270–4276. doi:10.1200/JCO.2016.67.428327903155
- ChoU, KimB, KimS, HanY, SongYS. Pro-inflammatory M1 macrophage enhances metastatic potential of ovarian cancer cells through NF-kappaB activation. Mol Carcinog. 2018;57(2):235–242. doi:10.1002/mc.2275029024042
- GrothC, HuX, WeberR, et al. Immunosuppression mediated by myeloid-derived suppressor cells (MDSCs) during tumour progression. Br J Cancer. 2019;120(1):16–25. doi:10.1038/s41416-018-0333-130413826
- PrendergastGC, MalachowskiWJ, MondalA, ScherleP, MullerAJ. Indoleamine 2,3-dioxygenase and its therapeutic inhibition in cancer. Int Rev Cell Mol Biol. 2018;336:175–203.29413890
- OhlK, TenbrockK. Reactive oxygen species as regulators of MDSC-mediated immune suppression. Front Immunol. 2018;9:2499. doi:10.3389/fimmu.2018.0249930425715
- LuC, ReddPS, LeeJR, SavageN, LiuK. The expression profiles and regulation of PD-L1 in tumor-induced myeloid-derived suppressor cells. Oncoimmunology. 2016;5(12):e1247135. doi:10.1080/2162402X.2016.124713528123883
- ConsonniFM, PortaC, MarinoA, et al. Myeloid-derived suppressor cells: ductile targets in disease. Front Immunol. 2019;10:949. doi:10.3389/fimmu.2019.0094931130949
- ZhangH, LiZ, WangL, et al. Critical role of myeloid-derived suppressor cells in tumor-induced liver immune suppression through inhibition of NKT cell function. Front Immunol. 2017;8:129.28243237
- SinghR, StockardCR, GrizzleWE, LillardJWJr, SinghS. Expression and histopathological correlation of CCR9 and CCL25 in ovarian cancer. Int J Oncol. 2011;39:373–381.21637913
- HongIS. Stimulatory versus suppressive effects of GM-CSF on tumor progression in multiple cancer types. Exp Mol Med. 2016;48(7):e242. doi:10.1038/emm.2016.6427364892
- DouganM, DranoffG, DouganSK. GM-CSF, IL-3, and IL-5 family of cytokines: regulators of inflammation. Immunity. 2019;50(4):796–811. doi:10.1016/j.immuni.2019.03.02230995500
- LutgendorfSK, WeinribAZ, PenedoF, et al. Interleukin-6, cortisol, and depressive symptoms in ovarian cancer patients. J Clin Oncol. 2008;26(29):4820–4827. doi:10.1200/JCO.2007.14.197818779606
- MaccioA, MadedduC. Inflammation and ovarian cancer. Cytokine. 2012;58(2):133–147. doi:10.1016/j.cyto.2012.01.01522349527
- IliottaLA, AbeS, RobeyPG, MartinGR. Preferential digestion of basement membrane collagen by an enzyme derived from a metastatic murine tumor. Proc Nati Acad Sci USA. 1979;76(5):2268–2272. doi:10.1073/pnas.76.5.2268
- WuD, HuD, ChenH, et al. Glucose-regulated phosphorylation of TET2 by AMPK reveals a pathway linking diabetes to cancer. Nature. 2018;559:637–641. doi:10.1038/s41586-018-0350-530022161
- KarakhanovaS, LinkJ, HeinrichM, et al. Characterization of myeloid leukocytes and soluble mediators in pancreatic cancer: importance of myeloid-derived suppressor cells. Oncoimmunology. 2015;4:e998519. doi:10.1080/2162402X.2014.99851926137414
- PopVV, SeiceanA, LupanI, SamascaG, BurzCC. IL-6 roles - molecular pathway and clinical implication in pancreatic cancer - A systemic review. Immunol Lett. 2017;181:45–50. doi:10.1016/j.imlet.2016.11.01027876525