
Abstract
Background
Inflammation and nutrition play vital roles in the development of gastric cancer (GC). We combined the preoperative fibrinogen with prognostic nutritional index (PNI) to create a novel scoring system named as the fibrinogen and prognostic nutritional index (FPNI) score and establish a more effective model.
Patients and Methods
A total of 689 patients with gastric adenocarcinoma who underwent gastrectomy from January 2012 to December 2016 were reviewed. We measured correlations between FPNI score and clinicopathological variables and overall survival (OS). A nomogram predicting OS was constructed. Its predictive performance was verified using the concordance index, calibration curves, receiver operating characteristic curves, decision curve analysis and time-dependent receiver operating characteristic analysis.
Results
We observed that the FPNI score was an independent predictor of OS in patients with gastric cancer (P < 0.05). A high FPNI score was significantly related to older age at surgery, tumor size ≥4.6 cm, high ASA score, advanced TNM stage and poor outcome (both P < 0.05). And the FPNI score remained an independent indicator at various TNM stages (P < 0.05). Ultimately, the nomogram based on FPNI score, age, tumor size, histological grade and TNM stage showed a better predictive ability than TNM alone.
Conclusion
The preoperative FPNI score is a novel, simple, and effective predictor of OS in patients with GC. Furthermore, the nomogram involving FPNI score will help clinicians to optimize individualized treatment plans.
Introduction
Gastric cancer (GC) is the fifth most common cancer and the fourth leading cause of cancer death worldwide. Citation1 Despite advancements in surgical techniques and adjuvant therapy, patients with GC have generally unfavorable outcomes. At present, there is still a lack of simple, low-cost and effective predictors for patients with GC. Thus, it is vital to identify a new indicator to predict overall survival (OS) before surgery.
Fibrinogen is produced in the liver in response to serum cytokine stimulation; it reflects tumor progression. Citation2,Citation3 Recently, it was reported that preoperative hyperfibrinogenemia correlated with tumor progression, metastasis, and outcome in patients with GC. Citation4,Citation5 Moreover, several lines of evidences suggest that systemic immune inflammation plays a key role in tumor progression. The prognostic nutritional index (PNI), Citation6 neutrophil-to-lymphocyte ratio, Citation7 platelet-to-lymphocyte ratio Citation8 and other biomarkers have been associated with poor outcome in various cancers. To the best of our knowledge, fibrinogen and PNI have not been simultaneously evaluated as markers of tumor prognosis in patients with GC.
Therefore, we constructed a novel prognostic score named the fibrinogen and prognostic nutritional index (FPNI) score, based on the preoperative plasma fibrinogen level and PNI. The correlation between the FPNI score and OS was assessed. Finally, we established a nomogram combining the FPNI score with clinicopathological parameters to predicted 3- and 5-year OS in patients with GC following gastrectomy.
Patients and Methods
Patients
Research approval was obtained from the Institutional Review Board of the First Affiliated Hospital of Xi’an Jiaotong University. Between January 2012 and December 2016, all patients with gastric cancer at the Department of General Surgery, the First Affiliated Hospital of Xi’an Jiaotong University were retrospectively reviewed. Written informed consent was obtained from all patients in this study. This study was conducted in compliance with the principles of the Declaration of Helsinki. The inclusion criteria were as follows: 1) gastric adenocarcinoma confirmed histopathologically; 2) treatment with gastrectomy; and 3) complete medical records. The exclusion criteria were as follows: 1) loss to follow-up; 2) treatment with neoadjuvant chemotherapy; 3) ≥2 primary malignancies; and 4) perioperative mortality, 5) autoimmune or other inflammatory diseases, 6) hematological disease and 7) continuous anticoagulant therapy. Finally, 689 patients with gastric adenocarcinoma who underwent gastrectomy were recruited ( Supplementary Figure 1 ).
Clinical Data Collecting and Processing
Clinicopathological and laboratory data such as age, sex, ASA score, tumor location, histological grade, vascular invasion, perineural invasion, TNM stage, adjuvant chemotherapy, fibrinogen level, albumin level and lymphocyte count were retrospectively reviewed and collected from the medical records. Based on the ASA classification system, Citation9 all patients were divided into three groups: ASA I, ASA II, and ASA III. The clinical tumor stage was determined according to the seventh edition of the TNM classification. Citation10
The hematological and laboratory parameters were obtained within 1 week before surgery. PNI was defined as albumin (g/L) + 5 × total lymphocyte count (109/L). X-tile 3.6.1 software (Yale University, New Haven, CT) was used to determine the cutoff values for age, tumor size, fibrinogen and PNI for the analysis. Citation11 We found that the optimal cutoff values for age, tumor size, fibrinogen, and PNI were 66 years, 4.6 cm, 3.30 g/L, and 44.8, respectively. The FPNI scores were established using various plasma fibrinogen levels and PNI values.
Follow-Up
Patients were followed up every 3–4 months in the first 2 years after surgery and every 6 months thereafter until they were lost to follow-up or died. The OS was calculated from the time of completion of surgery to the date of death or final follow-up. Patients were followed up until death or until June 2019.
Statistical Analysis
Statistical analyses were conducted using SPSS software (version 25.0; SPSS Inc., Chicago, IL, USA), and R version 3.6.1 software ( http://www.r-project.org/ , The R Foundation for Statistical Computing) with RStudio software version 1.3.1073. The extension packages, including “survival”, “rms”, “rmda”, “foreign” and “timeROC” were also used. Continuous variables were summarized as medians and ranges. Relationships between categorical variables were assessed using Fisher’s exact test or Pearson’s chi-square test. The Kaplan–Meier method with Log rank test was used to assess differences in survival. Univariate and multivariate analyses were performed using the Cox proportional hazards regression model. ROC analysis was performed to define sensitivity and specificity. The nomogram was created using the R software ‘rms’ package. The discriminative ability of the nomogram was assessed by the concordance index (C-index). Citation12 A value of 0.5 represents random predictability and a value of 1.0 represents complete predictability. Citation12 The prognostic abilities of the FPNI scores were evaluated using the time-dependent receiver operating characteristic (t-ROC) curves and the estimated area under the curve (AUC). Citation13 Decision curve analysis (DCA) were applied to assess the predict performance of nomogram and TNM stage. The significance level for all statistical tests was set at 0.05, and all tests were two-sided.
Results
Patient Characteristics and Clinicopathological Data
Among the 689 patients, 521 (75.6%) were male, and 57 (24.4%) were female. The median follow-up period was 56.0 months [interquartile range (IQR): 41–71 months]. Based on the optimal cut-off point for fibrinogen for OS, the entire sample was divided into a low fibrinogen group (fibrinogen <3.30 g/L) and a high fibrinogen group (fibrinogen ≥3.30 g/L). Similarly, the samples were also divided into the a low PNI group (PNI < 44.8) and a high PNI group (PNI ≥ 44.8). All characteristics are described in .
Table 1 Patients and Tumour Characteristics
Univariate and Multivariate Analyses of Factors Associated with OS
Univariate analysis showed that fibrinogen ≥3.30 g/L and PNI < 44.8 were associated with poor OS (P < 0.001 for both, ). Other significant associations included age, the American Society of Anesthesiologists (ASA) score, tumor size, histological grade, perineural invasion and TNM stage (all P < 0.05, ). Multivariate analyses revealed that fibrinogen level, PNI, age, tumor size, histological grade, and TNM stage were independent risk factors for OS (all P < 0.05, ).
Table 2 Univariate and Multivariate Cox Regression Analyses for Overall Survival in Patients with Gastric Cancer
Associations of the Plasma Fibrinogen Level, PNI and FPNI Score
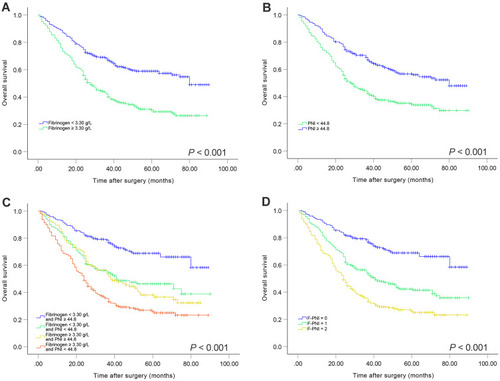
Based on the cutoff value of fibrinogen or PNI (low <3.30 g/L or high ≥3.30 g/L and low <44.8 or high ≥44.8, respectively), patients were stratified into two groups. Kaplan–Meier analysis showed that the high fibrinogen group and the low PNI group were both associated with poor OS (both P < 0.001) (). We combined plasma fibrinogen and PNI levels to form four subgroups to further study the different outcomes of gastric cancer patients. Kaplan-Meier analysis showed the visible differences among the four subgroups (P < 0.001, ). Interestingly, there was no significant difference in OS in subgroups of only plasma fibrinogen ≥3.30 g/L or PNI < 44.8 (P > 0.05, ). As a result, we combined the two subgroups. Based on these results, we constructed a fibrinogen and PNI (FPNI) score defined as follows: patients in the high fibrinogen group (fibrinogen ≥3.30 g/L) and the low PNI group (PNI < 44.8) were allocated a score of 2, those in either only the high fibrinogen group or only the low PNI group were allocated a score of 1, and those in neither of these groups were allocated a score of 0.
Figure 1 Kaplan–Meier analysis for OS of GC patients according to preoperative plasma fibrinogen level and prognostic nutritional index (PNI). Kaplan–Meier analysis for OS according to (A) preoperative plasma fibrinogen level, (B) preoperative PNI, (C) combination of preoperative plasma fibrinogen and PNI, and (D) FPNI score.
The Correlation Between the FPNI Score and OS
Univariate analysis of OS revealed that FPNI score was related to OS. Multivariate analysis indicated that FPNI score, age, tumor size, histological grade, and TNM stage were independent factors of OS (all P < 0.05, ). As shows, high FPNI score was related to poor OS (P < 0.05).
The Prognostic Significance of the FPNI Score in Patients with GC with Different TNM Stage Subgroups
When stratified by TNM stage, significant differences in survival were found for patients with various FPNI score in stages I–II and III–IV subgroups (all P < 0.05, Supplementary Figure 2A and 2B ).
The Relationship Between FPNI Score and Clinicopathological Parameters
The relationship between the FPNI score and clinicopathologic characteristics is shown in . We found that the high FPNI score was related to older age at surgery, tumor size ≥4.6 cm, advanced TNM stage and more likely to have a higher proportion of ASA III (all P < 0.001) ().
Table 3 Associations Between FPNI Score and Clinicopathological Characteristics
Construction and Verification of the Nomogram for OS
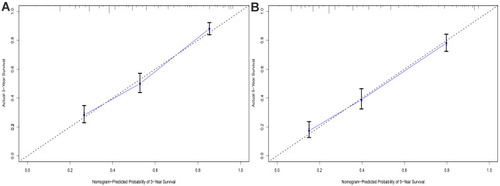
Based on the results of multivariate analyses, a prognostic nomogram predicting 3- and 5-year GC probability was established. As demonstrated in the nomogram, TNM stage contributed most to the prognosis of GC, followed by FPNI score, age, grade, and tumor size (). The C-index of the prediction nomogram was 0.742, which suggested that the model provided favorable discrimination. The model of the nomogram showed a better predictive ability of OS than the TNM stage and FPNI score (C-index 0.678 and C-index 0.631, respectively). We generated a calibration curve to compare nomograms with perfect curves, and this indicated that the 3-, 5-year OS nomograms possessed the excellent consistency with the actual observation (). The areas under the 3- and 5-year ROC curves of the nomogram were 0.797 and 0.800, respectively ( Supplementary Figure 3A and 3B ), suggesting that nomogram has good predictive ability.
Figure 2 Nomogram for predicting 3- and 5-year OS of GC patients after surgery.
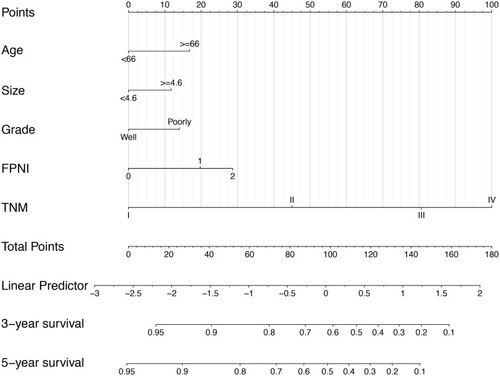
Figure 3 External validation of the nomogram: Calibration plot of the nomogram describing 3- (A) and 5-year (B) OS.
DCA was applied to verify the clinical utility possessed by the nomogram. As displayed in , the DCA curves of nomogram showed larger net benefits across a wider range of threshold probabilities than the TNM stage model in our cohort, indicating the nomogram provides better value for clinical application. These results suggest that the predictive ability of nomogram is better than that of TNM stage.
Figure 4 Decision curve analysis (DCA) curves comparing nomogram and TNM stage. The y-axis represented net benefits and the x-axis measured threshold probability (Pt).

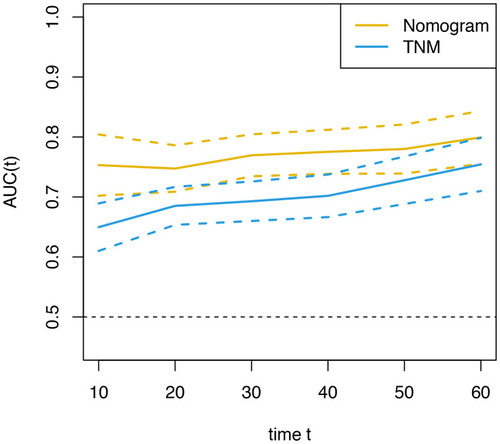
Finally, we also performed a t-ROC curve that visually expresses the significance of prognostic factors, Citation14 to compare the predictive value of nomogram and TNM stage. As shown in , the nomogram can better predict outcomes of patients with GC compared with the traditional TNM stage.
Figure 5 Time-dependent ROC curves for the nomogram and TNM stage. The horizontal axis represents year after surgery, and the vertical axis represents the estimated AUC for survival at the time of interest. Yellow solid lines represent the estimated AUCs for the nomogram, and broken lines represent the 95% confidence intervals for AUC. Blue solid lines represent the estimated AUCs for TNM stage, and broken lines represent the 95% confidence intervals for AUC.
Discussion
In our cohort, we demonstrated that the preoperative fibrinogen and PNI were independent prognostic factors for GC after gastrectomy. We developed a novel prognostic score, named the FPNI score, based on the combination of plasma fibrinogen and PNI. Multivariate analysis showed that the preoperative FPNI score was an independent prognostic factor, suggesting that patients with higher FPNI score have poorer outcomes. In the subgroup analysis, the high FPNI score was associated with poor outcome regardless of whether the GC was TNM stages I–II or stage III–IV. In addition, we verified that high FPNI score was related to older age at surgery, tumor size ≥4.6 cm, high ASA score and advanced TNM stage. Therefore, we created a prognostic nomogram integrating FPNI score with age, tumor size, histological grade and TNM stage. This had greater potential to accurately predict outcome and possessed better clinical usefulness than that of TNM stage.
Several lines of evidence suggest that fibrinogen plays a vital role in the development and progression of cancer. Fibrinogen is produced in the liver in response to serum cytokine stimulation. It also acts as a molecular bridge within cells, promoting stable adhesion among cancer cells, endothelial cells and platelets. Citation15–17 On the one hand, fibrinogen, secretion of which is stimulated by interleukin-6 produced by tumor cells, Citation2 promotes the proliferation of fibroblast growth factor-2. Citation18 In addition, fibrinogen facilitates cancer cell growth and angiogenesis, by interacting with fibroblast growth factor-2 and vascular endothelial growth factor. Citation19 On the other hand, fibrinogen is a critical determinant of the metastatic potential of circulating cancer cells, and it appears to facilitate cancer dissemination through at least one fibrinogen-dependent mechanism. Citation20 Palumbo et al revealed that the platelet-fibrinogen axis contributes to metastatic potential by impeding natural killer cell elimination of cancer cells. Citation21 Ding et al Citation22 showed that preoperative plasma fibrinogen level was a strong predictor of outcome in GC, as we found in our cohort.
PNI, composed of albumin and lymphocytes, was originally primarily used as an indicator of nutritional status. Citation23 Several lines of evidence Citation24,Citation25 suggest that changes in serum albumin may indicate persistent inflammatory responses in patients with cancer cachexia. The chronic systemic inflammatory response is implicated in the progressive nutritional and functional decline in the cancer patients and their subsequent poor outcomes. Citation26 Thus, PNI may reflect systemic inflammation. It was reported that preoperative PNI was a good prognostic indicator of hepatocellular carcinoma, Citation27 gastric cancer, Citation6 colorectal carcinoma Citation28 and pancreatic cancer. Citation29 In our study, we found that the low PNI values were associated with poor outcome, consistent with previous results. However, fibrinogen and PNI had not been simultaneously evaluated as markers of tumor prognosis in patients with GC. Therefore, we created the FPNI score that consists of the plasma fibrinogen level and PNI. We found that both decreased PNI and elevated fibrinogen levels (FPNI score 2) were related to poor outcome, and both elevated PNI and decreased fibrinogen levels (FPNI score 0) were related to favorable outcome. In addition, we found that the high FPNI score was related to aggressive tumor biological phenotypes, including large tumor size and advanced tumor stage. The interaction between the elevated systemic inflammatory responses and tumor progression was partially exposed, in accordance with previous findings. Subgroup analysis showed that FPNI score is also an independent prognostic factor of GC patients diagnosed with TNM stages I–II or stage III–IV. As mentioned above, the FPNI score could be a potential prognostic marker that reflects the balance between host inflammation and immune response status.
To better determine the effect of FPNI score on individualized treatment of gastric cancer, we constructed a nomogram consisting of FPNI score, age, tumor size, histological grade, and TNM stage. The C-index of the nomogram was 0.742, and the areas under the 3- and 5-year ROC curves of the nomogram were 0.797 and 0.800, respectively, suggesting that the nomogram has favorable predictive ability. The accuracy of predicting 3- and 5-year OS was assessed using the calibration curve; this revealed excellent agreement between the nomogram and the actual observation results. Compared with TNM stage, the nomogram showed better discriminative ability and accuracy for predicting OS probabilities with higher C-index. The DCA curve also proved that our nomogram possessed better potential for clinical utility than did TNM stage. For the past few years, t-ROC analysis Citation13 has been applied for time-dependent variables that can visually assessed the significance of individual prognostic factors. Citation14 The t-ROC curve of the nomogram demonstrated that it possesses better predictive performance than that of TNM stage. Taken together, our findings suggest that the FPNI score is a very potential prognostic indicator for GC, and it can be applied to refine risk stratification in patients with GC before and after treatment.
There are some limitations that need to be addressed. First, because of the retrospective nature and absence of external validation, the present study may have been subject to selection bias. Second, we failed to comprehensively assess disease-free survival in GC patients due to the lack of sufficient relevant data. Third, C-reactive protein factor was not recorded in this cohort, owing to the lack of data. Therefore, large prospective multicenter clinical trials are needed to validate our findings in the future.
Conclusions
We developed a novel effective prognostic score called FPNI score that was based on preoperative plasma fibrinogen and PNI. The FPNI score was an independent risk factor for OS in GC patients. In addition, the developed nomograms based on FPNI score and traditional clinicopathological characteristics may help clinicians to plan individualized treatment strategies for GC patients.
Data Sharing Statement
The datasets generated during and/or analysed during the current study are available from the corresponding author on reasonable request.
Ethics Approval
Research approval was obtained from the Institutional Review Board of the First Affiliated Hospital of Xi’an Jiaotong University. This study was conducted in compliance with the principles of the Declaration of Helsinki.
Disclosure
The authors have declared that no competing interests exist.
Acknowledgments
The authors thank Charlesworth for providing language editing.
References
- Sung H , Ferlay J , Siegel R , et al. Global cancer statistics 2020: GLOBOCAN estimates of incidence and mortality worldwide for 36 cancers in 185 countries. CA Cancer J Clin . 2021. doi:10.3322/caac.21660
- Yamaguchi T , Yamamoto Y , Yokota S , et al. Involvement of interleukin-6 in the elevation of plasma fibrinogen levels in lung cancer patients. Jpn J Clin Oncol . 1998;28(12):740–744. doi:10.1093/jjco/28.12.740 9879291
- Tennent GA , Brennan SO , Stangou AJ , et al. Human plasma fibrinogen is synthesized in the liver. Blood . 2007;109(5):1971–1974. doi:10.1182/blood-2006-08-040956 17082318
- Suzuki T , Shimada H , Nanami T , et al. Hyperfibrinogenemia is associated with inflammatory mediators and poor prognosis in patients with gastric cancer. Surg Today . 2016;46(12):1394–1401. doi:10.1007/s00595-016-1339-z 27160890
- Wu Z , Xu H , Wang R , et al. Cumulative score based on preoperative fibrinogen and pre-albumin could predict long-term survival for patients with resectable gastric cancer. J Cancer . 2019;10(25):6244–6251. doi:10.7150/jca.35157 31772657
- Xishan Z , Ye Z , Feiyan M , Liang X , Shikai W . The role of prognostic nutritional index for clinical outcomes of gastric cancer after total gastrectomy. Sci Rep . 2020;10(1):17373. doi:10.1038/s41598-020-74525-8 33060715
- Reddy JP , Hernandez M , Gunther JR , et al. Pre-treatment neutrophil/lymphocyte ratio and platelet/lymphocyte ratio are prognostic of progression in early stage classical Hodgkin lymphoma. Br J Haematol . 2018;180(4):545–549. doi:10.1111/bjh.15054 29271057
- Mandaliya H , Jones M , Oldmeadow C , Nordman II . Prognostic biomarkers in stage IV non-small cell lung cancer (NSCLC): neutrophil to lymphocyte ratio (NLR), lymphocyte to monocyte ratio (LMR), platelet to lymphocyte ratio (PLR) and advanced lung cancer inflammation index (ALI). Transl Lung Cancer Res . 2019;8(6):886–894. doi:10.21037/tlcr.2019.11.16 32010567
- Wolters U , Wolf T , Stützer H , Schröder T . ASA classification and perioperative variables as predictors of postoperative outcome. Br J Anaesth . 1996;77(2):217–222. doi:10.1093/bja/77.2.217 8881629
- Edge S , Compton CC . The American Joint Committee on Cancer: the 7th edition of the AJCC cancer staging manual and the future of TNM. Ann Surg Oncol . 2010;17(6):1471–1474. doi:10.1245/s10434-010-0985-4 20180029
- Camp RL , Dolled-Filhart M , Rimm DL . X-tile: a new bio-informatics tool for biomarker assessment and outcome-based cut-point optimization. Clin Cancer Res . 2004;10(21):7252–7259. doi:10.1158/1078-0432.CCR-04-0713 15534099
- Harrell FE , Lee KL , Mark DB . Multivariable prognostic models: issues in developing models, evaluating assumptions and adequacy, and measuring and reducing errors. Stat Med . 1996;15(4):361–387. doi:10.1002/(SICI)1097-0258(19960229)15:4<361::AID-SIM168>3.0.CO;2-4 8668867
- Heagerty P , Lumley T , Pepe MS . Time-dependent ROC curves for censored survival data and a diagnostic marker. Biometrics . 2000;56(2):337–344. doi:10.1111/j.0006-341x.2000.00337.x 10877287
- Suzuki Y , Okabayashi K , Hasegawa H , et al. Comparison of preoperative inflammation-based prognostic scores in patients with colorectal cancer. Ann Surg . 2018;267(3):527–531. doi:10.1097/SLA.0000000000002115 27984214
- Leung L , Nachman R . Molecular mechanisms of platelet aggregation. Annu Rev Med . 1986;37(1):179–186. doi:10.1146/annurev.me.37.020186.001143 3010804
- Palumbo J , Potter J , Kaplan L , et al. Spontaneous hematogenous and lymphatic metastasis, but not primary tumor growth or angiogenesis, is diminished in fibrinogen-deficient mice. Cancer Res . 2002;62(23):6966–6972.12460914
- Zheng S , Shen J , Jiao Y , et al. Platelets and fibrinogen facilitate each other in protecting tumor cells from natural killer cytotoxicity. Cancer Sci . 2009;100(5):859–865. doi:10.1111/j.1349-7006.2009.01115.x 19302289
- Sahni A , Simpson-Haidaris PJ , Sahni SK , Vaday GG , Francis CW . Fibrinogen synthesized by cancer cells augments the proliferative effect of FGF-2. J Thromb Haemost . 2008;6:176–183. doi:10.1111/j.1538-7836.2007.02808.x 17949478
- Sahni A , Francis CW . Vascular endothelial growth factor binds to fibrinogen and fibrin and stimulates endothelial cell proliferation. Blood . 2000;96(12):3772–3778. doi:10.1182/blood.V96.12.3772 11090059
- Palumbo JS , Kombrinck KW , Drew AF , et al. Fibrinogen is an important determinant of the metastatic potential of circulating tumor cells. Blood . 2000;96(10):3302–3309. doi:10.1182/blood.V96.10.3302 11071621
- Palumbo JS , Talmage KE , Massari JV , et al. Platelets and fibrin(ogen) increase metastatic potential by impeding natural killer cell-mediated elimination of tumor cells. Blood . 2005;105(1):178–185. doi:10.1182/blood-2004-06-2272 15367435
- Ding P , Zheng C , Cao G , et al. Combination of preoperative plasma fibrinogen and AJCC staging improves the accuracy of survival prediction for patients with stage I-II gastric cancer after curative gastrectomy. Cancer Med . 2019;8(6):2919–2929. doi:10.1002/cam4.2086 31050218
- Nozoe T , Ninomiya M , Maeda T , et al. Prognostic nutritional index: a tool to predict the biological aggressiveness of gastric carcinoma. Surg Today . 2010;40(5):440–443. doi:10.1007/s00595-009-4065-y 20425547
- Esper DH , Harb WA . The cancer cachexia syndrome: a review of metabolic and clinical manifestations. Nutr Clin Pract . 2005;20(4):369–376. doi:10.1177/0115426505020004369 16207677
- Komáromi A , Estenberg U , Hammarqvist F , et al. Simultaneous assessment of the synthesis rate and transcapillary escape rate of albumin in inflammation and surgery. Crit Care . 2016;20(1):370. doi:10.1186/s13054-016-1536-6 27846908
- McMillan DC . Systemic inflammation, nutritional status and survival in patients with cancer. Curr Opin Clin Nutr Metab Care . 2009;12(3):223–226. doi:10.1097/MCO.0b013e32832a7902 19318937
- Imai D , Maeda T , Shimokawa M , et al. Prognostic nutritional index is superior as a predictor of prognosis among various inflammation-based prognostic scores in patients with hepatocellular carcinoma after curative resection. Hepatol Res . 2020;50(1):101–109. doi:10.1111/hepr.13431 31692173
- Luvián-Morales J , González-Trejo S , Carrillo JF , et al. Association of the prognostic nutritional index and overall survival in patients with colorectal cancer: a STROBE compliant retrospective cohort study. Cancer Med . 2019;8(7):3379–3388. doi:10.1002/cam4.2212 31069966
- Kim KH , Hwang HK , Kang IC , Lee WJ , Kang CM . Oncologic impact of preoperative prognostic nutritional index change in resected pancreatic cancer following neoadjuvant chemotherapy. Pancreatology . 2020;20(2):247–253. doi:10.1016/j.pan.2019.12.006 31889624