
Abstract
Purpose
This study aimed to explore the value of miR-181a-2-3p in cisplatin (DDP) treatment effectiveness prediction, and to reveal the function underlying the reversal of DDP resistance in patients with gastric cancer (GC).
Methods
miRNA expression dataset of three DDP-resistant GC cell lines and their DDP-sensitive parental cell lines obtained from GEO DataSets and GenBank, and functional miRNAs were annotated by bioinformatics analyses. Serum specimens and tumor samples were collected from 91 GC patients for understanding of the interrelation between chemotherapy response and miRNA expression. RT-qPCR validated these miRNAs at the transcriptional level in both gastric cancer cells and 91 gastric cancer patients. The correlation between the miRNAs expression and clinical parameters of the patients were analyzed. Receiver operating characteristics (ROC) analysis has been utilized to assess the diagnostic performance. The MTT and colony formation assays were performed to assess cell proliferation. Flow cytometry was conducted to detect cell apoptosis. DDP-resistant GC cells and their DDP-sensitive parental cells were transfected with miRNA mimic or inhibitor vector to overexpress or downregulate miRNA expression.
Results
miR-181a-2-3p as a unique miRNA was found in the common differentially expressed-miRNAs (DE-miRNAs) after miRNA screening and validation from three DDP-resistant and DDP-sensitive gastric cancer cell lines. Clinical data analysis displayed that miR-181a-2-3p expression was apparently increased in larger tumor size (≥5 cm), higher T stage (T4), and chemotherapy resistance. miR-181a-2-3p (AUC=0.926, SE=0.028, 95% CI: 0.872–0.980, p< 0.0001) differentiated chemosensitive GC patients from chemoresistant GC patients. miR-181a-2-3p presented a higher level in gastric cancer, and could serve as a valid biomarker to predict the overall survival of GC patients. Upregulation of miR-181a-2-3p rendered the apoptosis-inducing and anti-proliferative effects of DDP, while downregulating it decreased these effects.
Conclusion
miR-181a-2-3p can function as a therapeutic target and a tumor biomarker. Targeting oncogenic miR-181a-2-3p inhibits growth and suppresses cisplatin resistance of gastric cancer.
Introduction
Gastric cancer, a non-negligible malignant cancer, is prevalent worldwide, making it the fourth most commonly diagnosed cancer and the second leading cause of cancer death.Citation1 There were about 691,000 cases of gastric adenocarcinoma worldwide in 2012.Citation2 An estimated 720,000 patients died from gastric cancer in that year.Citation3 Due to the high prevalence of metastasis, drug-resistance, and recurrence, the current long-term survival rate of GC patients is poor.Citation4 Cisplatin (DDP) is considered as a first-line agent for advanced GC patients. DDP exerts an antitumor effect through activating several apoptosis pathways.Citation5 In most GC patients, DDP resistance is inevitable, thus causing treatment failure. Hence, seeking novel targets and biomarkers and elucidating the underlying molecular mechanisms are urgently needed for improved outcomes.
miRNAs are an existing class of small noncoding RNAs.Citation6 In many tumors, their dysregulation may give rise to DDP resistance, which is yet to be fully understood.Citation7,Citation8 In human serum specimens of multiple neoplasms, miRNAs might serve as biomarkers for treatment prognosis and sensitivity.Citation9–Citation11 The potential mechanisms of antitumor drug resistance may be relevant to miRNA-mediated proliferation and apoptosis.Citation12 Some reports have been published on the relationship between the miRNA utilization and the initiation, progression, diagnosis, appropriate treatment and prognose of the GC.Citation13–Citation15 Nonetheless, specific miRNAs that act as a prognostic biomarker for GC chemotherapy remain to be uncovered.
In the current work, microRNA profiles were analyzed in GC cells to discover the unique miRNAs. The correlation between miRNA expression and clinical prognosis was evaluated using clinical specimens from GC patients after DDP therapy. We tried to uncover unique biomarkers for chemotherapy response and their role underlying the reversal of DDP resistance in GC patients.
Materials and Methods
Cell Lines, Cultures and Reagents
Human gastric cancer cell lines (AGS, NCI-N87, MGC-803, SGC-7901, BGC-823 and MKN-45) and human gastric epithelial cell line (GES-1) were acquired from the Chinese Academy of Medical Sciences (Beijing, China).
DDP-resistant GC cell lines (SGC-7901/DDP, MGC-803/DDP and BGC-823/DDP) were produced and established from parental cell lines (SGC-7901, MGC-803 and BGC-823). Specific culture conditions and reagents for experiments are previously described.Citation15–Citation17
Plasmids and Transfection
Expression plasmids for the miR-181a-2-3p mimics control, miR-181a-2-3p mimics, miR-181a-2-3p inhibitor and miR-181a-2-3p inhibitor control were obtained from Fulengene. Specific transfection procedure and reagents for experiments are almost the same as previously described, except for the concentration of RT-qPCR (2x10⁵/well), MTT assays (3x10³/well), and colony formation assays (2x10²/well).Citation14
Patient Enrollment and Ethics Statement
Serum specimens and tumor samples of 91 GC patients were collected. Inclusion and exclusion criteria for enrolled patients and evaluation criteria for chemotherapy response effect are performed as described before.Citation14,Citation16,Citation18 Informed consent of all patients was obtained. This study was approved by the Ethics Committee of Beijing Friendship Hospital (Approval Number: 2018-P2-045-01), Capital Medical University. The study was conducted in accordance with the Declaration of Helsinki.
miRNA Microarray and Data Analysis
GSE86195 dataset derived from GEO DataSets (http://www.ncbi.nlm.nih.gov/gds) contained miRNA expression profiles of four GC cell lines SGC-7901/DDP, SGC-7901, BGC-823/DDP and BGC-823.Citation19 PRJNA615333 and SRR11427197 dataset obtained from GenBank (https://www.ncbi.nlm.nih.gov/genbank) contained miRNA expression profiles of MGC-803/DDP and MGC-803.Citation15
|log2 (Fold Change) | ˃ 1 with P-value< 0.05 was accepted as statistically significant to calculate differentially expressed-miRNAs (DE-miRNAs) between the cisplatin resistant GC cell line and its sensitive parental cell line by the edgeR algorithm.
Bioinformatics Analysis
The common DE-miRNAs were picked out by taking the intersection. Venn diagram of the common DE-miRNAs was calculated and drawn via the Bioinformatics & Evolutionary Genomics web tool (http://bioinformatics.psb.ugent.be/webtools/Venn). Starbase database (http://starbase.sysu.edu.cn/index.php) was utilized to verify the expression levels of DE-miRNAs in gastric cancer and its normal tissues, and to verify the correlation between DE-miRNAs and survival time in gastric cancer. OncomiR database (http://www.oncomir.org/), OncoLnc database (http://www.oncolnc.org/), and Kaplan–Meier Plotter database (http://kmplot.com) were adopted to verify the association between DE-miRNAs and overall survival in gastric cancer.Citation20–Citation23
RNA Extraction and RT-qPCR
Caenorhabditis elegans cel-39-3p miRNA was selected as an external calibration for RNA Extraction and RT-qPCR for serum samples. The primers sequence for miRNA detection is listed in . Specific procedure of RNA Extraction and RT-qPCR are the same as previously described.Citation14,Citation15
Table 1 Primers of RT-qPCR
MTT Assay
Before this assay, cells were cultured under normal conditions or as indicated for the DDP-treated conditions. Cells were counted at a concentration of 3×10³/well into 96-well plate. After adhere, cells were treated with DDP (200 μL/well) at the indicated concentrations for 48 h. Specific MTT procedure and reagents for experiments are the same as previously described.Citation14
Colony Formation Assay
Specific colony formation procedure and reagents for experiments are almost the same as previously described, except for the concentration of colony formation assays (2x10²/well).Citation14
Flow Cytometric Analysis of Apoptosis
Specific flow cytometry procedure and reagents for experiments are the same as previously described.Citation14
Statistical Analysis
Specific statistical analysis is almost the same as previously described.Citation14,Citation15 For the in vitro experiments, statistical differences were analyzed using the unpaired Student’s t-test and one-way ANOVA followed by Tukey’s multiple comparisons test. Associations between the clinical parameters of the patients and their miRNA expression were analyzed using the Mann–Whitney test. The expression level distribution of miR-181a-2-3p in different groups is presented as the median and interquartile range [median (Q1 and Q3)]. All data were expressed as mean±SD. Each experiment was repeated independently at least three times. Quantitative data were analyzed and graphically represented using SPSS 26.0, MedCalc, and GraphPad Prism 8. Differences were considered to be significant at ****P< 0.0001, ***P< 0.001, **P< 0.01, and *P< 0.05.
Results
miRNA Screening and Validation from DDP-Sensitive and DDP-Resistant Gastric Cancer Cell Lines
The differentially expressed-miRNAs (DE-miRNAs) in DDP-resistant GC cells and their parental DDP-sensitive cells were determined by miRNA microarray analysis. Scanning and counting the DE-miRNAs, there were 68 miRNAs between SGC-7901 and SGC-7901/DDP, 94 miRNAs
between BGC-823 and BGC-823/DDP, and 35 miRNAs between MGC-803 and MGC-803/DDP (Supplementary Table 1). The common DE-miRNAs were picked out by taking the intersection of these three paired cell lines, and was shown using Venn diagram (). miR-181a-2-3p as a unique miRNA was found in the intersection, and was chosen for further study.
Figure 1 MiRNA screening and validation from DDP-resistant and DDP-sensitive gastric cancer cell lines. (A) Venn diagram on total number (in parenthesis) and overlapping number of differentially expressed miRNAs calculated in cell line pairs consisting of the cisplatin-resistant (/DDP added to the paternal cell line’s name) relative to the cisplatin-sensitive paternal cell lines. (B) Relative expression level of miR-181a-2-3p in DDP-resistant and DDP-sensitive cells detected by RT-qPCR.
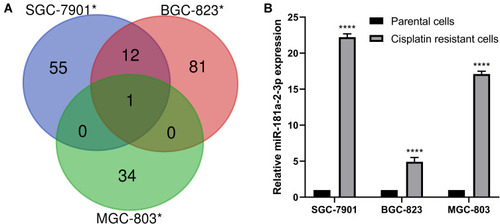
Furthermore, RT-qPCR analysis was performed to validate miR-181a-2-3p expression level. The results revealed that miR-181a-2-3p expression was significantly upregulated ~22.2-fold in SGC-7901/DDP cells (compared with SGC-7901 cells), ~4.9-fold in BGC-823/DDP cells (compared with BGC-823 cells), and ~17.1-fold in MGC-803/DDP cells (compared with MGC-803 cells), which proved the correlation between DDP resistance and miR-181a-2-3p expression level (). The above results indicate that miR-181a-2-3p may influence the DDP resistance of GC cells.
Expression Levels and Functions of miR-181a-2-3p in GC Serum and Tumor Samples
summarizes the clinicopathological characteristics of 91 GC patients who received palliative treatment or neoadjuvant chemotherapy. RT-qPCR analysis was utilized to test miR-181a-2-3p levels of GC serum specimens and tumor samples in different clinical parameters. Using the median ratio as the cutoff for miR-181a-2-3p expression (Fold Change=0) in GC serum specimens and tumor samples, patients were divided into two groups: miR-181a-2-3plow and miR-181a-2-3phigh.
Table 2 The Correlation Between miR-181a-2-3p Expression and Clinical Parameters in GC Patients (n=91)
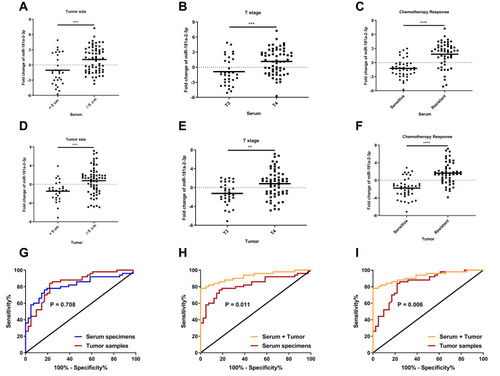
The results show that miR-181a-2-3p expression was markedly elevated in larger tumor size (≥5 cm; Pserum= 0.0010, ; Ptumor= 0.0002, ), higher T stage (T4; Pserum= 0.0006, ; Ptumor= 0.0016, ), and chemotherapy resistance (SD+PD; Pserum< 0.0001, ; Ptumor< 0.0001, ) both in GC serum specimens and tumor samples.
Figure 2 Expression levels and functions of miR-181a-2-3p in human gastric cancer clinical specimens. (A–C) miR-181a-2-3p expression was obviously increased in larger tumor size (≥5 cm; P= 0.0010) (A), higher T stage (T4; P= 0.0006) (B), and chemotherapy resistance (SD+PD; P< 0.0001) (C) in gastric cancer serum specimens. (D–F) miR-181a-2-3p expression was obviously increased in larger tumor size (≥5 cm; P= 0.0002) (D), higher T stage (T4; P= 0.0016) (E), and chemotherapy resistance (SD+PD; P< 0.0001) (F) in gastric cancer tumor samples. (G) A comparison between the serum specimen group (miR-181a-2-3pserum) and the tumor samples group (miR-181a-2-3ptumor) showed that the two compared areas were not significantly different (P= 0.708) by MedCalc software. (H) The compared areas of the combined two sample types group (miR-181a-2-3pserum + tumor) and the serum specimen group (miR-181a-2-3pserum) were significantly different (P= 0.011) by MedCalc software. (I) The compared areas of the combined two sample types group (miR-181a-2-3pserum + tumor) and the tumor samples group (miR-181a-2-3ptumor) were significantly different (P= 0.006) by MedCalc software.
What’s more, miR-181a-2-3p expression was obviously increased in abnormal CEA level (P= 0.0200, Supplementary Figure 1A) and abnormal CA19-9 level (P= 0.0015, Supplementary Figure 1B) in GC serum specimens. Additionally, miR-181a-2-3p expression was obviously increased in worse Grades stage (G3+G4, P= 0.0184, Supplementary Figure 1C), present lymph node metastasis (P= 0.0280, Supplementary Figure 1D), and higher TNM stage (IV, P< 0.0001, Supplementary Figure 1E) in GC tumor samples. These results suggest that in GC patients, miR-181a-2-3p may function as a biomarker for DDP response and be related to tumor growth. However, miR-181a-2-3p expression was not related with gender, age, CA724 level, CA125 level, or M stage both in GC serum specimens and tumor samples ().
miR-181a-2-3p could distinguish the GC chemotherapy response-sensitive group (CR+PR) from the GC chemotherapy response-resistant group (SD+PD). Receiver operating characteristic (ROC) curve was utilized to predict the diagnostic efficacy of miR-181a-2-3p. The results for the area under the curves (AUC), standard error (SE), 95% confidence intervals (CI), and P-values of miR-181a-2-3p in GC serum specimens and tumor samples were as follows: miR-181a-2-3pserum (AUC: 0.821, SE: 0.045, 95% CI: 0.733–0.909, p< 0.0001, ) and miR-181a-2-3ptumor (AUC: 0.843, SE: 0.041, 95% CI: 0.762–0.924, p< 0.0001, ), respectively.
miR-181a-2-3p both in GC serum specimens and tumor samples offered potential AUC values to differentiate CR+PR groups from SD+PD groups.
Comparing to the individual sample type (serum specimens or tumor samples), the combined sample type gained a significantly improved performance, determined by: miR-181a-2-3pserum + tumor (AUC: 0.926, SE: 0.028, 95% CI: 0.872–0.980, p< 0.0001, ). The risk score factors (RSF) of the logistic model were calculated as 0.591 × miR-181a-2-3pserum + 0.729 × miR-181a-2-3ptumor + 0.231.
A comparison between miR-181a-2-3pserum and miR-181a-2-3ptumor was not significantly different (P= 0.708, ). The compared areas of miR-181a-2-3pserum + tumor and miR-181a-2-3pserum were significantly different (P= 0.011, ). The compared areas of miR-181a-2-3pserum + tumor and miR-181a-2-3ptumor were significantly different (P= 0.006, ).
The results suggest that higher levels of miR-181a-2-3pserum + tumor is a better biomarker for chemoresistance in GC patients.
Bioinformatics Analysis and Validation of miR-181a-2-3p in Gastric Cancer
To ascertain the expression of miR-181a-2-3p in gastric cancer, Starbase database and RT-qPCR were used to analyse and validate. Starbase database showed miR-181a-2-3p got a higher expression in 372 gastric cancer samples, compared with 32 gastric normal samples (). RT-qPCR confirmed that miR-181a-2-3p was at a relatively high level in most human GC cell lines (AGS, MGC-803, BGC-823 and SGC-7901), compared with GES-1 (). Additionally, compared to adjacent non tumor tissue, miR-181a-2-3p presented a higher level in gastric cancer tissue ().
Figure 3 Bioinformatics analysis and validation of miR-181a-2-3p in gastric cancer. (A) Starbase database showed miR-181a-2-3p got a higher expression in 372 gastric cancer samples, compared with 32 gastric normal samples. (B) RT-qPCR results proved that miR-181a-2-3p was at a relatively high level in most human gastric cancer cell lines (AGS, SGC-7901, BGC-823 and MGC-803), compared with human gastric epithelial cell line GES-1. (C and D) Compared to adjacent non tumor tissue, miR-181a-2-3p presented a higher level in gastric cancer tissue. (E–H) GC patients with higher miR-181a-2-3p levels had obviously shorter 10-year overall survival (OS) times than those with lower miR-181a-2-3p levels in Kaplan–Meier Plotter database (P= 0.053) (E), OncoLnc database (P= 0.00506) (F), OncomiR database (P= 0.003906) (G), and Starbase database (P= 0.0045) (H).
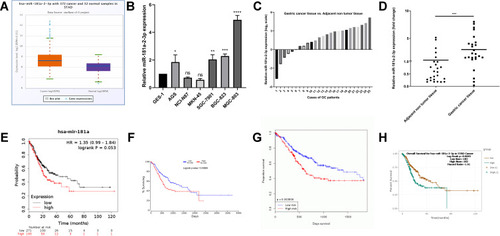
A large cohort analysis was performed via Kaplan–Meier survival data based on OncoLnc database, Kaplan–Meier Plotter database, OncomiR database, and Starbase database in order to find out the function of miR-181a-2-3p as a potential prognostic factor. The results showed that GC patients with higher miR-181a-2-3p levels had obviously shorter 10-year overall survival (OS) times than those with lower levels in Kaplan–Meier Plotter database (P= 0.053, ), OncoLnc database (P= 0.00506, ), OncomiR database (P= 0.003906, ), and Starbase database (P= 0.0045, ), which suggested that miR-181a-2-3p could function as a promising biomarker for overall survival of GC patients.
Upregulation of miR-181a-2-3p Renders GC Cells Resistance to DDP
The aforementioned results suggested that miR-181a-2-3p expression was significantly upregulated ~22.2-fold in SGC-7901/DDP cells (compared with SGC-7901 cells) and ~17.1-fold in MGC-803/DDP cells (compared with MGC-803 cells), which was higher than that in BGC-823/DDP cells (~4.9-fold, compared with BGC-823 cells) (). So, we chose these two pairs cell lines (MGC-803 with MGC-803/DDP, and SGC-7901 with SGC-7901/DDP) for further study. To explore the function of miR-181a-2-3p in DDP resistance, miR-181a-2-3p was subsequently overexpressed in MGC-803 and SGC-7901 cells, and downregulated in MGC-803/DDP and SGC-7901/DDP cells via transient transfection.
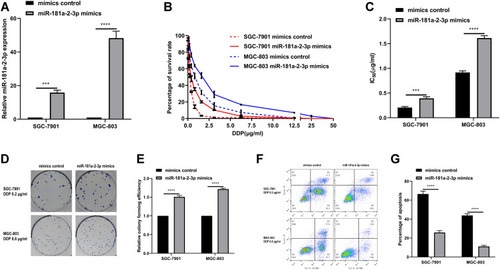
RT-qPCR proved that compared with that in mimics control cells, miR-181a-2-3p level was significantly increased in MGC-803 and SGC-7901 cells transfected with miR-181a-2-3p mimics (). In order to verify the correlation between miR-181a-2-3p overexpression and DDP resistance, MGC-803 and SGC-7901 cells were transfected with either miR-181a-2-3p mimics or mimic control. Cell activity was tested after 48 h (). MGC-803 and SGC-7901 cells transfected with the miR-181a-2-3p mimics showed marked increase in survival rates and higher DDP IC50 values, comparing to the mimics control (). Furthermore, higher levels of miR-181a-2-3p were correlated with increased cell proliferation after culture with 0.2 μg/mL DDP in SGC-7901 cells or 0.8 μg/mL DDP in MGC-803 cells (). Comparing to the mimics control cells, the relative colony forming efficiency in both MGC-803 and SGC-7901 cells transfected with the miR-181a-2-3p mimics got a significant increase (). Besides, compared with the mimics control cells, MGC-803 and SGC-7901 cells transfected with miR-181a-2-3p mimics exhibited decreased rates of apoptosis after culture with 0.2 μg/mL DDP and 0.8 μg/mL DDP, respectively (). Therefore, miR-181a-2-3p overexpression increased DDP resistance, caused by decrease in apoptosis and cytotoxicity. The above results substantiate that miR-181a-2-3p overexpression renders DDP resistance in gastric cancer cells.
Figure 4 Overexpression of miR-181a-2-3p renders gastric cancer cells resistance to DDP. (A) RT-qPCR results confirm that miR-181a-2-3p level was significantly increased in SGC-7901 cells and MGC-803 cells transfected with miR-181a-2-3p mimics, compared with that in mimics control cells. (B) Cellular activity in SGC-7901 cells and MGC-803 cells transfected with miR-181a-2-3p mimics, compared with that in mimics control cells, was detected following treatment with various concentrations of DDP for 48 h. (C) SGC-7901 cells and MGC-803 cells transfected with the miR-181a-2-3p mimics showed marked increase in survival rates and higher DDP IC50 values, compared with the mimics control cells. (D) Higher levels of miR-181a-2-3p were associated with increased cell proliferation after 2 weeks of culture with 0.2 μg/mL DDP in SGC-7901 cells or 0.8 μg/mL DDP in MGC-803 cells. (E) Compared with the mimics control cells, the relative colony forming efficiency in both SGC-7901 cells and MGC-803 cells transfected with the miR-181a-2-3p mimics got a significant increase. (F and G) Compared with the mimics control cells, SGC-7901 cells and MGC-803 cells transfected with miR-181a-2-3p mimics exhibited decreased rates of apoptosis following culture with 0.2 μg/mL DDP and 0.8 μg/mL DDP for 48 h, respectively.
Downregulation of miR-181a-2-3p Sensitizes GC Cells to DDP
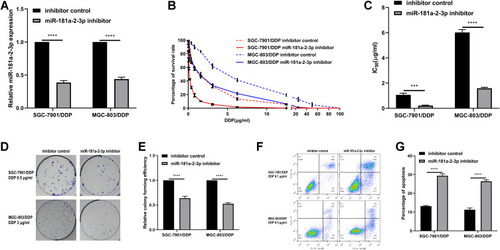
RT-qPCR proved that miR-181a-2-3p level was markedly decreased in MGC-803/DDP and SGC-7901/DDP cells transfected with miR-181a-2-3p inhibitor, comparing to in inhibitor control cells (). To demonstrate the association between DDP resistance and miR-181a-2-3p downregulation, MGC-803/DDP and SGC-7901/DDP cells were transfected with either miR-181a-2-3p inhibitor or inhibitor control. MGC-803/DDP and SGC-7901/DDP cells were then cultured with different DDP concentrations, following by viability assessment (). miR-181a-2-3p-knockdown in MGC-803/DDP and SGC-7901/DDP cells led to higher DDP IC50 values and increased survival rates, comparing to the inhibitor control cells (). After culture with 0.5 μg/mL DDP in SGC-7901/DDP cells and 3 μg/mL DDP in MGC-803/DDP cells, decreased levels of miR-181a-2-3p were also relevant with less proliferation and colony formation (). Besides, flow cytometry exhibited that after culture with 0.1 μg/mL DDP in SGC-7901/DDP cells and 0.5 μg/mL DDP in MGC-803/DDP cells, MGC-803/DDP and SGC-7901/DDP cells transfected with miR-181a-2-3p inhibitor displayed increased apoptotic rate comparing to the inhibitor control cells (). Thus, miR-181a-2-3p-knockdown in MGC-803/DDP and SGC-7901/DDP cells displayed weaker DDP resistance, caused by increase in apoptosis and cytotoxicity. The above results substantiate that downregulation of miR-181a-2-3p sensitizes DDP sensitivity in gastric cancer cells.
Figure 5 Downregulation of miR-181a-2-3p sensitizes gastric cancer cells to DDP. (A) RT-qPCR results confirm that miR-181a-2-3p level was markedly reduced in SGC-7901/DDP cells and MGC-803/DDP cells transfected with miR-181a-2-3p inhibitor, compared with that in inhibitor control cells. (B) SGC-7901/DDP cells and MGC-803/DDP cells transfected with either miR-181a-2-3p inhibitor or inhibitor control were treated with a range of DDP concentrations for 48 h, after which viability was assessed. (C) miR-181a-2-3p-knockdown in SGC-7901/DDP cells and MGC-803/DDP cells resulted in increased survival rates and higher DDP IC50 values, compared with the inhibitor control cells. (D and E) Following treatment with 0.5 μg/mL DDP in SGC-7901/DDP cells and 3 μg/mL DDP in MGC-803/DDP cells for 2 weeks, reduced levels of miR-181a-2-3p were also associated with decreased proliferation and colony formation. (F and G) Flow cytometric analysis revealed that after treatment with 0.1 μg/mL DDP in SGC-7901/DDP cells and 0.5 μg/mL DDP in MGC-803/DDP cells for 48 h, SGC-7901/DDP cells and MGC-803/DDP cells transfected with miR-181a-2-3p inhibitor exhibited increased apoptotic rate compared with the inhibitor control cells.
Discussion
DDP resistance is an obstacle for effective therapy of GC. The identification of special biomarkers for DDP resistance will greatly contribute to the accurate diagnosis and effective treatment of gastric cancer. Role of miRNAs in DDP therapy remains unclear. miRNAs act a crucial role in the occurrence and development of tumors, which may be related to the drug resistance.Citation24–Citation26 For example, miR-21 downregulation in GC cells has been reported to change survival rates via elevating DDP sensitivity.Citation27
Some reports have been published on the relationship between the miRNA utilization and the initiation, progression, diagnosis, appropriate treatment and prognosis of the GC. Fang et al reported that some cancer-related miRNAs (miR-338, miR-223, miR-21, and miR-10b) and tumor-inhibiting miRNAs (let-7a, miR-126, and miR-30a-5p) can serve as prognostic biomarkers in patients with gastric cancer.Citation13 A large number of studies have reported the use of circulating miRNAs in combination to improve diagnostic accuracy, with an AUC greater than 0.8.Citation28,Citation29 Few reports have been reported on the application of miRNAs in the screening and diagnosis of DDP response in gastric cancer. In the study, sRNA-seq technology was utilized to establish the difference of miRNAs expression profiles between chemotherapy-resistant and chemotherapy-sensitive GC cells, and bioinformatics analysis was used to screen out the potential miRNAs. Our results displayed that miR-181a-2-3p was significantly upregulated in GC cells and patients resistant to chemotherapy. While some miRNAs are thought prognostic or diagnostic biomarkers for gastric cancer, our study is the first to explore their promising use in terms of DDP response. Besides, our observations indicated that higher levels of miR-181a-2-3pserum + tumor was a better biomarker than miR-181a-2-3pserum or miR-181a-2-3ptumor for chemoresistance in GC patients. miR-181a-2-3pserum + tumor could gain an AUC of 0.926. The equation was 0.591 × miR-181a-2-3pserum + 0.729 × miR-181a-2-3ptumor + 0.231. A large cohort analysis was performed via Kaplan–Meier survival data based on OncoLnc database, Kaplan–Meier Plotter database, OncomiR database, and Starbase database in order to find out the function of miR-181a-2-3p as a potential prognostic factor. The results suggested that miR-181a-2-3p overexpression could function as a valid biomarker for poor overall survival and chemoresistance.
Previous studies have shown that in cervical cancer, miR-181a-2-3p was crucial for the maintenance of cancer stem cells.Citation30 In pancreatic ductal adenocarcinoma, miR-181a-2-3p could function as a biomarker for early detection.Citation31 In this study, increased miR-181a-2-3p was found in DDP resistant GC cell lines and DDP resistant GC patients, and elevated levels of miR-181a-2-3p were correlated with poorer prognosis and worse clinical parameters. In addition, the interrelation between miR-181a-2-3p level and tumor size in this study indicated that miR-181a-2-3p may play an important role in the proliferation of tumor cells. This study revealed that miR-181a-2-3p upregulation increased cell proliferation, and inhibited apoptosis as well. Thus, a proven selective miR-181a-2-3p response modifier might be a viable and attractive treatment option. Some experiments should be performed to clarify the function of miR-181a-2-3p as treatment targets and clinical therapeutic potential.
Summarizing the shortcomings of the study, the sample size in bioinformatics analysis needs to be further expanded, and more animal study or human testing should be carried out in the future.
Conclusion
The present study reported on the potential for miR-181a-2-3p to predict the DDP therapeutic benefit in gastric cancer patients. Targeting oncogenic miR-181a-2-3p could inhibit growth and suppress cisplatin-mediated resistance of gastric cancer. Furthermore, DDP administration combined miR-181a-2-3p downregulation might be a promising therapeutic option for DDP-resistant GC patients in the future.
Author Contributions
All authors contributed to data analysis, drafting or revising the article, have agreed on the journal to which the article will be submitted, gave final approval of the version to be published, and agree to be accountable for all aspects of the work.
Disclosure
The authors report no conflicts of interests.
Acknowledgments
We thank the Scientific Research Start-up Fund of Beijing Friendship Hospital, Capital Medical University (yyqdkt2020-9 and yyqdkt2020-13) for financial support.
References
- Siegel RL, Miller KD, Jemal A. Cancer statistics, 2019. CA Cancer J Clin. 2019;69(1):7–34.30620402
- Colquhoun A, Arnold M, Ferlay J, Goodman KJ, Forman D, Soerjomataram I. Global patterns of cardia and non-cardia gastric cancer incidence in 2012. Gut. 2015;64(12):1881–1888. doi:10.1136/gutjnl-2014-30891525748648
- Ferlay J, Steliarova-Foucher E, Lortet-Tieulent J, et al. Cancer incidence and mortality patterns in Europe: estimates for 40 countries in 2012. Eur J Cancer. 2013;49(6):1374–1403. doi:10.1016/j.ejca.2012.12.02723485231
- Zong L, Abe M, Seto Y, Ji J. The challenge of screening for early gastric cancer in China. Lancet. 2016;388(10060):2606. doi:10.1016/S0140-6736(16)32226-727894662
- Dasari S, Tchounwou PB. Cisplatin in cancer therapy: molecular mechanisms of action. Eur J Pharmacol. 2014;740:364–378. doi:10.1016/j.ejphar.2014.07.02525058905
- Bartel DP. MicroRNAs: genomics, biogenesis, mechanism, and function. Cell. 2004;116(2):281–297. doi:10.1016/S0092-8674(04)00045-514744438
- Sorrentino A, Liu CG, Addario A, Peschle C, Scambia G, Ferlini C. Role of microRNAs in drug-resistant ovarian cancer cells. Gynecol Oncol. 2008;111(3):478–486. doi:10.1016/j.ygyno.2008.08.01718823650
- Yu ZW, Zhong LP, Ji T, Zhang P, Chen WT, Zhang CP. MicroRNAs contribute to the chemoresistance of cisplatin in tongue squamous cell carcinoma lines. Oral Oncol. 2010;46(4):317–322. doi:10.1016/j.oraloncology.2010.02.00220219416
- Goswami RS, Atenafu EG, Xuan Y, et al. MicroRNA signature obtained from the comparison of aggressive with indolent non-Hodgkin lymphomas: potential prognostic value in mantle-cell lymphoma. J Clin Oncol. 2013;31(23):2903–2911. doi:10.1200/JCO.2012.45.305023835716
- Hur K, Toiyama Y, Schetter AJ, et al. Identification of a metastasis-specific MicroRNA signature in human colorectal cancer. J Natl Cancer Inst. 2015;107(3). doi:10.1093/jnci/dju492
- Ueda T, Volinia S, Okumura H, et al. Relation between microRNA expression and progression and prognosis of gastric cancer: a microRNA expression analysis. Lancet Oncol. 2010;11(2):136–146. doi:10.1016/S1470-2045(09)70343-220022810
- Giovannetti E, Erozenci A, Smit J, Danesi R, Peters GJ. Molecular mechanisms underlying the role of microRNAs (miRNAs) in anticancer drug resistance and implications for clinical practice. Crit Rev Oncol Hematol. 2012;81(2):103–122. doi:10.1016/j.critrevonc.2011.03.01021546262
- Fang Y, Shen H, Li H, et al. miR-106a confers cisplatin resistance by regulating PTEN/Akt pathway in gastric cancer cells. Acta Biochim Biophys Sin. 2013;45(11):963–972. doi:10.1093/abbs/gmt10624108762
- Jin L, Ma XM, Wang TT, et al. Psoralen suppresses cisplatin-mediated resistance and induces apoptosis of gastric adenocarcinoma by disruption of the miR196a-HOXB7-HER2 axis. Cancer Manag Res. 2020;12:2803–2827. doi:10.2147/CMAR.S24809432368152
- Jin L, Zhang N, Zhang Q, Ding G, Yang Z, Zhang Z. Serum microRNAs as potential new biomarkers for cisplatin resistance in gastric cancer patients. PeerJ. 2020;8:e8943. doi:10.7717/peerj.894332328349
- Hong WS, Saijo N, Sasaki Y, et al. Establishment and characterization of cisplatin-resistant sublines of human lung cancer cell lines. Int J Cancer. 1988;41(3):462–467. doi:10.1002/ijc.29104103253346112
- Yu DS, Ma CP, Chang SY. Establishment and characterization of renal cell carcinoma cell lines with multidrug resistance. Urol Res. 2000;28(2):86–92. doi:10.1007/s00240005014310850629
- Choi H, Charnsangavej C, Faria SDC, et al. CT evaluation of the response of gastrointestinal stromal tumors after imatinib mesylate treatment: a quantitative analysis correlated with FDG PET findings. Am J Roentgenol. 2004;183(6):1619–1628. doi:10.2214/ajr.183.6.0183161915547201
- Zhang Y, Xu W, Ni P, Li A, Zhou J, Xu S. MiR-99a and MiR-491 regulate cisplatin resistance in human gastric cancer cells by targeting CAPNS1. Int J Biol Sci. 2016;12(12):1437–1447. doi:10.7150/ijbs.1652927994509
- Anaya J. OncoLnc: linking TCGA survival data to mRNAs, miRNAs, and lncRNAs. PeerJ Comput Sci. 2016;2:e67. doi:10.7717/peerj-cs.67
- Wong NW, Chen Y, Chen S, Wang X. OncomiR: an online resource for exploring pan-cancer microRNA dysregulation. Bioinformatics. 2018;34(4):713–715. doi:10.1093/bioinformatics/btx62729028907
- Szász AM, Lánczky A, Nagy Á, et al. Cross-validation of survival associated biomarkers in gastric cancer using transcriptomic data of 1065 patients. Oncotarget. 2016;7(31):49322–49333. doi:10.18632/oncotarget.1033727384994
- Nagy A, Lanczky A, Menyhart O, Gyorffy B. Validation of miRNA prognostic power in hepatocellular carcinoma using expression data of independent datasets. Sci Rep. 2018;8(1):9227. doi:10.1038/s41598-018-27521-y29907753
- Li T, Li D, Sha J, Sun P, Huang Y. MicroRNA-21 directly targets MARCKS and promotes apoptosis resistance and invasion in prostate cancer cells. Biochem Biophys Res Commun. 2009;383(3):280–285. doi:10.1016/j.bbrc.2009.03.07719302977
- Xia L, Zhang D, Du R, et al. miR-15b and miR-16 modulate multidrug resistance by targeting BCL2 in human gastric cancer cells. Int J Cancer. 2008;123(2):372–379. doi:10.1002/ijc.2350118449891
- Yang H, Kong W, He L, et al. MicroRNA expression profiling in human ovarian cancer: miR-214 induces cell survival and cisplatin resistance by targeting PTEN. Cancer Res. 2008;68(2):425–433. doi:10.1158/0008-5472.CAN-07-248818199536
- Yang SM, Huang C, Li XF, Yu MZ, He Y, Li J. miR-21 confers cisplatin resistance in gastric cancer cells by regulating PTEN. Toxicology. 2013;306:162–168. doi:10.1016/j.tox.2013.02.01423466500
- Jin L, Zhang Z. Serum miR-3180-3p and miR-124-3p may function as noninvasive biomarkers of cisplatin resistance in gastric cancer. Clin Lab. 2020;66(12). doi:10.7754/Clin.Lab.2020.200302
- Ng EK, Chong WW, Jin H, et al. Differential expression of microRNAs in plasma of patients with colorectal cancer: a potential marker for colorectal cancer screening. Gut. 2009;58(10):1375–1381. doi:10.1136/gut.2008.16781719201770
- Chhabra R. let-7i-5p, miR-181a-2-3p and EGF/PI3K/SOX2 axis coordinate to maintain cancer stem cell population in cervical cancer. Sci Rep. 2018;8(1):7840. doi:10.1038/s41598-018-26292-w29777148
- Khan IA, Rashid S, Singh N, et al. Panel of serum miRNAs as potential non-invasive biomarkers for pancreatic ductal adenocarcinoma. Sci Rep. 2021;11(1):2824. doi:10.1038/s41598-021-82266-533531550