
 ?Mathematical formulae have been encoded as MathML and are displayed in this HTML version using MathJax in order to improve their display. Uncheck the box to turn MathJax off. This feature requires Javascript. Click on a formula to zoom.
Abstract
Background
Lung cancer has the characteristics of early metastasis, high recurrence, and high mortality rate despite emerging advances in diagnostic. Early diagnosis can significantly improve the patient’s chances of cure and survival.
Purpose
This study aimed to identify and assess a prognostic lncRNA/miRNA/gene signature in patients with lung cancer.
Methods
Pearson correlation analysis, univariate Cox analysis and LASSO Cox analysis were used to construct a lung cancer prognostic risk model based on m6A-related lncRNA. The interaction between lncRNA-miRNA-gene was verified by luciferase reporter gene experiment.
Results
The Pearson correlation analysis determined that 1655 lncRNAs significantly correlated with the expression of m6A genes. A lung cancer prognostic risk model, including 14 m6A-related lncRNAs, was constructed through univariate Cox analysis and least absolute shrinkage and selection operator (LASSO) Cox analysis. ABALON was identified as the key lncRNA through cluster analysis and gene expression difference analysis.
Conclusion
It was experimentally verified that ABALON acted as a competing endogenous RNA by sponging miR-139-3p and indirectly regulated the expression of NOB1. This study provided a new biological target for the early diagnosis of lung cancer and a new direction for studying the mechanism of lung cancer.
Introduction
Lung cancer remains the leading cause of cancer-related death worldwide, and the high incidence rates are worrisome.Citation1 The five-year survival rate for lung cancer is only 18%, and early diagnosis can significantly improve the patient’s chances of cure and survival.Citation2 Although many advances have been made in the diagnosis and treatment of lung cancer in recent years, the understanding of lung cancer prognostic molecular markers is still lacking.Citation3 Epigenetic modifiers, including long coding RNAs (lncRNAs) and microRNAs (miRNAs), have important roles in the development and progression of lung cancer.Citation4,Citation5 Thus, it is particularly important to further explore new lncRNAs and miRNAs as diagnostic targets of lung cancer and clarify their molecular mechanisms.
LncRNAs are noncoding transcripts usually longer than 200 nt that have recently emerged as one of the largest and significantly diverse RNA families and can modulate various biological functions at epigenetic, transcriptional, and posttranscriptional levels, or directly regulate protein activity.Citation6,Citation7 MiRNAs are small RNAs that regulate the expression of complementary messenger RNAs (mRNAs) and can regulate tumor progression and metastasis by interacting with target genes.Citation8,Citation9 Studies have shown that lncRNAs act as competing endogenous RNA (ceRNA) by sponging miRNAs and indirectly regulate gene expression and then participate in the occurrence of cancer, including lung cancer.Citation10–Citation14 N6-methyladenosine (m6A) modification, the most abundant epigenetic methylated modification of mRNAs and noncoding RNAs (ncRNAs), is vital in RNA splicing, export, stability, and translation.Citation15,Citation16 Numerous studies show that m6A mediates the occurrence and development of lung cancer by regulating biological processes such as glycolysis and cell cycle.Citation17–Citation19 Furthermore, certain m6A regulatory proteins responsible for abnormal m6A modifications on ncRNAs are also involved in cancer cell proliferation, invasion, and drug resistance, suggesting a potential association between cancer and m6A ncRNA modification, and thus, offering a new opportunity for cancer diagnosis and treatment.Citation20,Citation21
Based on The Cancer Genome Atlas (TCGA) dataset (n = 1145), the prognostic significance of m6A-related lncRNAs was identified by bioinformatics and statistical analysis of data from lung cancer tissue samples and adjacent nontumor tissue samples. This study showed that 22 m6A-related lncRNAs were significantly related to the survival of lung cancer. Also, a prognostic risk model for lung cancer was constructed through LASSO Cox analysis. After a series of differential analysis of prognostic-related m6A-related lncRNAs, finally, ABALON was determined as the key lncRNA. Using the miRDB, miRTarBase, and TargetScan websites, it was predicted that miR-139-3p could target ABALON and NOB1. Finally, it was experimentally verified that ABALON acted as a ceRNA by sponging miR-139-3p and indirectly regulated the expression of NOB1.
This study showed that ABALON could be used as a new marker for the diagnosis of lung cancer and verified the possible molecular mechanism of ABALON in the occurrence of lung cancer.
Materials and Methods
Acquisition and Re-Annotation of Public Data
The gene expression quantification data and the corresponding clinical information of patients with lung cancer were obtained from TCGA data portal (https://tcga-data.nci.nih.gov/tcga/). The obtained population included 1037 lung cancer tissue samples and 108 adjacent nontumor tissue samples. After obtaining the raw lung cancer data from TCGA database, the data were re-annotated using the gene transfer format (ftp://ftp.ensembl.org/pub/release-89/gtf/homo_sapiens/), and the RNA properties (mRNA and lncRNA) were recorded.
Co-Expression Analysis of m6A-Related Genes and lncRNA
According to previous studies, 23 m6A-related genes (METTL3, METTL14, METTL16, WTAP, VIRMA, ZC3H13, RBM15, RBM15B, YTHDC1, YTHDC2, YTHDF1, YTHDF2, YTHDF3, HNRNPC, FMR1, LRPPRC, HNRNPA2B1, IGFBP1, IGFBP2, IGFBP3, RBMX, FTO, and ALKBH5) were compiled,Citation22–Citation25 and the expression data of these 23 genes in 514 samples were extracted. Subsequently, the co-expression analysis of m6A-related genes and lncRNAs was performed to determine the m6A-related lncRNAs, and a co-expression network of m6A-related genes and lncRNAs was constructed. The correlation between the m6A-related genes and lncRNAs was calculated using Pearson’s method. LncRNAs with an absolute value of correlation coefficients >0.4 and P values <0.001 were considered immune-related lncRNAs.
Identification of Prognostic-Related m6A-Related lncRNAs
The survival status and survival time data of lung cancer samples were extracted and merged with the expression data of m6A-related lncRNAs, the clinical information is shown in Supplementary Table 1. The “survival” package of the R software was used to compare all lncRNAs with the survival time and survival status to determine the prognostic-related lncRNAs. Immediately, the K-means algorithm was used to analyze the survival of these lncRNAs in patients with lung cancer to determine more credible survival-related lncRNAs. A P value ≤0.01 was considered statistically significant.
Construction of the Prognostic Model
The LASSO method was used to select key prognostic- and m6A-related lncRNAs from the lncRNAs found to be significant in the univariate Cox analysis. Most potential indicators were shrunk to zero, and a relatively small number of indicators remained with weights of nonzero. Finally, the key prognostic- and m6A-related lncRNAs were used to construct a prognostic model and generate a forest map. The risk score of each patient with lung cancer was calculated as follows:
where Coefi means the coefficients and xi is the fragments per kilobase of transcript per million mapped reads normalized expression value of each m6A-related lncRNAs.
Assessment of the Prognostic Model
All patients with lung cancer were randomly divided into two groups: the train and test groups. Then, these two groups were further divided into high- and low-risk groups using the median value of the risk value as the dividing line. The Kaplan–Meier survival curves between the train and test groups were analyzed and drawn using the “survival” and “survminer” package of the R software. The time-dependent receiver operating characteristic (ROC) curve analysis (1, 3, and 5 years) was performed to estimate the survival predictive accuracy of the prognostic model. The performance of the prognostic model was evaluated by assessing the area under the ROC (AUC) curve. The risk scores were calculated based on the formula generated through the LASSO Cox regression model. Patient’s age, sex, cancer stage, and other data were preprocessed and then integrated with the risk value. Then, single- and multifactor independent prognostic analyses were performed using the “survival” package of the R software.
Cluster and Gene Set Enrichment Analysis of lncRNAs
All samples were clustered based on the expression levels of lncRNAs, which significantly related to lung cancer survival in univariate Cox analysis, and a survival analysis was conducted for different clusters by “ConsensusClusterPlus,” “survival,” and “survminer” package of the R software. For investigating the potential biological process and pathway involved in the molecular heterogeneity between the different clusters, the gene set enrichment analysis (GSEA) software was used on different clusters. A P value ≤0.05 was considered statistically significant.
Immune Infiltration and Tumor Microenvironment Analysis
Configuration files of gene expression in 22 immune cells were obtained using the CIBERSORT software, which were combined with the gene expression matrix of lung cancer samples to obtain the content of 22 immune cells in each sample. Then, the difference analysis of immune cells was carried out between different clusters. ESTIMATE was used to perform matrix scoring and immune scoring on all lung cancer samples, and the differences were analyzed in stromal cell and immune cell content between different clusters. The “LIMMA” package of the R software was used to analyze whether a correlation existed between the 22 immune cells and the risk score of patients with lung cancer. A P-value ≤0.05 was considered statistically significant.
Model lncRNA Differential Expression Analysis
The “ggplot2” and “ggpubr” package of the R software was used to analyze the differences in the expression of model lncRNAs between different cancer and normal samples, different clusters, and high- and low-risk groups to further confirm which lncRNAs have a key role in the model and provide a clearer direction for follow-up research. A P-value ≤0.05 was considered statistically significant.
Subcellular Localization and Target Gene Prediction
First, the lncLocator online database (http://www.csbio.sjtu.edu.cn/bioinf/lncLocator/) was used for subcellular localization of the key lncRNA, and the target miRNA was predicted through miRDB (http://mirdb.org/custom.html). Second, 1037 lung cancer tissue samples and 108 adjacent nontumor tissue samples were obtained through differential analysis of miRNA expression data to find miRNAs that were differentially expressed between patients with lung cancer and normal samples. |log2 fold change| >2 and P <0.05 were considered statistically significant. The miRNAs that were highly expressed in normal lung cancer samples and bound to key lncRNAs were selected as key miRNAs. Finally, three online databases miRDB, miRTarBase (http://mirtarbase.cuhk.edu.cn/php/index.php), and TargetScan (http://www.targetscan.org/) were used to predict the target genes of key miRNAs. The genes predicted by all three websites were identified as candidate target genes. The Gene Expression Profiling Interactive Analysis (GEPIA) online database (http://gepia.cancer-pku.cn/) was used to analyze the differential expression and survival of candidate genes, and find genes highly expressed in lung cancer samples and significantly related to poor prognosis as the final target genes of key miRNAs.
Vector Construction, Cell Culture, and Luciferase Reporter Gene Assay
MiR-139-3p (UCUACAGUGCACGUGUCUCCAGU) mimics, miR-139-3p inhibitors (ACUGGAGACACGUGCACUGUAGA), mimics negative control (NC) (UUCUUCGAACGUGUCACGUTT), and inhibitor NC (CAGUACUUUUGUGUAGUACAA) oligonucleotide primers were chemically synthesized (Gene Pharma, Shanghai, China). The 461-bp nucleotide sequence of the downstream noncoding region of NOB1 and the RNA sequence of ABALON were chemically synthesized and constructed between the XhoI and NotI restriction sites of the psi-Check2 vector to construct the NOB1 wild-type 3′ untranslated region (UTR) vector and the ABALON wild-type (WT) vector. A point mutation method was used to replace the bases at the binding position of miR-139-3p in NOB1 and ABALON, and the NOB1 mutant-type 3′ UTR vector and ABALON mutant-type (MUT) vector were constructed. The NOB1 wild-type 3′ UTR vector, NOB1 mutant-type 3′ UTR vector, ABALON wild-type vector, ABALON mutant-type vector, miR-139-3p mimics, mimic NC, miR-139-3p inhibitors, and inhibitor NC were transfected in cells at 20nM using the Lipofectamine 3000 Transfection Reagent (Invitrogen, CA, USA) with serum-free media for 48 h following the manufacturer’s instructions (the amount of plasmids used was 2 μg/well). The luciferase reporter assay was performed using the Dual-Luciferase Reporter Assay System (Promega, WI, USA), and the relative luciferase activity was calculated after transfection for 48 h by normalizing the firefly luminescence to that of Renilla. Each experiment consisted of three technical replicates, and three independent biological replicates were performed.
Statistical Analysis
Most of the statistical analyses were performed using the aforementioned bioinformatics tools. When differential expression analysis was conducted, only lncRNAs with |log2 fold change| >1 and P <0.05 were considered statistically significant. In the univariate Cox analyses, P <0.05 was regarded as statistically significant for survival analysis and model building; *P <0.05, **P <0.01, and ***P <0.001. All calculations and analyses were conducted using the R software, version 4.0.3.
Results
Identification of Prognostic- and m6A-Related lncRNAs in Patients with Lung Cancer
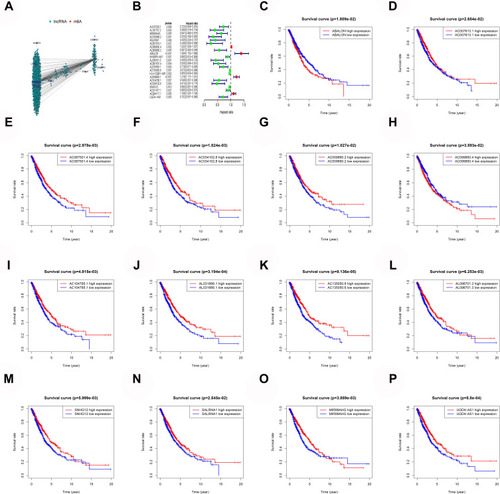
By sorting out and re-annotating TCGA lung cancer expression data, 14,086 lncRNAs were identified. The Pearson correlation analysis showed that 1655 lncRNAs significantly correlated with the expression of m6A genes (). The univariate Cox analysis revealed 22 lncRNAs that were significantly related to the survival of patients with lung cancer (). The KM survival analysis showed that MIR99AHG, SALRNA1, AC007613.1, AC099850.4, AC009690.2, ABALON, AL096701.3, AC087501.4, AL031666.1, AC135050.6, AC104785.1, AC034102.8, SNHG12, and UGDH.AS1 were significantly related to survival (–).
Figure 1 Mining of m6A-related lung cancer prognostic lncRNAs. (A) Interaction network of m6A genes and lncRNA. (B) m6A-related lung cancer prognostic lncRNAs. (C–P) Survival of ABALON, AC007613.1, AC087501.4, AC034102.8, AC009690.2, AC099850.4, AC104785.1, AL031666.1, AC135050.6, AL096701.3, SALRNA1, MIR99AHG and UGDH.AS1.
Prognostic Model Construction and Assessment
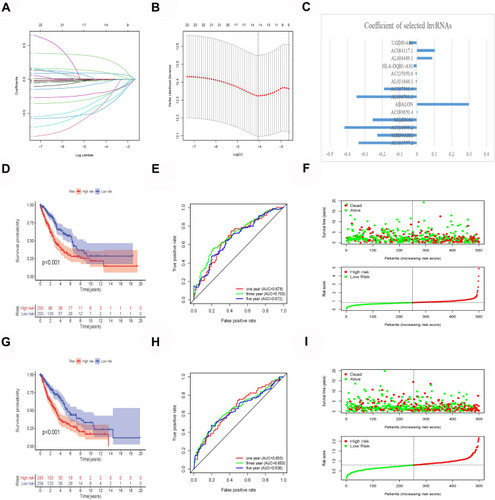
Using the LASSO Cox analysis of 24 m6A-related prognostic lncRNAs, a lung cancer prognostic risk model was constructed containing 14 m6A-related lncRNAs. (–). Significant survival differences were found between the high- and low-risk groups in the train and test groups, and the Kaplan–Meier survival curves depicted that patients with lung cancer with higher risk scores had worse clinical outcomes (). The AUC value of the 1-, 3-, and 5-year ROC curves of the train and test groups was 0.678, 0.703, 0.672, 0.665, 0.653, and 0.638, respectively, demonstrating that the lung cancer prognostic risk model had good predictive accuracy (). The risk score and survival status distributions are plotted in .
Figure 2 Construction and verification of prognostic risk model. (A and B) Least absolute shrinkage and selection operator (LASSO) regression determines the minimum criteria. (C) Coefficients of selected lncRNAs. (D) Kaplan–Meier curves showed that the high-risk group had worse overall survival than the low-risk group in the train group. (E) The AUC values of the 1-, 3-, and 5-year ROC curves of the train group are all greater than 0.6, indicating that the model has good prediction accuracy. (F) Distributions of risk scores and survival status of lung cancer patients in the train group. (G) Kaplan–Meier curves showed that the high-risk group had worse overall survival than the low-risk group in the test group. (H) The AUC values of the 1-, 3-, and 5-year ROC curves of the test group are all greater than 0.6, indicating that the model has good prediction accuracy. (I) Distributions of risk scores and survival status of lung cancer patients in the test group.
Cluster and GSEA Analysis Results of lncRNAs
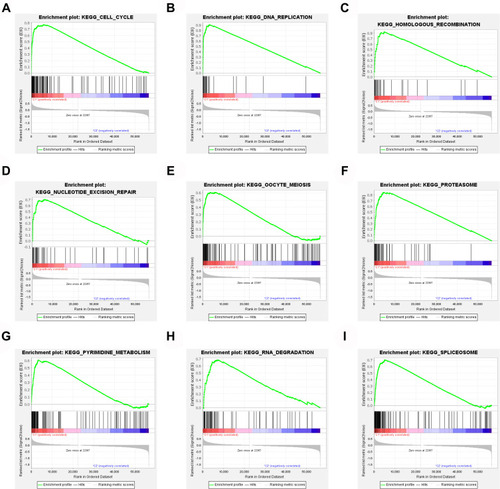
When all the samples were divided into two clusters using cluster analysis, the correlation of the internal samples of the cluster was found to be higher and the correlation between the clusters was lower. All samples were divided into two groups, cluster 1 and cluster 2. The clustering graphs of 2 cluster, 3 cluster, 4 cluster, 5 cluster, 6 cluster, 7 cluster, 8 cluster, and the clustering index graphs of 2–8 cluster are plotted in –. Significant survival differences existed between cluster 1 and cluster 2, and the Kaplan–Meier survival curves depicted that patients with lung cancer in cluster 1 had worse clinical outcomes (). The GSEA revealed that cluster 1 was enriched in signal pathways such as cell cycle, DNA replication, RNA degradation, and so forth. The enrichment of the top 9 sorted is plotted in –.
Figure 3 Cluster analysis. (A–G) The clustering graphs of 2–8 cluster. (H) Clustering index graphs. (I) Kaplan-Meier survival curves show cluster 1 had worse overall survival.
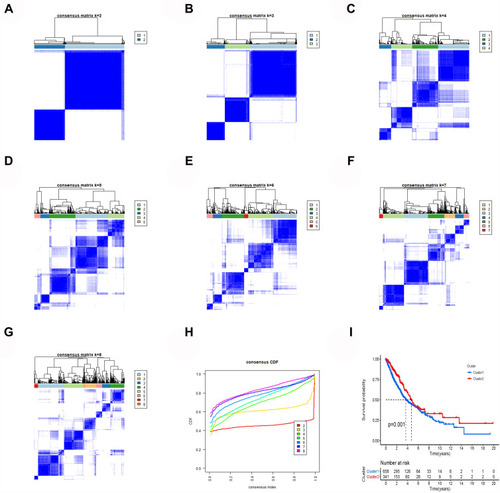
Figure 4 Gene set enrichment analysis. (A) Cell cycle. (B) DNA replication. (C) Homologous recombination. (D) Nucleotide excision repair. (E) Oocyte meiosis. (F) Proteasome. (G) Pyrimidine metabolism. (H) RNA degradation. (I) Spliceosome.
Immune Infiltration and Tumor Microenvironment Results
The analysis of the differences in the content of 22 kinds of immune cells showed 16 kinds of immune cells in cluster 1 and cluster 2 with significant differences (). The immuneScore, stromalScore, and estimateScore of cluster 2 were all higher than those of cluster 1, indicating that cluster 2 had a better prognosis and higher survival rate than cluster 1 (–). Correlation analysis showed that 14 kinds of immune cells were significantly related to the risk score of patients with lung cancer (–).
Figure 5 Immune infiltration and tumor microenvironment. (A) The expression of 22 immune cells between cluster 1 and cluster 2. (B) The immuneScore (C) stromalScore (D) eSTIMATEScore indicating that cluster 1 had a worse overall survival than cluster 2.
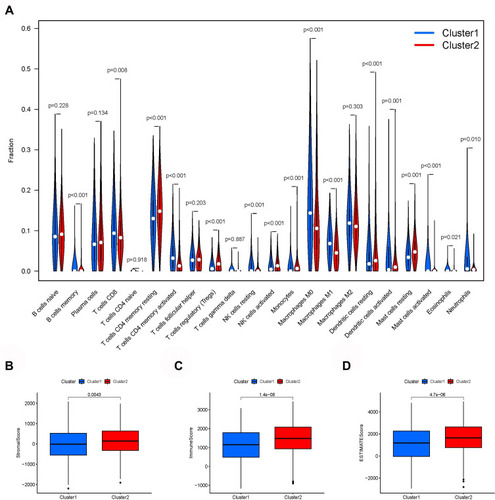
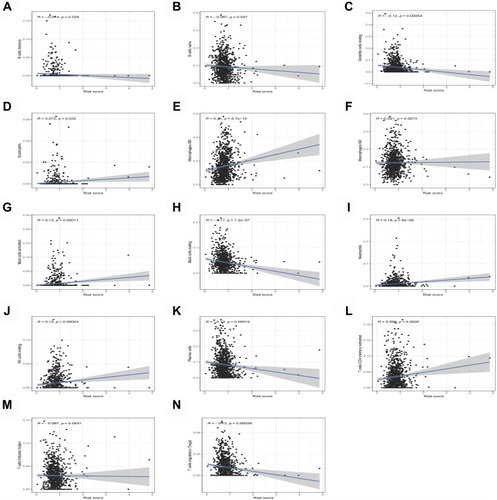
Figure 6 Correlation analysis showed that 14 kinds of immune cells are significantly related to the risk score of lung cancer patients. (A) B cells memory. (B) B cells naive. (C) Dendritic cells resting. (D) Eosinophils. (E) Macrophages M0. (F) Macrophages M2. (G) Mast cells activated. (H) Mast cells resting. (I) Neutrophils. (J) NK cells resting. (K) Plasma cells. (L) T cells CD4 memory activated. (M) T cells follicular helper. (N) T cells regulatory (Tregs).
Model lncRNA Differential Expression Analysis
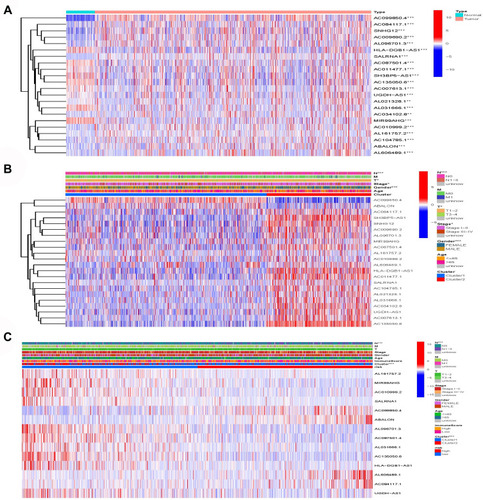
The differential analysis of lncRNAs in lung cancer and normal samples showed that AC099850.4, SNHG12, ABALON, AC084117.1, AC009690.2, and AL096701.3 were significantly highly expressed in patients with lung cancer (). The differential analysis of lncRNAs in cluster 1 and cluster 2 showed that AC099850.4 and ABALON were significantly highly expressed in cluster 1 (). The differential analysis of lncRNAs in high- and low-risk groups showed that AC099850.4, ABALON, AL606489.1, and AC084117.1 were highly expressed in the high-risk group (). The differential analysis results of the three different groups of lncRNAs showed that AC099850.4 and ABALON may be the most critical.
Figure 7 Model lncRNA differential expression. (A) AC099850.4, SNHG12, ABALON, AC084117.1, AC009690.2 and AL096701.3 were significantly high expression in lung cancer patients. (B) AC099850.4 and ABALON were significantly highly expressed in cluster 1. (C) AC099850.4, ABALON, AL606489.1 and AC084117.1 were highly expressed in high-risk group.
ABALON Subcellular Localization and Target Prediction
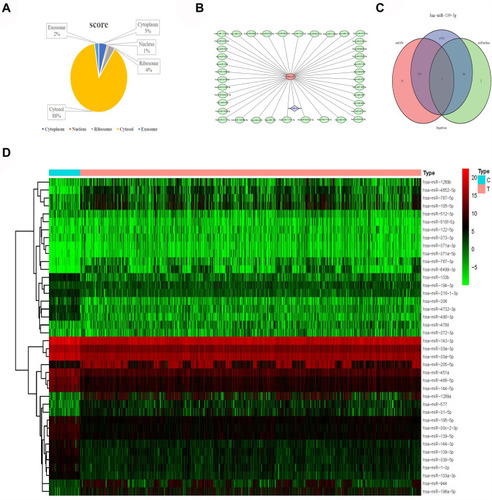
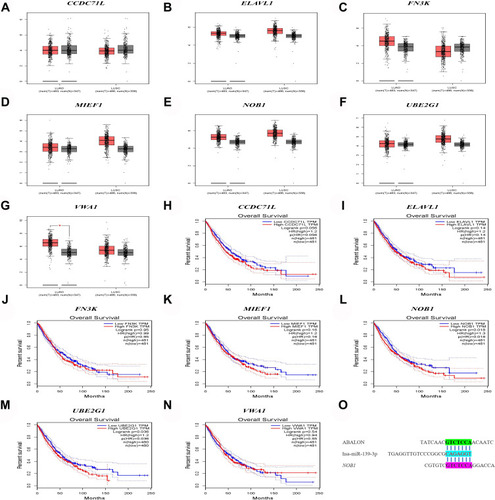
The prediction results of the lncLocator website showed that ABALON was mainly located in Cytosol, accounting for about 88% (). The miRDB results showed that 40 miRNAs could bind to ABALON (). The results of differential analysis of miRNAs showed that miR-486-5p, miR-4732-3p, miR-144-5p, miR-451, miR-139-3p, miR-144-3p, miR-30c-2-3p, miR-490-3p, miR-30a-3p, miR-133b, miR-30a-5p, miR-1-3p, miR-194-3p, miR-133a-3p, miR-143-3p, miR-206, miR-195-5p, miR-139-5p, miR-338-5p, miR-218-1-3p, miR-218-5p, miR-4529-3p, and miR-190a-5p were highly expressed in the lung of normal patients (). Only one intersection was present between these highly expressed miRNAs and the ABALON target miRNAs, that is, miR-139-3p; therefore, miR-139-3p was selected as the key miRNA. The three databases miRDB, miRTarBase, and TargetScan all showed that miR-139-3p could specifically bind to VWA1, MIEF1, NOB1, CCDC71L, FN3K, UBE2G1, and ELAVL1 ().
Figure 8 Subcellular localization and target prediction of lncRNA ABALON. (A) The subcellular localization results show that ABALON is mainly enriched in Cytosol. (B) The miRDB results showed that 40 miRNAs can bind to ABALON. (C) VWA1, MIEF1, NOB1, CCDC71L, FN3K, UBE2G1 and ELAVL are the target genes of miR-139-3p. (D) miR-486-5p, miR-4732-3p, miR-144-5p, miR-451, miR-139-3p, miR-144-3p, miR-30c-2-3p, miR-490-3p, miR-30a-3p, miR-133b, miR-30a-5p, miR-1-3p, miR-194-3p, miR-133a-3p, miR-143-3p, miR-206, miR-195-5p, miR-139-5p, miR-338-5p, miR-218-1-3p, miR-218-5p, miR-4529-3p and miR-190a-5p were highly expressed in lung cancer normal patients.
Differential Analysis and Survival Analysis of miR-139-3p Target Genes
The differential analysis and survival analysis of miR-139-3p by GEPIA showed that ELAVL1, MIF1, NOB1, and VWA1 were highly expressed in patients with lung cancer (not significant). Also, NOB1 and UBE2G1 were significantly related to the survival of patients with lung cancer, and the high expression of NOB1 and UBE2G1 led to a low survival rate and poor prognosis (–). NOB1 was selected as the target gene of miR-139-3p, and the combination of ABALON, miR-139-3p, and NOB1 is plotted in .
Figure 9 Differential expression and survival analysis of target genes. (A–G) The expression of CCDC71L, ELAVL, FN3K, MIEF1, NOB1, UBE2G1, VWA1 between lung cancer samples and normal samples. (H–N) Kaplan-Meier survival curves of CCDC71L, ELAVL, FN3K, MIEF1, NOB1, UBE2G1, VWA1 between lung cancer samples and normal samples. (O) ABALON-miR-139-3p-NOB1 base complementary binding situation.
ABALON Acted as a ceRNA by Sponging miR-139-3p and Indirectly Regulated the Expression of NOB1
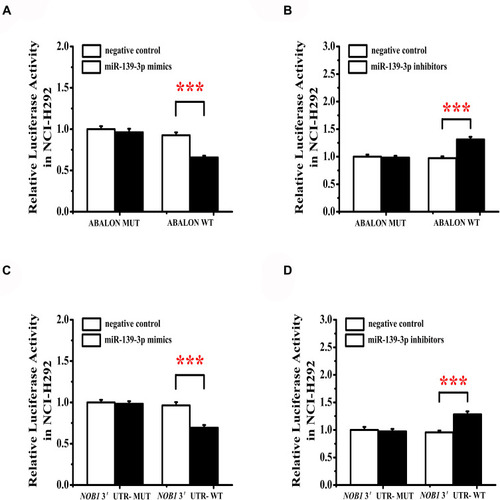
The luciferase reporter gene assay results showed that cells were cotransfected with ABALON-WT and miR-139-3p mimics, which resulted in a significantly reduced activity of the luciferase reporter gene, yet the luciferase activity was not significantly attenuated in the target region of the mutated ABALONR-MUT construct (). When cotransfected with ABALON-WT and miR-139-3p inhibitors, the activity of the luciferase reporter gene significantly upregulated, but the ABALONR-MUT construct had no such change (). The luciferase reporter gene assay results also showed that miR-139-3p mimics could bind to and inhibit the expression of NOB1 (), while miR-139-3p inhibitors could eliminate this effect ().
Figure 10 miR-139-3p targets ABALON and NOB1. (A) MiR-139-3p mimics target binding and reduce ABALON expression. (B) MiR-139-3p inhibitors can increase the activity of ABALON. (C) MiR-139-3p mimics target binding and reduce NOB1 expression. (D) MiR-139-3p inhibitors can increase the activity of NOB1. ***<0.001.
Discussion
Lung cancer is the most leading cause of cancer deaths in men worldwide, especially in China. Despite recent advances in diagnostics and treatment, the prognosis of patients with lung cancer remains poor.Citation26,Citation27 Most patients were diagnosed with distant metastasis, which was often accompanied by a poor prognosis, and the pathogenesis of lung cancer at the molecular level was not clear.Citation28,Citation29 Therefore, the identification of more effective biomarkers for diagnosis and treatment was urgently needed.
In this study, by integrating the expression data and clinical information of 1037 cancer samples and 108 normal samples, a co-expression analysis of 23 m6A genes and 14,086 lncRNAs was performed, an m6A gene–lncRNA co-expression network was constructed, and 1655 m6A-related lncRNAs were determined in patients with lung cancer. Using univariate Cox analysis and LASSO Cox analysis, this study constructed a lung cancer prognostic risk model based on m6A-related lncRNA. The AUC values of the 1-, 3-, and 5-year ROC curves of the train and test groups were all greater than 0.06, demonstrating that the prognostic risk model had good predictive accuracy. Cluster analysis, immune analysis, and GSEA analysis showed that the lncRNAs of the lung cancer prognostic risk model constructed was mainly involved in cell cycle, DNA replication, RNA degradation, and other biological processes, and was significantly related to immunity. This implied that the concerned lncRNAs may participate in the occurrence of lung cancer by regulating the cell cycle and RNA expression.
ABALON is an antisense long noncoding RNA of apoptotic BCL2L1, with a length of 1903 bp, mainly enriched in Cytosol.Citation30 Currently, no study has reported on ABALON. The average expression of ABALON in the patients with lung cancer was higher than that of normal samples, although the difference was not significant. Patients with lung cancer with high expression of ABALON had a lower survival rate and poor prognosis. This implied that ABALON was important in the occurrence of lung cancer. Studies have shown that miR-139-3p could inhibit the proliferation, migration, and invasion of a variety of cancer cells,Citation31–Citation36 including lung cancer.Citation37 The high expression of miR-139-3p also significantly positively correlated with a better cancer prognosis.Citation38 In vivo and in vitro studies have shown that NOB1 could promote the proliferation and tumor growth of lung cancer cells.Citation39,Citation40 The ABALON-miR-139-3p-NOB1 ceRNA regulatory network was excavated and constructed through bioinformatics methods. It was experimentally verified that ABALON acted as a ceRNA by sponging miR-139-3p and indirectly regulated NOB1 expression through the luciferase report experiment. These experimental results further increased the reliability of the lung cancer lncRNA prognostic risk model constructed in this study and provided new ideas for the research on the occurrence and development of lung cancer.
Although a large number of sample data has been found and integrated bioinformatics analysis of the lung cancer lncRNA and miRNA was conducted, still many deficiencies exist. On the one hand, the subcellular location of ABALON was predicted through the lncLocator online website. The ABALON fluorescence in situ hybridization should be performed to evaluate the subcellular localization of lncRNA more accurately. On the other hand, the effect of ABALON could not be verified on lung cancer cell proliferation and tumor formation in vivo and in vitro, which should be an important part of future studies.
Conclusions
In summary, this study constructed an m6A-related lncRNA lung cancer prognostic risk model by analyzing the expression data and clinical data of TCGA lung cancer samples. It was experimentally verified that ABALON acted as a ceRNA by sponging miR-139-3p and indirectly regulated NOB1 expression. This study provided a new biological target for the early diagnosis of lung cancer and a new direction for studying the mechanism of lung cancer.
Ethical Statement
This study protocol was approved by the Ethics Committee of Chongqing Collaborative Innovation Center for Functional Food (2021041001H, Chongqing, China).
Disclosure
The authors declare that they have no conflicts of interest.
References
- Chen R, Xu X, Qian Z, et al. The biological functions and clinical applications of exosomes in lung cancer. Cell Mol Life Sci. 2109;76(23):4613–4633. doi:10.1007/s00018-019-03233-y
- Quintanal-Villalonga Á, Molina-Pinelo S. Epigenetics of lung cancer: a translational perspective. Cell Oncol. 2019;42(6):739–756. doi:10.1007/s13402-019-00465-9
- Han W, Ren X, Yang Y, et al. microRNA-100 functions as a tumor suppressor in non-small cell lung cancer via regulating epithelial-mesenchymal transition and Wnt/β-catenin by targeting HOXA1. Thorac Cancer. 2020;11(6):1679–1688. doi:10.1111/1759-7714.1345932364673
- Reck M, Heigener DF, Mok T, et al. Management of non-small-cell lung cancer: recent developments. Lancet. 2013;382(9893):709–719. doi:10.1016/S0140-6736(13)61502-023972814
- Forde PM, Brahmer JR, Kelly RJ. New strategies in lung cancer: epigenetic therapy for non-small cell lung cancer. Clin Cancer Res. 2014;20(9):2244–2248. doi:10.1158/1078-0432.CCR-13-208824644000
- Paraskevopoulou MD, Hatzigeorgiou AG. Analyzing miRNA-lncRNA interactions. Methods Mol Biol. 2106;1402:271–286. doi:10.1007/978-1-4939-3378-5_21
- Huang Y. The novel regulatory role of lncRNA-miRNA-mRNA axis in cardiovascular diseases. J Cell Mol Med. 2018;22(12):5768–5775. doi:10.1111/jcmm.1386630188595
- Ambros V. The functions of animal microRNAs. Nature. 2004;431(7006):350–355. doi:10.1038/nature0287115372042
- Tutar Y. miRNA and cancer; computational and experimental approaches. Curr Pharm Biotechnol. 2014;15(5):429. doi:10.2174/13892010150514082816133525189575
- Zhao Y, Feng C, Li Y, et al. LncRNA H19 promotes lung cancer proliferation and metastasis by inhibiting miR-200a function. Mol Cell Biochem. 2019;460(1–2):1–8. doi:10.1007/s11010-019-03564-131187349
- Xu Y, Lin J, Jin Y, et al. The miRNA hsa-miR-6515-3p potentially contributes to lncRNA H19-mediated-lung cancer metastasis. J Cell Biochem. 2019;120(10):17413–17421. doi:10.1002/jcb.2900631131469
- Wang M, Mao C, Ouyang L, et al. Long noncoding RNA LINC00336 inhibits ferroptosis in lung cancer by functioning as a competing endogenous RNA. Cell Death Differ. 2019;26(11):2329–2343. doi:10.1038/s41418-019-0304-y30787392
- Pan J, Fang S, Tian H, et al. lncRNA JPX/miR-33a-5p/Twist1 axis regulates tumorigenesis and metastasis of lung cancer by activating Wnt/β-catenin signaling. Mol Cancer. 2020;19(1):9. doi:10.1186/s12943-020-1133-931941509
- Zhen Q, Gao LN, Wang RF, et al. LncRNA DANCR promotes lung cancer by sequestering miR-216a. Cancer Control. 2018;25(1):107327481876984. doi:10.1177/1073274818769849
- Zhao BS, Roundtree IA, He C. Post-transcriptional gene regulation by mRNA modifications. Nat Rev Mol Cell Biol. 2017;18(1):31–42. doi:10.1038/nrm.2016.13227808276
- Dai D, Wang H, Zhu L, et al. N6-methyladenosine links RNA metabolism to cancer progression. Cell Death Dis. 2018;9(2):124. doi:10.1038/s41419-017-0129-x29374143
- Yang X, Shao F, Guo D, et al. WNT/β-catenin-suppressed FTO expression increases m6A of c-Myc mRNA to promote tumor cell glycolysis and tumorigenesis. Cell Death Dis. 2021;12(5):462. doi:10.1038/s41419-021-03739-z33966037
- Shi Y, Fan S, Wu M, et al. YTHDF1 links hypoxia adaptation and non-small cell lung cancer progression. Nat Commun. 2019;10(1):4892. doi:10.1038/s41467-019-12801-631653849
- Lou X, Ning J, Liu W, et al. YTHDF1 promotes cyclin B1 translation through m6A modulation and contributes to the poor prognosis of lung adenocarcinoma with KRAS/TP53 co-mutation. Cells. 2021;10(7):1669. doi:10.3390/cells1007166934359836
- Chen Y, Lin Y, Shu Y, et al. Interaction between N6-methyladenosine (m6A) modification and noncoding RNAs in cancer. Mol Cancer. 2020;19(1):94. doi:10.1186/s12943-020-01207-432443966
- Ma JZ, Yang F, Zhou CC, et al. METTL14 suppresses the metastatic potential of hepatocellular carcinoma by modulating N6 -methyladenosine-dependent primary microRNA processing. Hepatology. 2017;65(2):529–543. doi:10.1002/hep.2888527774652
- Meyer KD, Jaffrey SR. Rethinking m6A readers, writers, and erasers. Annu Rev Cell Dev Biol. 2017;33:319–342. doi:10.1146/annurev-cellbio-100616-06075828759256
- Zaccara S, Ries RJ, Jaffrey SR. Reading, writing and erasing mRNA methylation. Nat Rev Mol Cell Biol. 2019;20(10):608–624. doi:10.1038/s41580-019-0168-531520073
- Shi H, Wei J, He C. Where, when, and how: context-dependent functions of RNA methylation writers, readers, and erasers. Mol Cell. 2019;74(4):640–650. doi:10.1016/j.molcel.2019.04.02531100245
- Deng S, Zhang H, Zhu K, et al. M6A2Target: a comprehensive database for targets of m6A writers, erasers and readers. Brief Bioinform. 2021;22(3):bbaa055. doi:10.1093/bib/bbaa05532392583
- Chen W, Zheng R, Baade PD, et al. Cancer statistics in China, 2015. CA Cancer J Clin. 2016;66(2):115–132. doi:10.3322/caac.2133826808342
- Yang Y, Ding L, Hu Q, et al. MicroRNA-218 functions as a tumor suppressor in lung cancer by targeting IL-6/STAT3 and negatively correlates with poor prognosis. Mol Cancer. 2017;16(1):141. doi:10.1186/s12943-017-0710-z28830450
- Travis WD. Update on small cell carcinoma and its differentiation from squamous cell carcinoma and other non-small cell carcinomas. Mod Pathol. 2012;25:S18–S30. doi:10.1038/modpathol.2011.15022214967
- Mao Y, Xue P, Li L, et al. Bioinformatics analysis of mRNA and miRNA microarray to identify the key miRNA-gene pairs in small-cell lung cancer. Mol Med Rep. 2019;20(3):2199–2208. doi:10.3892/mmr.2019.1044131257520
- Cao Z, Pan X, Yang Y, et al. The lncLocator: a subcellular localization predictor for long non-coding RNAs based on a stacked ensemble classifier. Bioinformatics. 2018;34(13):2185–2194. doi:10.1093/bioinformatics/bty08529462250
- Huang P, Xi J, Liu S. MiR-139-3p induces cell apoptosis and inhibits metastasis of cervical cancer by targeting NOB1. Biomed Pharmacother. 2016;83:850–856. doi:10.1016/j.biopha.2016.07.05027505862
- Zou ZC, Dai M, Huang ZY, et al. MicroRNA-139-3p suppresses tumor growth and metastasis in hepatocellular carcinoma by repressing ANXA2R. Oncol Res. 2018;26(9):1391–1399. doi:10.3727/096504018X1517879888536129422116
- Shi L, Yuan Y, Li HY. MicroRNA-139-3p suppresses growth and metastasis of glioblastoma via inhibition of NIN1/RPNI2 binding protein 1 homolog. Eur Rev Med Pharmacol Sci. 2019;23(10):4264–4274. doi:10.26355/eurrev_201905_1793131173298
- Xue F, Li QR, Xu YH, et al. MicroRNA-139-3p inhibits the growth and metastasis of ovarian cancer by inhibiting ELAVL1. Oncol Rep. 2019;12:8935–8945. doi:10.2147/OTT.S210739
- Zhang W, Xu J, Wang K, et al. miR-139-3p suppresses the invasion and migration properties of breast cancer cells by targeting RAB1A. Oncol Rep. 2019;42(5):1699–1708. doi:10.3892/or.2019.729731485677
- Ma Y, Chen Z, Yu G. microRNA-139-3p inhibits malignant behaviors of laryngeal cancer cells via the KDM5B/SOX2 axis and the Wnt/β-Catenin pathway. Cancer Manag Res. 2020;12:9197–9209. doi:10.2147/CMAR.S26887133061611
- Ni ZZ, He JK, Tang X, et al. Identification of ELAVL1 gene and miRNA-139-3p involved in the aggressiveness of NSCLC. Eur Rev Med Pharmacol Sci. 2020;24(18):9453–9464. doi:10.26355/eurrev_202009_2303033015787
- Zhu Y, Zhou C, He Q. High miR-139-3p expression predicts a better prognosis for hepatocellular carcinoma: a pooled analysis. J Int Med Res. 2019;47(1):383–390. doi:10.1177/030006051880272730394818
- Li Y, Ma C, Qian M, et al. Downregulation of NOB1 suppresses the proliferation and tumor growth of non-small cell lung cancer in vitro and in vivo. Oncol Rep. 2020;43(3):1031. doi:10.3892/or.2020.748332020218
- Liu K, Chen HL, Gu MM, et al. NOB1 expression predicts early response to cisplatin-based chemotherapy in patients with advanced non-small cell lung cancer. J Chemother. 2016;28(3):225–229. doi:10.1179/1973947815Y.000000004125971309