
Abstract
Introduction
Colorectal cancer (CRC) represents one of the most frequent human malignancies with its underlying pathogenesis still unclear. The prevalence of multi-omics in screening biomarkers associated with CRC has largely accelerated our understanding into the pathophysiology of CRC. The present work aimed to mine the Gene Expression Omnibus (GEO) datasets associated with CRC studies and identify potential targets correlated with CRC pathogenesis.
Methods
We screened the DEGs in GSE50760 and GSE104178 and performed functional Gene Ontology (GO) enrichment and Kyoto Encyclopedia of Genes and Genomes (KEGG) pathway enrichment analysis. Furthermore, the overlapped DEGs were subjected to functional GO enrichment and KEGG pathway enrichment analysis. The protein–protein interaction (PPI) network and miRNA-mRNA network were constructed based on the overlapped DEGs. The in vitro functional assays including qRT-PCR, caspase-3 and -9 activity assay, wound healing assay, CCK-8 assay and luciferase reporter assay were performed to determine the role of OTOP2/miR-3148 axis in regulating CRC cell progression.
Results
Fifty-three overlapped genes were screened over GSE50760 and GSE104178 and ten hub genes were identified by PPI network analysis. Expression levels of GCG, SST, NPY, GUCA2B, PYY, UCN3, GUCA2A, TMEM82 and BEST4 were not correlated with the overall survival of patients with CRC. However, the high expression of otopetrin 2 (OTOP2) in the CRC tissues was significantly correlated with better overall survival of patients with CRC. The expression of OTOP2 in CRC tissues was significantly lowever than that in normal ones. The in vitro functional assays demonstrated that OTOP2 silence reduced caspase-3/-9 activities, promoted cell migration, proliferation and epithelial–mesenchymal transition in HT29 and SW620 cells. Furthermore, miR-3148 could inversely regulate OTOP2 expression in CRC cell lines.
Conclusion
Collectively, the work suggested the potential role of the OTOP2/miR-3148 axis in the pathophysiology of CRC by mining the GEO database.
Introduction
Colorectal cancer (CRC) represents a common human malignancy, and approximately 1 million patients were diagnosed with this disease annually.Citation1–Citation3 CRC also caused more than 0.6 million deaths worldwide, which has become a serious concern for human health. The incidence of CRC is significantly correlated with the element of a so-called western lifestyle with the incidence being higher in men and being increased with ages.Citation4,Citation5 The development of CRC is heterogeneous, and most CRC patients are sporadic and developed through the adenoma-carcinoma sequence slowly over several years.Citation6 The main treatment for CRC is surgical resection, and for patients with rectal cancer, surgical resection combined with neoadjuvant radiotherapy is often considered. For the patients with stage III/IV and high-risk stage II colon cancer, surgical resection combined with adjuvant chemotherapy is considered.Citation7–Citation9 For the patients with stage I disease, the 5-year overall survival rate of CRC patients is about 90%; while for the patients with advanced stage, the 5-year overall survival rate of CRC patients is about 20%.Citation7–Citation9 Early screening has been an effective way to prevent CRC. However, with the advanced CRC, the current treatment is still unsatisfying. Therefore, it is necessary to further decipher the pathophysiology of CRC, thus to effectively manage the CRC.
With the development of biotechnologies, multi-omics such as transcriptomics, proteomics and metabolomics have been developed for identifying novel biomarkers that are associated with the pathophysiology of various diseases including CRC. Zhou et al, performed single-cell multi-omics sequencing and identified five genes including BGN, RCN3, TAGLN, MYL9 and TMP2 as fibroblast-specific biomarkers of poorer prognosis of CRC.Citation10 Zhang et al, performed single-cell transcriptome and identified tumor immune microenvironment heterogenicity and granulocytes enrichment in colorectal cancer liver metastases.Citation11 Mini et al, performed RNA sequencing analysis and identified PNN and KCNQ1OT1 as predictive biomarkers of clinical outcome in stage III colorectal cancer patients treated with adjuvant chemotherapy.Citation12 Wan et al, performed comprehensive analysis for the expression of SRSF6 in 311 CRC samples, The Cancer Genome Atlas and Gene Expression Omnibus (GEO) database and found that SRSF6 was frequently upregulated in CRC samples and associated with poor prognosis, which promoted proliferation and metastasis in vitro and in vivo.Citation13 Li et al, performed bioinformatics analysis using the TCGA database and demonstrated that METTL3 facilitated tumor progression via an m 6 A-IGF2BP2-dependent mechanism in colorectal carcinoma.Citation14 Chen et al, analyzed microarray data of gene expression profiles of CRC from GEO and RNA-sequencing dataset of CRC from TCGA and identified 9 genes associated with diagnosis and prognosis of colorectal cancer patients.Citation15 Yang et al, performed integrated microbiome and metabolome analysis and revealed a novel interplay between commensal bacteria and metabolites in colorectal cancer.Citation16 Therefore, integrated bioinformatics analysis has been a useful tool for identifying novel biomarkers associated with the pathophysiology of CRC.
In this study, we firstly evaluated two RNA-sequencing datasets (GSE50760 and GSE104178)Citation17,Citation18 and performed functional enrichment analysis for the DEGs in the datasets. Moreover, the PPI network and miRNA-mRNA network were constructed based on the overlapped DEGs between GSE50760 and GSE104178. The survival analysis of the key genes identified from the PPI network was performed using the KM-Plotter tool. Furthermore, the functional role of OTOP2 in the CRC cells was assessed with a series of in vitro assays. The present study may provide novel aspects into understanding the pathophysiology of CRC.
Materials and Methods
Data Mining for GEO Datasets
The datasets (GSE50760 and GSE104178) were retrieved from the GEO database. For the GSE50760 dataset, 18 CRC tissues and 18 normal tissues was included in this study; RNA-sequencing was performed using the GPL11154 Illumina HiSeq 2000 (Homo sapiens) platform. For GSE104178 dataset, 3 CRC and 3 normal tissues were included; RNA-sequencing was performed using GPL11154 Illumina HiSeq 2000 (Homo sapiens) platform.
Screening of DEGs in GSE50760 and GSE104178
The DEGs between normal and CRC tissues were analyzed by using the GREIN-iLINCS online analysis tool.Citation19 For the DEGs, the criteria were set as follows: false discovery rate (FDR) p < 0.05 and |log fold change (FC)| > 1.5. For heatmap visualization, 200 DEGs were plotted by using the GREIN-iLINCS tool. For the volcano plots, the DEGs were visualized by using R. For the overlapped DEGs, the Venn diagram was used for overlapped DEGs visualization.
Functional Enrichment Analysis of DEGs
The GO enrichment and KEGG pathway enrichment analysis of DEGs were performed by using EnrichR.Citation20 GO term enrichment is a technique for interpreting sets of genes making use of the GO system of classification.Citation21 KEGG is a database for illustrating biological functions with high level Citation22
PPI Network and miRNA-mRNA Network Construction
The PPI network of the overlapped DEGs was constructed by using the STRING tool (https://string-db.org/) . For the miRNA-mRNA network construction, the miRNAs that potentially target mRNAs were predicted by using miRDBCitation23 . For the identification of hub genes from the PPI network of overlapped DEGs, we employed the Cytohubba tool from Cytoscape software, and the top 10 genes from the key module of the PPI networks were defined as hub genes.Citation24 The PPI network and miRNA-mRNA network were plotted by Cytoscape software.
Survival Analysis
Survival analysis of hub genes was assessed with Kaplan Meier plotter,Citation25 which is capable of assessing the effect of 54 k genes (mRNA, miRNA, protein) on survival in 21 cancer types. Sources for the databases include GEO, EGA, and TCGA. In the survival analysis for patients with CRC, a total of 80 patients were included. The log-rank P < 0.05 was considered statistically significant.
Expression Analysis of OTOP2
The expression level and promoter methylation level of OTOP2 in CRC tissues and normal tissues were analyzed using the GEPIA toolCitation26 and UALCAN tool.Citation27 The significant difference was defined as *P<0.05.
Cell Culture and siRNA Transfection
The CRC cell lines including HT29 and SW620 cells were purchased from the ATCC company (Manassas, USA). The HT29 and SW620 cells were cultured in DMEM medium supplemented with 10% fetal bovine serum (FBS, Thermo Fisher Scientific, Waltham, USA) in a humidified incubator with 5% CO2 at 37°C.
The siRNAs targeting OTOP2 (named si-OTOP2#1 and si-OTOP2#2) were synthesized by Ribobio (Guangzhou, China). The respective scrambled siRNA (named si-NC) was used as the negative control. For the cell transfections, the siRNAs (si-NC, si-OTOP2#1 or si-OTOP2#2) were transfected into the HT29 or SW620 cells by using Lipofectamine 2000 reagent (Invitrogen, Carlsbad, USA) according to the manufacturer’s protocol.
Quantitative Real-Time PCR (qRT-PCR)
Total RNA from cells was extracted using the TRIzol reagent (Invitrogen). Extracted RNA was reversely transcribed to cDNA using a PrimeScript RT reagent kit with gDNA Eraser (Takara, Tokyo, Japan), and real-time PCR was performed using SYBR Premix Ex TaqII (Takara), with U6 and GAPDH served as an inner control. The relative gene expression levels were determined by using 2−ΔΔCt method.
Caspase-3 and Caspase-9 Activity Assay
The activities of caspase-3 and caspase-9 were measured using a caspase-3 and caspase-9 detection assay kit (Beyotime Institute of Biotechnology, Shanghai, China).
Wound Healing Assay
The wound healing of CRC cells was measured. CRC cells were cultured in 6 well plates up to ~100% confluence. The cells were starved for 6 h and wounded with a sterile 200-μL pipette tip. After being washed, the cells were cultured for 24 h and photo-imaged before and after 24 h culture. Wound healing (%) = (wound width at 0 h – wound width at 24 h)/wound width at 0 h * 100%.
CCK-8 Assay
The proliferation of the CRC cells was determined using a CCK-8 assay (Dojindo Molecular Technologies, Inc.) as previously described. CRC cells were cultured in 96-well plates at a density of 5×10³ cells per well followed by transfections for 48 h. For the CCK-8 assay, 10 μL of the CCK-8 reagent was added to each well for 2 h. Then, the absorbance at 450 nm was measured to determine the proliferative potential of CRC cells.
Dual-Luciferase Reporter Assay
Luciferase reporter assay was used to confirm the relationship between the miRNA and the target gene. The sequences of 3′UTR of OTOP2 mRNA were chemically synthesized and introduced into the luciferase reporter vector to construct the wild-type (WT) luciferase reporter plasmids, respectively. The seed regions of miR-3148 in the 3′-UTR of OTOP2 were mutated to construct mutant (Mut) luciferase reporter plasmids. The co-transfections with luciferase reporter plasmids and miRNA mimics HEK293 cells were performed after the cells reached 80% confluence. At 24 h after co-transfections, the cells were collected and dual-luciferase activity was measured using the Dual-Luciferase Reporter Assay (Promega, Shanghai, China) according to the manufacturer’s instructions and normalized to Renilla signals.
Statistical Analysis
The SPSS 19.0 software (IBM, Armonk, NY, USA) was used for statistical analysis. The data are presented as mean ± standard deviation. Comparisons among the different groups were performed by the one-way analysis of variance (ANOVA). A probability value of P < 0.05 was considered significant.
Results
Identification of DEGs from GSE50760 and GSE104178
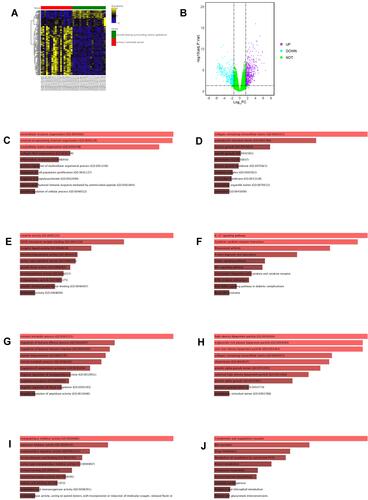
In the GSE50760, a total of 639 up-regulated and 582 down-regulated genes were detected. The heatmap showed the top 200 DEGs based on the adjusted p values (). The volcano plot further illustrates the DEGs, in which purple dots represent the up-regulated genes and cyan dots represent the down-regulated genes (). Furthermore, the up-regulated and down-regulated DEGs in GSE50760 were collected from the functional enrichment analysis by using EnrichR tool. The up-regulated DEGs was mainly enriched in biological process including extracellular structure organization, external encapsulating structure organization, extracellular matrix organization, collagen fibril organization and etc (). In the cellular component, the up-regulated DEGs were mainly enriched in collagen-containing extracellular matrix, endoplasmic reticulum lumen, tertiary granule, specific granule and etc (). The up-regulated DEGs were enriched in the molecular function including cytokine activity, CXCR chemokine receptor binding, receptor-ligand activity and etc (). For the KEGG pathway, they were mainly enriched in the IL-17 signaling pathway, cytokine-cytokine receptor interaction, rheumatoid arthritis, protein digestion and absorption and etc (). For the down-regulated genes, they were mainly enriched in the biological process including retinoid metabolic process, regulation of immune effector process, regulation of humoral immune response and etc (). In the cellular component, they were mainly enriched in high-density lipoprotein particle, triglyceride-rich plasma lipoprotein particle, very-low-density lipoprotein particle and etc (). In terms of molecular function, the down-regulated DEGs were mainly enriched in endopeptidase inhibitor activity, peptidase inhibitor activity, endopeptidase regulator activity and so on (). For the KEGG pathway enrichment analysis, the down-regulated DEGs were mainly enriched in complement and coagulation cascades, bile secretion, drug metabolism, metabolism of xenobiotics by cytochrome P450 and etc ().
Figure 1 Analysis of DEGs from GSE50760. (A) Heatmap illustrates the top 200 DEGs in GSE50760 according to FDR p values. (B) Volcano plot illustrates the DEGs in GSE50760. (C) GO_Biological Process enrichment of up-regulated DEGs from GSE50760. (D) GO_Cellular component enrichment of up-regulated DEGs from GSE50760. (E) GO_Molecular function enrichment of up-regulated DEGS from GSE50760. (F) KEGG pathway enrichment of up-regulated DEGs from GSE50760. (G) GO_Biological process enrichment of down-regulated DEGs from GSE50760. (H) GO_Cellular component enrichment of down-regulated DEGs from GSE50760. (I) GO_Molecular function enrichment of down-regulated DEGS from GSE50760. (J) KEGG pathway enrichment of down-regulated DEGs from GSE50760.
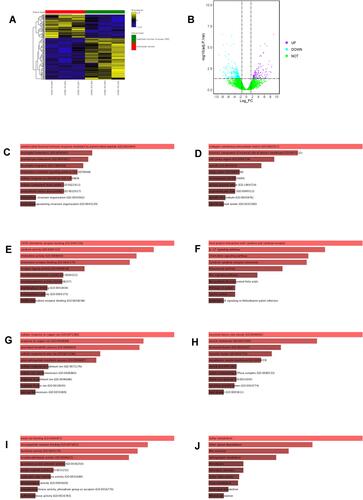
In GSE10478, we identified 163 up-regulated and 309 down-regulated DEGs, respectively. As shown in , 200 top DEGs were shown as heatmap based on the adjusted p value (). The volcano plot demonstrated the down-regulated and up-regulated genes with cyan dots representing down-regulated DEGs and purple dots representing up-regulated DEGs (). For the up-regulated DEGs, they were mainly enriched in biological process including antimicrobial humoral immune response mediated by antimicrobial peptide, neutrophil chemotaxis, granulocyte chemotaxis and etc (). In the cellular component, the up-regulated DEGs was mainly enriched in collagen-containing extracellular matrix, extrinsic component of external side of plasma membrane, cell cortex region, spindle and etc (). The up-regulated DEGs was enriched in the molecular function including CXCR chemokine receptor binding, cytokine activity, chemokine activity, chemokine receptor binding and etc (). For the KEGG pathway, they were mainly enriched in viral protein interaction with cytokine and cytokine receptor, IL-17 signaling pathway, chemokine signaling pathway, cytokine-cytokine receptor interaction and etc (). For the down-regulated genes, they were mainly enriched in the biological process including cellular response to copper ion, response to copper ion, glycolipid metabolic process, cellular response to zinc ion and etc (). In the cellular component, they were mainly enriched in high-neuronal dense core vesicle, vesicle membrane, lysosomal lumen, vacuolar lumen and etc (). In terms of molecular function, the down-regulated DEGs were mainly enriched in metal ion binding, neuropeptide receptor binding, hormone activity, lysophospholipase activity, guanylate cyclase activator activity and so on (). For the KEGG pathway enrichment analysis, the down-regulated DEGs were mainly enriched in sulfur metabolism, other glycan degradation, bile secretion, sphingolipid metabolism, amoebiasis, pancreatic secretion and etc ().
Figure 2 Analysis of DEGs from GSE104178. (A) Heatmap illustrates the top 200 DEGs in GSE104178 according to FDR p values. (B) Volcano plot illustrates the DEGs in GSE104178. (C) GO_Biological process enrichment of up-regulated DEGs from GSE104178. (D) GO_Cellular component enrichment of up-regulated DEGs from GSE104178. (E) GO_Molecular function enrichment of up-regulated DEGS from GSE104178. (F) KEGG pathway enrichment of up-regulated DEGs from GSE104178. (G) GO_Biological process enrichment of down-regulated DEGs from GSE104178. (H) GO_Cellular omponent enrichment of down-regulated DEGs from GSE104178. (I) GO_Molecular function enrichment of down-regulated DEGS from GSE104178. (J) KEGG pathway enrichment of down-regulated DEGs from GSE104178.
Functional Enrichment of Overlapped DEGs Between GSE50760 and GSE104178
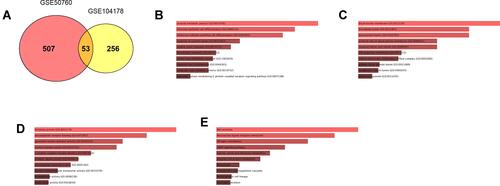
As shown in the Venn diagram, there are 53 overlapped DEGs between GSE50760 and GSE104178 (). The overlapped DEGs were processed for the functional enrichment analysis. The overlapped DEGs were enriched in the biological process including oxoacid metabolic process, intestinal epithelial cell differentiation, columnar/cuboidal epithelial cell differentiation, response to nutrient levels and etc (). In the cellular component, the overlapped DEGs were mainly enriched in brush border membrane, microbody lumen, peroxisomal matrix, external side of apical plasma membrane, neuronal dense core vesicle, cell projection membrane and etc (). For the molecular function, the overlapped DEGs were enriched in hormone activity, neuropeptide receptor binding, guanylate cyclase activator activity, proton channel activity, G protein-coupled receptor binding and etc (). Furthermore, the KEGG pathway enrichment analysis showed that overlapped DEGs were mainly enriched in bile secretion, neuroactive ligand-receptor interaction, nitrogen metabolism, cAMP signaling pathway, glycine, serine and threonine metabolism and ect ().
Figure 3 Functional enrichment of overlapped DEGs between GSE50760 and GSE104178. (A) Venn diagram illustrates the overlapped DEGs between GSE50760 and GSE104178. (B) GO_Biological process enrichment of overlapped DEGs between GSE50760 and GSE104178. (C) GO_Cellular component enrichment of overlapped DEGs between GSE50760 and GSE104178. (D) GO_Molecular function enrichment of overlapped DEGs between GSE50760 and GSE104178. (E) KEGG pathway enrichment of overlapped DEGs between GSE50760 and GSE104178.
Construction of PPI Network and miRNA-mRNA Network
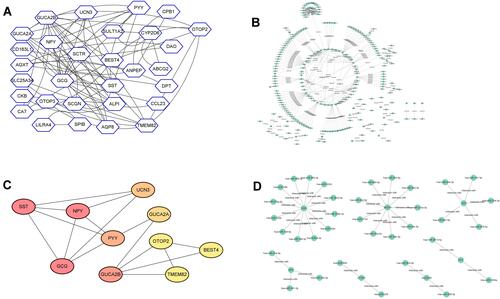
As for the further analysis, we employed the StringDB online tool to evaluate the potential interaction of the overlapped DEGs. As shown , the constructed PPI network consists of 72 edges and 30 nodes. Furthermore, the miRNAs that target the 53 overlapped DEGs were predicted by miRDB tool, and the miRNA-mRNA network was visualized using Cytoscape software, and a total of 248 edges and 231 nodes were identified in the miRNA-mRNA network (). Furthermore, by using the Cytohubba tool, we identified a key sub-network that contains ten genes (GCG, SST, NPY, GUCA2B, PYY, UCN3, GUCA2A, TMEM82, BEST4 and OTOP2). For the sub-network, there are 16 edges and 10 nodes (), and these genes identified in the sub-network were defined as hub genes. In addition, the interaction of miRNAs and the genes in the sub-network was visualized by the Cytoscape software, and a total of 35 edges and 42 nodes were detected in the miRNA-mRNA network ().
Figure 4 Construction of PPI network and miRNA-mRNA network. (A) PPI network construction of overlapped DEGs between GSE50760 and GSE104178. (B) The miRNA-mRNA network construction based on the miRNAs that target overlapped DEGs between GSE50760 and GSE104178. (C) PPI network construction according to Cytohubba tool, and a total of top 10 genes were identified in the network. (D) The miRNA-mRNA network construction based on the miRNAs that target 10 hub genes.
Kaplan–Meier Survival Analysis of Patients with CRC
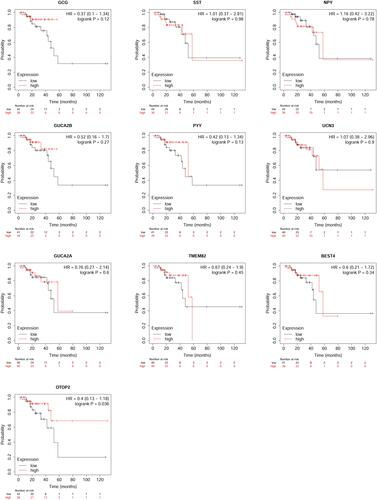
The association between the hub gene expression level and the overall survival of patients with CRC was detected by mining the KM-Plotter online database. As shown in , the expression levels of GCG, SST, NPY, GUCA2B, PYY, UCN3, GUCA2A, TMEM82 and BEST4 were not correlated with the overall survival of patients with CRC. However, the high expression of OTOP2 in the CRC tissues was significantly correlated with better overall survival of patients with CRC ().
Figure 5 Kaplan–Meier survival analysis of patients with CRC. The association between the expression levels of GCG, SST, NPY, GUCA2B, PYY, UCN3, GUCA2A, TMEM82, BEST4 and OTOP2 and the overall survival of patients with CRC was analyzed using the KM-Plotter online tool. A total of 80 patients with CRC was included in the analysis.
Expression Analysis of OTOP2 in the CRC Tissues
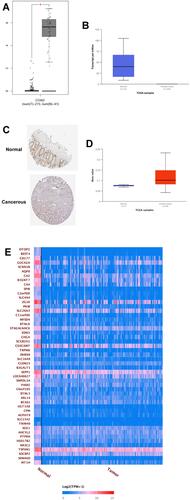
As analyzed by the GEPIA online tool, the expression of OTOP2 was significantly down-regulated in the CRC tissues when compared to that in normal tissues (). Consistently, the UACLAN database further showed that OTOP2 was down-regulated in the primary CRC tissues when compared to that in the normal tissues (). The analysis of Human Protein Atlas showed that the protein expression of OTOP2 evaluated by IHC was significantly lower in the CRC tissues than that in the normal tissues (). Moreover, the further analysis revealed that the promoter methylation level of OTOP2 was significantly higher in the CRC tissues than that in the normal tissues (). The correlation analysis showed that OTOP2 was correlated with potential genes such as BEST4, CD177, GUCA2A, SCNN18, AQP8, CA2 and so on ().
Figure 6 Expression analysis of OTOP2 in the CRC tissues. (A) The expression level of OTOP2 in the CRC tissues and normal tissues was examined by using GEPIA tool. (B) The expression level of OTOP2 in the CRC tissues and normal tissues was examined by using UACLAN tool. (C) The protein expression of OTOP2 in the CRC tissues and normal tissues was determined by the Human Protein Atlas tool. (D) The promoter methylation of OTOP2 in the CRC tissues and normal tissues was examined by using UACLAN tool. (E) The correlation between OTOP2 and other genes (top 50 genes) was analyzed using UACLAN tool. *P < 0.05.
Effects of OTOP2 Knockdown on the CRC Cell Migration, Proliferation and EMT
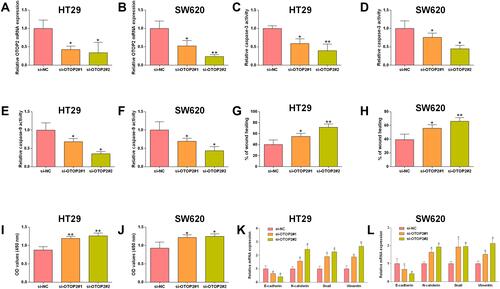
As OTOP2 was down-regulated in the CRC tissues, we further verified if OTOP2 knockdown could affect the cellular functions of CRC cells. In this study, we used CRC cell lines including HT29 and SW620, and found that the mRNA expression level of OTOP2 was significantly down-regulated in the HT29 and SW620 cells after being transfected with the OTOP2 siRNAs ( and ). As shown and , OTOP2 knockdown suppressed the caspase-3 activities of HT29 and SW620 cells. Consistently, OTOP2 silence also reduced the caspase-9 activities of HT29 and SW620 cells ( and ). The wound healing assay showed that OTOP2 silence markedly promoted the migratory capacities of HT29 and SW620 cells ( and ). Furthermore, the proliferation of HT29 and SW620 cells was assessed by CCK-8 assay, and OTOP2 knockdown significantly enhanced the cell proliferation of HT29 and SW620 cells ( and ). The qRT-PCR was also performed to investigate the mRNA expression levels of E-cadherin, N-cadherin, snail and vimentin, and OTOP2 knockdown induced an increase in the mRNA expression levels of N-cadherin, snail and vimentin, while decreased the mRNA expression level of E-cadherin in HT29 and SW620 cells ( and ).
Figure 7 Effects of OTOP2 knockdown on the CRC cell migration, proliferation and EMT. HT29 and SW620 cells were transfected with si-NC, si-OTOP2#1 or si-OTOP2#2, and at 24 h after transfection, (A and B) the mRNA expression of OTOP2 in HT29 (A) and SW620 (B) cells was determined by qRT-PCR assay; (C and D) the caspase-3 activities of HT29 (C) and SW620 (D) cells were determined by the Caspase-3 activity assay kit; (E and F) the caspase-9 activities of HT29 (E) and SW620 (F) cells were determined by the Caspase-9 activity assay kit; (G and H) the migratory abilities of HT29 (G) and SW620 (H) cells were evaluated by wound healing assay; (I and J) the cell proliferation of HT29 (I) and SW620 (J) cells was determined by CCK-8 assay; (K and L) the mRNA expression levels of E-cadherin, N-cadherin, snail and vimentin in HT29 (I) and SW620 (J) cells were measured by qRT-PCR assay. N = 3; *P<0.05 and **P<0.01 compared to si-NC group.
MiR-3148 Inversely Regulated OTOP2
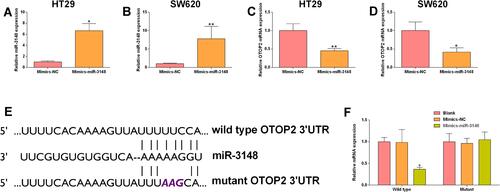
In order to further explore the underlying molecular mechanisms, we found that OTOP2 could be targeted by 13 miRNAs based on the miRDB tool (see Supplemental Table S1). Among these miRNAs, we selected miR-3148 for the further analysis. As shown in and , miR-3148 mimics transfection significantly increased miR-3148 expression levels in HT29 and SW620 cells. Moreover, OTOP2 mRNA expression was markedly down-regulated in the HT29 and SW620 cells after being transfected with miR-3148 mimics ( and ). As shown in , miR-3148 could potentially target the 3’UTR of OTOP2, and the luciferase reporter assay verified that miR-3148 overexpression significantly repressed the luciferase activity of reporter vector harboring wild type OTOP2 3’UTR (), but not the vector harboring the mutant one ().
Figure 8 MiR-3148 inversely regulated OTOP2. HT29 and SW620 cells were transfected with Mimics-NC or miR-3148 mimics, and at 24 h after transfection, (A and B) the miR-3148 expression in HT29 (A) and SW620 (B) cells was determined by qRT-PCR assay; (C and D) the mRNA expression of OTOP2 in HT29 (E) and SW620 (F) cells was determined by qRT-PCR assay. (E) The predicted binding positions between miR-3146 and OTOP2 3’UTR. (F) The luciferase reporter activity of reporter vector containing OTOP2 3’UTR (wild type or mutant) in HEK293 cells after being transfected with Mimics-NC or miR-3148 mimics was determined by Dual-Luciferase reporter assay. N = 3, *P<0.05 and **P<0.01 compared to Mimics-NC group.
Discussion
CRC represents one of the most frequent human malignancies with its underlying pathogenesis still unclear.Citation28 The prevalence of multi-omics in screening biomarkers associated with CRC has largely accelerated our understanding into the pathophysiology of CRC. In this study, we screened the DEGs in GSE50760 and GSE104178 and performed functional GO enrichment and KEGG pathway enrichment analysis. Furthermore, the overlapped DEGs were subjected to functional GO enrichment and KEGG pathway enrichment analysis. The PPI network and miRNA-mRNA network were constructed based on the overlapped DEGs. The survival analysis revealed that the expression levels of GCG, SST, NPY, GUCA2B, PYY, UCN3, GUCA2A, TMEM82 and BEST4 were not correlated with the overall survival of patients with CRC. However, the high expression of OTOP2 in the CRC tissues was significantly correlated with better overall survival of patients with CRC. The expression of OTOP2 in CRC tissues was significantly lower than that in normal tissues. The in vitro functional assays demonstrated that OTOP2 silence reduced the caspase-3/-9 activities, promoted cell migration, proliferation and EMT in HT29 and SW620 cells. Furthermore, miR-3148 could inversely regulate the expression of OTOP2 in CRC cell lines. Collectively, the present study suggested the potential role of the OTOP2/miR-3148 axis in the pathophysiology of CRC by mining the GEO database.
With the progress in bioinformatics analytical techniques, data mining via large gene profiling datasets has become a hot research topic nowadays. For GSE50760, Kim et al, performed that RNA-sequencing analysis from the primary CRC tissue samples and generated a prognostic index based on an 11 gene signature to predict systemic recurrences in CRC.Citation29 For GSE104178, the present study performed whole-transcriptome analysis in 3 pairs of CRC and matched normal mucosa by using RNA-sequencing technique, and highlight the capability of RNA-seq to discover novel lncRNAs involved in human carcinogenesis, which may serve as alternative biomarkers and/or molecular treatment targets.Citation18 In the present study, our results showed that the overlapped DEGs were enriched in several key pathways associated with cancer progression. In addition, the PPI network analysis indicated the close interaction among these overlapped DEGs.
Based on the survival analysis, OTOP2 high expression was correlated with a better prognosis of patients with CRC. Moreover, OTOP2 expression was down-regulated in CRC tissues when compared to normal tissues, and the promoter methylation of OTOP2 was higher in the CRC tissues than that in the normal tissues. These results indicated that OTOP2 acted as a tumor suppressor in CRC. OTOP2 belongs to the otopetrin family and has been identified as a proto-selective ion channel. Low et al, conducted transcriptome profiling on 32 colonic biopsies including 11 long-duration ulcerative colitis, ≥20 years; and 21 short-duration ulcerative colitis (UC), ≤5 years, and the results showed that OTOP2 was dysregulated in the UC tissues.Citation30 Sah et al, performed RNA sequencing-based analysis of the laying hen uterus and revealed the novel genes including OTOP2 involved in the eggshell biomineralization.Citation31 Shinde et al, performed RNA sequencing of corneas from two keratoconus patient groups and identified OTOP2 as potential biomarkers for this disease.Citation32 In addition, Parikh et al, found that OTOP2 was dysregulated in inflammatory bowel disease.Citation33 In our results, we showed that OTOP2 silence reduced the caspase-3/-9 activities, promoted cell migration, proliferation and EMT in HT29 and SW620 cells, implying that OTOP2 may function as a tumor suppressor in CRC cell lines. EMT is a process during which cells lose their epithelial characteristics, for instance cell polarity and cell-cell contact, and gain mesenchymal properties, such as increased motility. In CRC, EMT is associated with an invasive or metastatic phenotype.Citation34 Our results showed that OTOP2 silence promoted EMT, which indicated that OTOP2-mediated CRC cell migration may be associated with the changes in EMT.
Based on the miRDB prediction, we found that OTOP2 was a potential target of miR-3148. As expected, miR-3148 overexpression decreased the mRNA expression level of OTOP2 in the HT29 and SW620 cells, and the mechanistic interaction between miR-3148 and OTOP2 3’UTR was confirmed by luciferase reporter assay. In fact, the role of miR-3148 has been implicated in various studies. Akamine et al, proposed that miR-3148 was a novel onco-miRNA that promoted tumor growth of HTC116 cells in vivo.Citation35 Vishnubalaji et al, demonstrated that miR-3148 acted as molecular switch promoting malignant transformation and adipocytic differentiation of immortalized human bone marrow stromal cells via direct targeting of the SMAD2/TGFβ pathway.Citation36 Collectively, the above evidence indicated that miR-3148 acted as onco-miRNA in CRC by repressing OTOP2 expression. However, as we have not examined the expression of miR-3148 in the CRC tissues, and whether miR-3148 expression was inversely correlated with OTOP2 expression in CRC tissues remains to be clarified. Thus, future studies should consider examining the expression of miR-3148 and OTOP2 in CRC tissues, so as to further confirm our current findings.
Conclusions
In conclusion, this work carried out integrated bioinformatics analysis and identified several key genes associated with cancer-associated pathways. Further functional studies showed that OTOP2, inversely regulated by miR-3148, inhibited CRC cell migration, proliferation and EMT. However, the role of the miR-3148/OTOP2 signaling axis in CRC still requires extensive mechanistic studies.
Data Sharing Statement
All the data are available upon request from the corresponding author.
Ethical Approval
All the experimental procedures were approved by the Ethics Review Board of The Second Affiliated Hospital of Dalian Medical University.
Disclosure
The authors have stated that they have no conflict of interest.
Additional information
Funding
References
- Castells A. Hereditary forms of colorectal cancer. Gastroenterol Hepatol. 2016;39(Suppl 1):62–67. doi:10.1016/S0210-5705(16)30176-5
- Patel SG, Ahnen DJ. Colorectal cancer in the young. Curr Gastroenterol Rep. 2018;20(4):15. doi:10.1007/s11894-018-0618-9
- Wrobel P, Ahmed S. Current status of immunotherapy in metastatic colorectal cancer. Int J Colorectal Dis. 2019;34(1):13–25. doi:10.1007/s00384-018-3202-8
- Simon K, Simon K. Colorectal cancer development and advances in screening. Clin Interv Aging. 2016;11:967–976. doi:10.2147/CIA.S109285
- Thanikachalam K, Khan G. Colorectal cancer and nutrition. Nutrients. 2019;11(1):164. doi:10.3390/nu11010164
- La Vecchia S, Sebastián C. Metabolic pathways regulating colorectal cancer initiation and progression. Semin Cell Dev Biol. 2020;98:63–70. doi:10.1016/j.semcdb.2019.05.018
- Kuipers EJ, Grady WM, Lieberman D, et al. Colorectal cancer. Nat Rev Dis Primers. 2015;1:15065. doi:10.1038/nrdp.2015.65
- Piawah S, Venook AP. Targeted therapy for colorectal cancer metastases: a review of current methods of molecularly targeted therapy and the use of tumor biomarkers in the treatment of metastatic colorectal cancer. Cancer. 2019;125(23):4139–4147. doi:10.1002/cncr.32163
- Weitz J, Koch M, Debus J, Höhler T, Galle PR, Büchler MW. Colorectal cancer. Lancet. 2005;365(9454):153–165. doi:10.1016/S0140-6736(05)17706-X
- Zhou Y, Bian S, Zhou X, et al. Single-cell multiomics sequencing reveals prevalent genomic alterations in tumor stromal cells of human colorectal cancer. Cancer Cell. 2020;38(6):818–28.e5. doi:10.1016/j.ccell.2020.09.015
- Zhang Y, Song J, Zhao Z, et al. Single-cell transcriptome analysis reveals tumor immune microenvironment heterogenicity and granulocytes enrichment in colorectal cancer liver metastases. Cancer Lett. 2020;470:84–94. doi:10.1016/j.canlet.2019.10.016
- Mini E, Lapucci A, Perrone G, et al. RNA sequencing reveals PNN and KCNQ1OT1 as predictive biomarkers of clinical outcome in stage III colorectal cancer patients treated with adjuvant chemotherapy. Int J Cancer. 2019;145(9):2580–2593. doi:10.1002/ijc.32326
- Wan L, Yu W, Shen E, et al. SRSF6-regulated alternative splicing that promotes tumour progression offers a therapy target for colorectal cancer. Gut. 2019;68(1):118–129. doi:10.1136/gutjnl-2017-314983
- Li T, Hu PS, Zuo Z, et al. METTL3 facilitates tumor progression via an m(6) A-IGF2BP2-dependent mechanism in colorectal carcinoma. Mol Cancer. 2019;18(1):112. doi:10.1186/s12943-019-1038-7
- Chen L, Lu D, Sun K, et al. Identification of biomarkers associated with diagnosis and prognosis of colorectal cancer patients based on integrated bioinformatics analysis. Gene. 2019;692:119–125. doi:10.1016/j.gene.2019.01.001
- Yang Y, Misra BB, Liang L, et al. Integrated microbiome and metabolome analysis reveals a novel interplay between commensal bacteria and metabolites in colorectal cancer. Theranostics. 2019;9(14):4101–4114. doi:10.7150/thno.35186
- Kim SK, Kim SY, Kim JH, et al. A nineteen gene-based risk score classifier predicts prognosis of colorectal cancer patients. Mol Oncol. 2014;8(8):1653–1666. doi:10.1016/j.molonc.2014.06.016
- Yamada A, Yu P, Lin W, Okugawa Y, Boland CR, Goel A. A RNA-sequencing approach for the identification of novel long non-coding RNA biomarkers in colorectal cancer. Sci Rep. 2018;8(1):575. doi:10.1038/s41598-017-18407-6
- Mahi NA, Najafabadi MF, Pilarczyk M, Kouril M, Medvedovic M. GREIN: an interactive web platform for re-analyzing GEO RNA-seq data. Sci Rep. 2019;9(1):7580. doi:10.1038/s41598-019-43935-8
- Chen EY, Tan CM, Kou Y, et al. Enrichr: interactive and collaborative HTML5 gene list enrichment analysis tool. BMC Bioinform. 2013;14:128. doi:10.1186/1471-2105-14-128
- Mi H, Muruganujan A, Casagrande JT, Thomas PD. Large-scale gene function analysis with the PANTHER classification system. Nat Protoc. 2013;8(8):1551–1566. doi:10.1038/nprot.2013.092
- Kanehisa M, Sato Y, Kawashima M. KEGG mapping tools for uncovering hidden features in biological data. Protein Sci. 2021;31(1):47–53. doi:10.1002/pro.4172
- Wang X. miRDB: a microRNA target prediction and functional annotation database with a wiki interface. RNA. 2008;14(6):1012–1017. doi:10.1261/rna.965408
- Chin CH, Chen SH, Wu HH, Ho CW, Ko MT, Lin CY. cytoHubba: identifying hub objects and sub-networks from complex interactome. BMC Syst Biol. 2014;8 Suppl 4(Suppl 4):S11. doi:10.1186/1752-0509-8-S4-S11
- Győrffy B. Survival analysis across the entire transcriptome identifies biomarkers with the highest prognostic power in breast cancer. Comput Struct Biotechnol J. 2021;19:4101–4109. doi:10.1016/j.csbj.2021.07.014
- Tang Z, Li C, Kang B, Gao G, Li C, Zhang Z. GEPIA: a web server for cancer and normal gene expression profiling and interactive analyses. Nucleic Acids Res. 2017;45(W1):W98–w102. doi:10.1093/nar/gkx247
- Chandrashekar DS, Bashel B, Balasubramanya SAH, et al. UALCAN: a portal for facilitating tumor subgroup gene expression and survival analyses. Neoplasia. 2017;19(8):649–658. doi:10.1016/j.neo.2017.05.002
- Malki A, ElRuz RA, Gupta I, Allouch A, Vranic S, Al Moustafa AE. Molecular mechanisms of colon cancer progression and metastasis: recent insights and advancements. Int J Mol Sci. 2020;22(1):130. doi:10.3390/ijms22010130
- Kim SK, Kim SY, Kim CW, et al. A prognostic index based on an eleven gene signature to predict systemic recurrences in colorectal cancer. Exp Mol Med. 2019;51(10):1–12. doi:10.1038/s12276-019-0319-y
- Low END, Mokhtar NM, Wong Z, Raja Ali RA. Colonic mucosal transcriptomic changes in patients with long-duration ulcerative colitis revealed colitis-associated cancer pathways. J Crohns Colitis. 2019;13(6):755–763. doi:10.1093/ecco-jcc/jjz002
- Sah N, Kuehu DL, Khadka VS, et al. RNA sequencing-based analysis of the laying hen uterus revealed the novel genes and biological pathways involved in the eggshell biomineralization. Sci Rep. 2018;8(1):16853. doi:10.1038/s41598-018-35203-y
- Shinde V, Hu N, Mahale A, et al. RNA sequencing of corneas from two keratoconus patient groups identifies potential biomarkers and decreased NRF2-antioxidant responses. Sci Rep. 2020;10(1):9907. doi:10.1038/s41598-020-66735-x
- Parikh K, Antanaviciute A, Fawkner-Corbett D, et al. Colonic epithelial cell diversity in health and inflammatory bowel disease. Nature. 2019;567(7746):49–55. doi:10.1038/s41586-019-0992-y
- Vu T, Datta PK. Regulation of EMT in colorectal cancer: a culprit in metastasis. Cancers. 2017;9(12):171. doi:10.3390/cancers9120171
- Akamine T, Morodomi Y, Harada Y, et al. miR-3148 is a novel onco-microRNA that potentiates tumor growth in vivo. Anticancer Res. 2018;38(10):5693–5701. doi:10.21873/anticanres.12906
- Vishnubalaji R, Elango R, Manikandan M, et al. MicroRNA-3148 acts as molecular switch promoting malignant transformation and adipocytic differentiation of immortalized human bone marrow stromal cells via direct targeting of the SMAD2/TGFβ pathway. Cell Death Discov. 2020;6:79. doi:10.1038/s41420-020-00312-z