
Zhang W, Yang C, Wang S, et al. Cancer Manag Res. 2021;13:3601–3617.
The authors have advised due to an error that occurred inadvertently at the time of figure assembly, on page 3609 is incorrect. The correct is shown below.
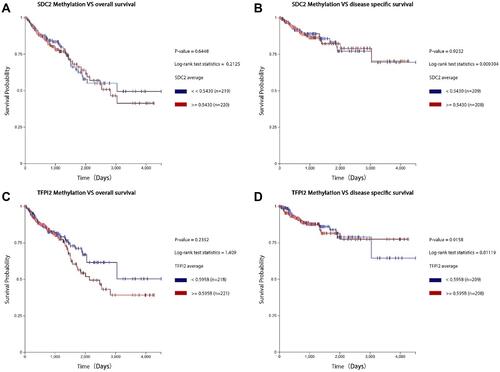
Figure 5 Kaplan-Meier survival curves comparing the high and low methylation levels of SDC2 and TFPI2 in CRC patients (UCSC-XENA). (A) The overall survival curve for CRC patients with high or low methylation level of SDC2. (B) The disease-specific survival curve for CRC patients with high or low methylation level of SDC2. (C) The overall survival curve for CRC patients with high or low methylation level of TFPI2. (D) The disease-specific survival curve for CRC patients with high or low methylation level of TFPI2.
The authors apologize for the error and advise it does not affect the results of the paper.