
 ?Mathematical formulae have been encoded as MathML and are displayed in this HTML version using MathJax in order to improve their display. Uncheck the box to turn MathJax off. This feature requires Javascript. Click on a formula to zoom.
Abstract
Background
COPD patients undergoing pulmonary rehabilitation (PR) show various responses. The purpose of this study was to investigate the possible mechanisms and predictors of the response to PR in COPD patients.
Methods
Thirty-six stable COPD patients underwent PR including a 4-week high-intensity exercise training program, and they were evaluated by cardiopulmonary exercise testing. All patients (mean age 69 years, severe and very severe COPD 94%) were classified into four groups by whether the exercise time (Tex) or the peak oxygen uptake
increased after PR: two factors increased (both the Tex and the peak
increased); two factors decreased; time only increased (the Tex increased, but the peak
economized); and
only increased (the Tex decreased, but the peak
increased). Within all patients, the relationships between baseline variables and the post-to-pre-change ratio of the time–slope, Tex/(peak minus resting
), were investigated.
Results
Compared with the two factors increased group (n=11), in the time only increased group (n=18), the mean differences from pre-PR at peak exercise in 1) minute ventilation
(P=0.004),
(P<0.0001), and carbon dioxide output
(P<0.0001) were lower, 2)
/
(P=0.034) and
/
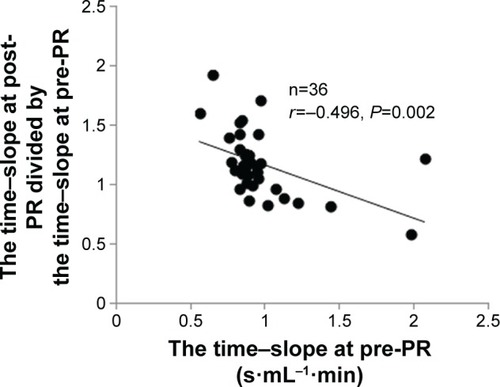
(P=0.006) were higher, and 3) the dead space/tidal volume ratio (VD/VT) and the dyspnea level were similar. After PR, there was no significant difference in the ratio of the observed peak heart rate (HR) to the predicted peak HR (220 – age [years]) between the two groups. A significant negative correlation with the baseline time–slope (r=−0.496, P=0.002) and a positive correlation with the baseline body mass index (BMI) (r=0.496, P=0.002) were obtained.
Conclusions
PR in COPD patients improves Tex rather than exercise tolerance, economizing oxygen requirements, resulting in reduced ventilatory requirements without cardiac loads followed by reduced exertional dyspnea. In addition, the time–slope and BMI could be used to predict PR responses beforehand.
Introduction
Exercise intolerance with dyspnea is a major complaint of patients with advanced COPD.Citation1–Citation4 It has been clearly demonstrated that pulmonary rehabilitation (PR), as an essential non-pharmacologic treatment option for COPD, increases exercise tolerance and reduces dyspnea.Citation1–Citation4 However, the responses to PR vary significantly and may be unique.Citation1–Citation5 It has been reported that some COPD patients receive little or no benefit at all from PR, although the definition of non-responders to PR needs to be considered.Citation1–Citation5 In addition, it has been reported that, regardless of whether exercise tolerance was improved in COPD patients on PR, their dyspnea was reduced or their endurance time was prolonged.Citation1,Citation6–Citation8 In other words, a high exercise tolerance might not be necessary to exercise for a long time. How to identify the possible mechanisms or predictors related to the response to PR is of great interest in the care of COPD patients, and it has not yet been clearly elucidated.
Given that physical exercise requires gas exchange involving the interaction of the ventilatory, cardiovascular, and muscle systems, two parameters (peak oxygen uptake
and exercise time to exhaustion [Tex]) might characterize total exercise ability.Citation9 Evaluating physical exercise might depend on the peak
relationship rather than the peak
or Tex alone, because it has been reported that, to reach a certain
during exercise, COPD patients had a longer time than normal subjects, that is, COPD patients could not increase
steeply.Citation10,Citation11 Furthermore, keeping in mind that exercise for a long time with the economized
requirement might be efficient exercise, it was hypothesized that careful consideration of the peak
relationship might be useful for providing detailed evaluations of PR or predicting the degree of response to PR in COPD patients. The Tex equivalent for increased
was designed to assess the effectiveness of PR. shows the Tex standardized by the increase of
from resting to peak exercise during cardiopulmonary exercise testing (CPET), that is,
(time–slope). As a first purpose of this study, the mechanism by which the responses to PR vary greatly in COPD patients, especially how exercise time but not exercise tolerance improves after PR, was investigated, classifying eligible patients into four groups by whether the Tex or the peak
was increased after PR: two factors increased (both the Tex and the peak
increased); two factors decreased; time only increased (the Tex increased but the peak
economized); and
only increased (the Tex decreased but the peak
increased), as shown in . Second, whether baseline parameters including the time–slope would be good predictors of the response to PR in COPD patients were investigated.
Figure 1 Exercise time (Tex)/Δ oxygen uptake
, that is, time–slope.
Note: The Tex standardized by the increase of
from resting to peak exercise during cardiopulmonary exercise testing.
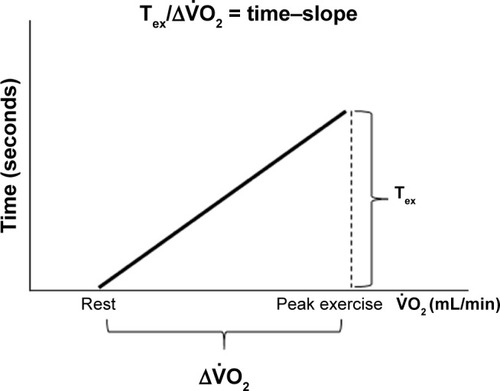
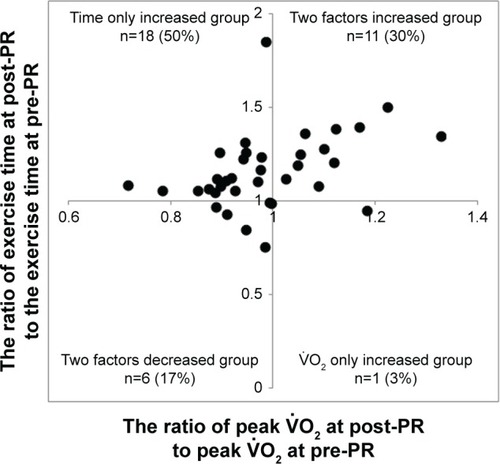
Figure 2 The effects of PR on peak
and Tex.
Abbreviation: PR, pulmonary rehabilitation.
Methods
Subjects
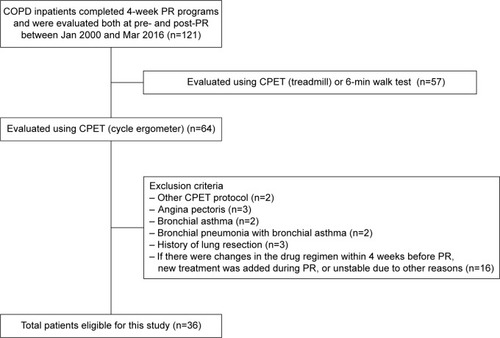
All 121 COPD patients who underwent the PR program for the first time were recruited for the study, and they were evaluated both before and after PR in the National Hospital Organization, Toneyama National Hospital (Japan), between January 2000 and March 2016. A total of 36 patients who were evaluated by CPET with the same protocol (for more detail, refer to the “CPET” section) were retrospectively analyzed. shows the study design as a flow diagram. The primary diagnosis of COPD was confirmed using the Global Initiative for Chronic Obstructive Lung Disease (GOLD) definition and classification.Citation12 Patients were excluded from this study if they had a diagnosis of 1) bronchial asthma, 2) active infection, 3) severe heart disease, or 4) a history of lung resection. Moreover, COPD patients were excluded if there were changes in the drug regimen within 4 weeks before PR, if new treatment was added during PR, or if they were unstable due to other reasons. All patients gave comprehensively their written, informed consent for the procedures of PR and CPET. The study protocol complied with the Declaration of Helsinki. The institutional review board of the NHO’s Toneyama National Hospital approved this study (approval number: 1604).
Figure 3 Study flow diagram.
Pulmonary function tests
Pulmonary function tests were performed within 1 week before and after PR, as previously described.Citation13
PR
PR consisted of four components on an inpatient basis as previously described:Citation14 1) education and instruction; 2) physical therapy; 3) exercise training; and 4) occupational therapy. Exercise training was conducted in three sets daily, every weekday for 4 weeks (20 days) at high-intensity targets with electromechanically braked cycle ergometers. The initial exercise level of each set was set for 6 min at the work rate corresponding to 60% of the peak
obtained on the baseline CPET. As tolerated by the patient, the exercise duration was first increased to 10 min. Second, the training work rate was increased by 5 W and then extended to the work rate corresponding to 80% of the baseline peak
. If the patient found the set intolerable, it was reduced to its previous setting.
CPET
Symptom-limited incremental exercise tests were performed using an electrically braked cycle ergometer (CV-1000SS; Lode, Groningen, the Netherlands) and a CPET system (Vmaxs-29C; CareFusion 207, Palm Springs, CA, USA) before and after PR with a similar protocol, that is, 2-min increments to 10 W and the same air conditions. Before CPET, patients were asked to make their maximal efforts. To achieve reliable data, CPET was performed until subject exhaustion without encouragement, especially during exercise. All patients were asked to maintain a speed of ~60 rpm on the cycle ergometer, looking at the rpm meter. Pre-exercise resting measurements were taken during the steady-state period after at least 3 min of breathing using a mask. Ventilatory values were measured on a breath-by-breath basis and are presented as 30-s averages at rest, during exercise at 2-min intervals, and at the end of exercise. Intensities of dyspnea (Borg scale) were assessed at rest, during the last 15 s of each exercise stage, and at the end of exercise. At the baseline CPET evaluation of all patients, arterial blood was collected at rest, during the last 15 s of each exercise stage, and at the end of exercise. Arterial blood samples for blood gas analyses and plasma lactate were taken as previously described.Citation13 Immediately after exercise, all patients were asked in a non-leading fashion about which symptoms (exertional dyspnea, leg discomfort, or others) caused them to stop the exercise.
Data analysis and statistical analysis
The anaerobic threshold (AT) was determined for each patient from a plot of
and
during exercise (the V-slope technique), which was obtained by the agreement of two independent investigators. Iso-time was defined as the highest equivalent exercise time achieved during CPETs performed before and after PR. The time–slope was determined as the ratio of Tex standardized by
(peak minus resting
) during CPET (Tex/
). Classifying all patients into four groups by whether the Tex or the peak
was increased after PR, the relationship was investigated between the post-to-pre-change ratio of Tex and the post-to-pre-change ratio of peak
(). To compare the baseline characteristics before PR between the two factors increased group (both the Tex and the peak
increased) and the time only increased group (the Tex increased, but the peak
economized), Fisher’s exact tests and Wilcoxon rank-sum tests were used. The distribution of reasons for stopping exercise was assessed using Fisher’s exact t-tests. The results after PR were compared with the pre-PR results within each group using paired t-tests, and the mean differences in outcome parameters between the two groups were analyzed using unpaired t-tests. To assess the relationships between baseline parameters and the ratio of the time–slope at post-PR to the time–slope at pre-PR, Spearman’s rank correlation coefficients were used. Data were expressed as mean ± SD, unless otherwise specified. A P<0.05 was considered significant (SAS 9.1.3; SAS Institute, Inc., Cary, NC, USA).
Results
The characteristics of the 36 patients are shown in . Most patients were male (97%) with severe-to-very severe airways obstruction (94%) according to the GOLD stages. All patients were ex-smokers. Home oxygen therapy was required for three patients.
Table 1 Baseline patient characteristics (n=36)
First, the effects of PR on
and Tex were investigated across all patients. shows the relationship between the post-to-pre-change ratio of Tex and the post-to-pre-change ratio of peak
. After PR, most patients (80%) increased Tex; of note, 18 patients (50%) increased Tex but reduced peak
.
Second, to investigate why PR improved Tex, reducing exercise tolerance in COPD patients, the response to PR was compared between the time only increased group (the Tex increased, but the peak
economized) (n=18) and the two factors increased group (both the Tex and the peak
increased) (n=11), as shown in . There was no significant difference in the percentage of total work performed during PR to the target work (the work rate corresponding to 80% of the baseline peak
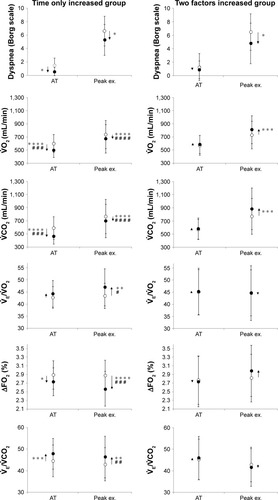
× total estimated time; time only increased group: 57.0%±28.5% vs two factors increased group: 65.0%±14.3%, P=0.429). Before PR, there were no differences in the characteristics and pulmonary functions between the two groups (). After PR, the distribution of reasons for stopping exercise was not different between the two groups (time only increased group: dyspnea [n=7, 39%], leg discomfort [n=11, 61%] vs two factors increased group: dyspnea [n=5, 45%], leg discomfort [n=6, 55%]). Although there was no significant difference in the resting response of PR between the groups, the mean difference (post-PR minus pre-PR) in the
/
at rest was increased in the time only increased group (within-group: P<0.05). At peak exercise and iso-time, the mean difference in dyspnea level was improved in each group, but there was no significant difference between the groups ( and ). At peak exercise, the VD/VT was relatively low and similar in both groups (). Compared with the two factors increased group, in the time only increased group, the mean differences in 1)
(at peak exercise, P<0.0001; at iso-time, P<0.0001; at AT, P=0.0001),
(at peak exercise, P<0.0001; at iso-time, P=0.0003; at AT, P=0.0003), and
(at peak exercise, P=0.004) were lower, 2)
/
(at peak exercise, P=0.034; at iso-time, P=0.047) and
/
(at peak exercise, P=0.006; at iso-time, P=0.017) were higher, and 3) ΔFO2, which was calculated by the inspired gas oxygen concentration (FiO2) minus expired gas oxygen concentration (FeO2), was lower (at peak exercise, P=0.0002; at iso-time, P=0.006; and ; ). After PR, there was no difference in the ratio of observed peak heart rate (HR) to predicted peak HR (220 – age [years]) between the two groups (time only increased group: 81.7% vs the two factors increased group: 84.4%, P=0.578).
Table 2 Patient characteristics of the two groups before pulmonary rehabilitation
Table 3 Changes in incremental exercise parameters at peak exercise after pulmonary rehabilitation
Table 4 Changes in incremental exercise parameters at iso-time after pulmonary rehabilitation
Figure 4 The changes of exercise variables before and after pulmonary rehabilitation.
Abbreviations: AT, anaerobic threshold; ΔFO2, the inspired oxygen concentration (FiO2) minus expired oxygen concentration (FeO2); peak ex., peak exercise;
Third, within all patients, to confirm the clinical predictors of responders who could exercise more efficiently after PR, the relationship between baseline variables and the post-to-pre-change ratio of the time–slope was investigated. A significant negative correlation with the baseline time–slope (r=−0.496, P=0.002; ; ) and a positive correlation with body mass index (BMI) (r=0.496, P=0.002) were obtained ().
Table 5 Correlations between baseline variables and the change ratio of the time–slope at post-PR to the time–slope at pre-PR (n=36)
Figure 5 Correlation between the ratio of the post-to-pre-change ratio of the time–slope and the baseline time–slope.
Discussion
This study shows that 1) in half of the COPD patients in the present study, PR increased Tex, but reduced peak
. The effectiveness of PR might lie in improving Tex rather than exercise tolerance. As one of the key mechanisms, both required
and
were reduced during exercise after PR, resulting in reduced ventilatory requirements without cardiac loads, which in turn might make it possible to exercise more efficiently for a long time with decreasing dyspnea. The exertional improvement was reflected in increases of
/
and
/
, and the decreases of VD/VT and ΔFO2 (the difference between the inspired gas oxygen concentration and expired gas oxygen concentration), and 2) the relationship between baseline variables and the post-to-pre-change ratio of the time–slope was investigated. A significant negative correlation with the baseline time–slope and a positive correlation with the baseline BMI were obtained, which could help predict COPD patients’ response to PR.
The most striking evidence is that PR increased Tex with economized
and
during exercise in half of the present study population, although it has been clearly demonstrated that PR increases exercise tolerance in COPD patients.Citation1,Citation3,Citation4 In the time only increased group, the
was reduced after PR at peak exercise, and both
and
were also reduced during exercise, resulting in increases of the
/
ratio and the
/
ratio. This phenomenon was different from the data that were evaluated by Casaburi et alCitation1 using incremental exercise testing in severe COPD. The
/
ratio and
/
ratio, both of which have been used to evaluate the degree of disease or the effect of interventions in COPD, have again been investigated with interest.Citation15–Citation18 To investigate what is meant by the high ventilatory equivalent ratios obtained during exercise after PR, the factors that contribute to the change in the numerator (the reduced
) and the change in the denominator (the reduced
and
) should be considered, taking into account some mechanisms. First, generally, high ventilatory equivalent ratios are obtained when wasted ventilation occurs. In this study, however, a reduced ventilatory requirement was obtained after PR. This phenomenon may be explained by the finding at peak exercise that, although compared with the two factors increased group, the mean difference from pre-PR in VT was lower in the time only increased group (P=0.043), the reduced mean difference in breathing frequency was similar in the two groups (). Furthermore, of note, despite the high ventilatory equivalent ratios, relatively low VD/VT ratios during exercise were obtained after PR in the time only-increased group. The mean difference in the VD/VT ratio was similar in the two groups after PR during CPET ( and ). Second, the timing during CPET at which the ventilatory requirement ratios were evaluated should also be confirmed, considering its lowest value (nadir) in the hyperbolic curve. Since Neder et alCitation17 reported that the nadir values were reached at peak exercise in all GOLD stage III and IV patients, it might mean that evaluation for ventilatory requirement ratios might be enough at peak exercise in such a group. In this study, however, at peak exercise as well as at iso-time, the higher ventilatory equivalent ratios obtained were similar. In addition, it should be confirmed whether they stopped exercise far before the assumed nadir. In this study, the Tex after PR was prolonged enough in each group, and the level of dyspnea was similar in the two groups; that is, these data do not show that higher ventilatory equivalent ratios were obtained due to too short Tex. Third, high ventilatory equivalent ratios were also reported in patients with cardiac disease, which decreases cardiac output.Citation19 However, there may be no clinically significant difference in cardiac function between the two groups, since after PR, the peak HR and the ratio of observed peak HR to predicted peak HR were similar in both groups. Fourth,
is determined by analysis of expired gas, including FiO2 and FeO2. ΔFO2 (FiO2 minus FeO2) was investigated as an outcome variable in this study. After PR, a significant reduction in ΔFO2 was obtained in the time only increased group during exercise ( and ; ). This phenomenon means that, because the level of FiO2 is generally constant, the level of FeO2 was increased after PR, that is, lesser oxygen could not only be achieved, but it was adequate for exercise in the time only increased group, given that the ventilatory requirements were reduced without significant cardiac loads, as discussed earlier. If so, the reasons why higher ventilatory equivalent ratios were obtained might include a reduced metabolic requirement, for example, by peripheral skeletal muscles, for a given exercise, resulting in the economized
followed by the resultant economized
.
Not only cardioventilatory dysfunction but also muscle dysfunction might explain exercise intolerance as a major consequence of COPD. It has been reported that a shift from type I (slow-twitch) fibers to type II (fast-twitch) fibers occurs commonly in advanced COPD.Citation20 It was reported that, after PR, the proportion of type IIb fibers decreased in COPD patients, and the proportion of type I fibers increased, especially in non-cachectic COPD patients.Citation21 Of note, using neuromuscular blockade to block type I fibers, Krustrup et alCitation22 demonstrated that type II-dominant fibers, which were obtained after blocking type I fibers, required higher muscle
. These reports might help to understand the findings that the
and
were economized after PR in the time only increased group, if PR could increase the proportion of type I fibers. In addition to the exercise responses, from the resting condition, a higher ventilatory equivalent ratio was confirmed in the time only increased group ( and ; ); that is, there may have been a reduced peripheral oxygen requirement from the resting condition. Furthermore, it was also reported that muscle capillarity, which is related to blood flow and oxygen delivery, was reduced in advanced COPD, and PR increased capillarity.Citation21,Citation23 Given the above findings, the phenomena in this study might be explained by the theory that an economized peripheral oxygen requirement at a given exercise might probably occur because of the change in a fiber-type profile and/or the peripheral oxygen delivery PR might induce, which in turn might be followed by the resultant economized carbon dioxide elimination. Additional studies are needed to confirm this theory.
Investigating the predictors of the response to PR may be clinically useful. shows whether exercise tolerance improved and that Tex was prolonged in the present population; both of which seem independent, but they are clinically important outcomes.Citation9 In this study, the post-to-pre-change rate of the time–slope was negatively correlated with the baseline time–slope and positively correlated with BMI, which in turn, importantly, was not correlated with baseline Tex or baseline peak
alone (, ). This means that underweight patients who have a high baseline time–slope might gain less benefit from PR based on whether their baseline exercise tolerances or Tex were or were not adequate. It has been reported that the obtained value of peak
during CPET was almost the same with different exercise loads in severe COPD, that is, the slopes of
were different.Citation24,Citation25 Therefore, more attention needs to be given to the ratio between Tex and
during exercise, and further studies should be conducted using different exercise loads to assess the benefit of PR. Nevertheless, the time–slope would potentially contribute to predicting the degree of the PR response beforehand.
This study had some limitations. First, this study was retrospective, and the number of subjects was small. A large prospective study should be conducted. Second, the duration of PR including exercise training was short. A more effective exercise training program, considering its duration, intensity, and frequency, should be explored in the future. Third, this study was primarily performed in patients with severe-to-very severe airflow limitation. Whether the present findings hold true for the total spectrum of COPD patients, evaluating not only cardioventilatory function but also peripheral oxygen delivery function, as in skeletal muscle, should be investigated and recommended as a future research direction in the field of PR.
Conclusion
As one of the key mechanisms, by which the effect of PR on Tex rather than exercise tolerance was confirmed in half of the COPD patients in this study, both
and
were economized during exercise after PR, resulting in a reduced ventilatory requirement without cardiac loads, followed by decreasing dyspnea. The exertional improvement was reflected in 1) the increases of
/
and
/
and 2) the decreases of VD/VT and the difference between the inspired gas oxygen concentration and expired gas oxygen concentration. In addition, the time–slope and BMI would potentially contribute as predictors of the response to PR beforehand. A better understanding of the physiologic benefits of PR will lead to more appropriate treatment that will improve exercise tolerance, as well as quality of life, by increasing physical activity levels.
Acknowledgments
The authors received no specific funding for this study. The authors would like to thank Mr K Tsuguchi (CMIC-PMS Co., Ltd, Tokyo, Japan), who had no relevant conflicts of interest, for performing the statistical analysis. The authors would also like to thank Ms S Ito and Ms S Sakaguchi for their help with the CPET measurements.
Disclosure
The authors report no conflicts of interest in this work.
References
- CasaburiRPorszaszJBurnsMRCarithersERChangRSCooperCBPhysiologic benefits of exercise training in rehabilitation of patients with severe chronic obstructive pulmonary diseaseAm J Respir Crit Care Med19971555154115519154855
- CelliBRDecramerMWedzichaJAATS/ERS Task Force for COPD ResearchAn official American Thoracic Society/European Respiratory Society statement: research questions in COPDEur Respir J201545487990525829431
- LavenezianaPPalangePERS Research Seminar FacultyPhysical activity, nutritional status and systemic inflammation in COPDEur Respir J201240352252922941542
- SpruitMASinghSJGarveyCAn official American Thoracic Society/European Respiratory Society statement: key concepts and advances in pulmonary rehabilitationAm J Respir Crit Care Med20131888e13e6424127811
- GarrodRFordKDalyCHoareauCHowardMSimmondsCPulmonary rehabilitation: analysis of a clinical servicePhysiother Res Int20049311112015560668
- MahlerDAWardJMejia-AlfaroRStability of dyspnea ratings after exercise training in patients with COPDMed Sci Sports Exerc20033571083108712840626
- PorszaszJEmtnerMGotoSSomfayAWhippBJCasaburiRExercise training decreases ventilatory requirements and exercise-induced hyperinflation at submaximal intensities in patients with COPDChest200512842025203416236851
- Puente-MaestuLSanzMLSanzPRuíz de OñaJMRodríguez-HermosaJLWhippBJEffects of two types of training on pulmonary and cardiac responses to moderate exercise in patients with COPDEur Respir J20001561026103210885420
- NederJAJonesPWNeryLEWhippBJDeterminants of the exercise endurance capacity in patients with chronic obstructive pulmonary disease. The power-duration relationshipAm J Respir Crit Care Med20001622 Pt 149750410934077
- NeryLEWassermanKAndrewsJDHuntsmanDJHansenJEWhippBJVentilatory and gas exchange kinetics during exercise in chronic airways obstructionJ Appl Physiol Respir Environ Exerc Physiol1982536159416026818216
- PalangePForteSOnoratiPEffect of reduced body weight on muscle aerobic capacity in patients with COPDChest1998114112189674441
- Global Initiative for Chronic Obstructive Lung DiseaseGOLD 2017 Global Strategy for the Diagnosis, Management and Prevention of COPD Available form: http://goldcopd.org/gold-2017-global-strategy-diagnosis-management-prevention-copd/Accessed February 25, 2017
- MikiKMaekuraRHiragaTAcidosis and raised norepinephrine levels are associated with exercise dyspnoea in idiopathic pulmonary fibrosisRespirology20091471020102619740262
- MaekuraRHiragaTMikiKPersonalized pulmonary rehabilitation and occupational therapy based on cardiopulmonary exercise testing for patients with advanced chronic obstructive pulmonary diseaseInt J Chron Obstruct Pulmon Dis2015101787180026366071
- ElbehairyAFCiavagliaCEWebbKAPulmonary gas exchange abnormalities in mild chronic obstructive pulmonary disease. Implications for dyspnea and exercise intoleranceAm J Respir Crit Care Med2015191121384139425826478
- NederJAAlharbiABertonDCExercise ventilatory inefficiency adds to lung function in predicting mortality in COPDCOPD201613441642427077955
- NederJAArbexFFAlencarMCExercise ventilatory inefficiency in mild to end-stage COPDEuro Respir J2015452377387
- Puente-MaestuLPalangePCasaburiRUse of exercise testing in the evaluation of interventional efficacy: an official ERS statementEur Respir J201647242946026797036
- SullivanMJCobbFRThe anaerobic threshold in chronic heart failure. Relation to blood lactate, ventilatory basis, reproducibility, and response to exercise trainingCirculation1990811 SupplII47II582295152
- MaltaisFDecramerMCasaburiRAn official American Thoracic Society/European Respiratory Society statement: update on limb muscle dysfunction in chronic obstructive pulmonary diseaseAm J Respir Crit Care Med20141899e15e6224787074
- VogiatzisISimoesDCStratakosGEffect of pulmonary rehabilitation on muscle remodelling in cachectic patients with COPDEur Respir J201036230131020110400
- KrustrupPSecherNHReluMUHellstenYSöderlundKBangsboJNeuromuscular blockade of slow twitch muscle fibres elevates muscle oxygen uptake and energy turnover during submaximal exercise in humansJ Physiol2008586246037604818955384
- SaeyDMichaudACouillardAContractile fatigue, muscle morphometry, and blood lactate in chronic obstructive pulmonary diseaseAm J Respir Crit Care Med2005171101109111515735055
- BenzoRPParameshSPatelSASlivkaWASciurbaFCOptimal protocol selection for cardiopulmonary exercise testing in severe COPDChest200713251500150517925427
- Puente-MaestuLGarcia de PedroJMartinez-AbadYRuíz de OñaJMLlorenteDCubilloJMDyspnea, ventilatory pattern, and changes in dynamic hyperinflation related to the intensity of constant work rate exercise in COPDChest2005128265165616100150