
Abstract
The alpha-1 antitrypsin (AAT) haplotype Pi*S, when inherited along with the Pi*Z haplotype to form a Pi*SZ genotype, can be associated with pulmonary emphysema in regular smokers, and less frequently with liver disease, panniculitis, and systemic vasculitis in a small percentage of people, but this connection is less well established. Since the detection of cases can allow the application of preventive measures in patients and relatives with this congenital disorder, the objective of this study was to update the prevalence of the SZ genotype to achieve accurate estimates of the number of Pi*SZ subjects worldwide, based on studies performed according to the following criteria: 1) samples representative of the general population, 2) AAT phenotyping characterized by adequate methods, and 3) selection of studies with reliable results assessed with a coefficient of variation calculated from the sample size and 95% confidence intervals. Studies fulfilling these criteria were used to develop tables and maps with an inverse distance-weighted (IDW) interpolation method, to provide numerical and geographical information of the Pi*SZ distribution worldwide. A total of 262 cohorts from 71 countries were included in the analysis. With the data provided by these cohorts, a total of 1,490,816 Pi*SZ were estimated: 708,792 in Europe; 582,984 in America and Caribbean; 85,925 in Africa; 77,940 in Asia; and 35,176 in Australia and New Zealand. Remarkably, the IDW interpolation maps predicted the Pi*SZ prevalence throughout the entire world even in areas lacking real data. These results may be useful to plan strategies for future research, diagnosis, and management of affected individuals.
Introduction
Human alpha-1 antitrypsin (AAT) is a 52-kDa glycoprotein mainly secreted by hepatocytes. Its main physiological function is to protect the matrix proteins of the lungs (especially elastin) from the proteolytic effects of proteases (especially neutrophil elastase and proteinase 3) released by activated and dying neutrophils and serine proteases released by invading bacteria.Citation1
Human AAT is codified by the SERPINA1 gene, located at the distal end of the long arm (q) of the fourteenth chromosome at position q31-32.3. This gene is organized into three noncoding exons (1A, 1B, and 1C), four coding exons (II–V), and six introns.Citation2 The AAT gene has two alleles that are transmitted by recessive autosomal codominant Mendelian inheritance.Citation3 SERPINA1 alleles are named with the prefix Pi* (protease inhibitor*).Citation4 Normal alleles are designated Pi*M, and the most prevalent deficiency alleles are Pi*S and Pi*Z, or simply S and Z. Mutated S (Glu264Val) and Z (Glu342Lys) alleles produce proteins with conformational changes that polymerize in the rough endoplasmic reticulum of the producing cells, forming stable polymers that are retained within hepatocytes without being secreted into the bloodstream and secondarily causing a decreased concentration of AAT in blood and tissues.Citation5 The vast majority of genotypes found in clinical practice are combinations of M, S, and Z alleles, that is, Pi*MM (normal genotype present in ~85%–95% of people, expressing 100% of serum AAT), Pi*MS, Pi*SS, Pi*MZ, Pi*SZ, and Pi*ZZ (five deficiency genotypes present in almost the remaining 5%–15% of the population, expressing ~80%, 60%, 55%, 40%, and 15% of AAT, respectively).Citation6
Severe alpha-1 antitrypsin deficiency (AATD) has been defined by serum AAT levels <11 µM/L (measured by the purified standard used in the U.S. Registry) or <57 mg/dL measured by a commercial standard nephelometry (to convert micromolar to milligrams per deciliter you must multiply by a conversion factor of 5.2).Citation7 This hereditary condition is characterized by an increased risk for chronic obstructive pulmonary disease (COPD) (ie, lung emphysema, persistent airflow obstruction, and/or chronic bronchitis) in adults; liver disease (ie, cholestasis, cirrhosis, and hepatocarcinoma) in children and adults; and much less frequently systemic vasculitis and neutrophilic panniculitis.Citation7 In clinical practice, 96% of pathologies associated with AATD occur in homozygous ZZ, and the remaining 4% in heterozygous SZ and the extremely infrequent “rare” and “null” genotypes.Citation8
The mean and 5th–95th percentile of AAT serum levels expressed by the SZ genotypes are 16 (10–23) µM/LCitation9 which are equivalent to 83 (52–120) mg/dL. These mean serum levels of 16 µM/L are considered sufficient to protect the lungs from proteases; however, there is a 20% of Pi*SZ individuals with AAT serum levels <11 µM/L protective threshold who are at risk for AATD-related diseases.Citation7 In fact, aggregating data from six studies demonstrated that the odds ratio (OR) for COPD in Pi*SZ compound heterozygotes compared with normal Pi*MM individuals was significantly increased at 3.26 (95% CI 1.24–8.57), these results showing that the Pi*SZ genotype is a significant risk factor for COPD.Citation10 Other studies have found that smoking entails a major risk for the development of COPD, but in the absence of smoking the risk of developing COPD by a Pi*SZ is negligible.Citation11 Although no studies have been done to assess the effects of occupational and environmental pollutants on individuals with the SZ genotype, the ATS/ERS experts seem reasonable to assume that they can be as vulnerable as individuals with the Pi*ZZ type.Citation6
The causal relationship of the SZ genotype with other pathologies other than lung emphysema is much more debatable.Citation7
Because the incidence of SZ heterozygosity is so much higher than that of ZZ homozygosity, SZ heterozygosity may be an important public health problem, since the SZ genotype may favor the development of AATD-related diseases (especially COPD in smokers). Therefore, the objective of the present study was to update the epidemiological data about the prevalence and number of Pi*SZ genotypes, by means of detailed tables and IDW interpolation maps to provide the scientific community with up-to-date reliable information of the Pi*SZ distribution worldwide.
Methods
The methodology used in the present study was practically the same as that used by the authors for a recently published paper on genetic epidemiology of the AAT-Pi*Z allele/genotypeCitation12 (the list of sources are available from the authors upon request).
Sources of the control cohort data used in the present study
The present study used the available data from epidemiological studies performed to determine the frequencies of deficiency allele combinations for PI*S and PI*Z, in the healthy control cohorts of individual case studies worldwide. The manuscripts were obtained through a variety of sources, including searches of the peer-reviewed literature from 1965 up to March 2017 on PubMed, Web of Science, Embase, and Google Scholar databases. Additional relevant studies were obtained by searching the bibliographies of the articles retrieved.Citation12–Citation23
Study selection criteria
The criteria for selection and exclusion of studies for analysis were: 1) Samples representative of the general population; 2) AAT phenotyping characterized by adequate methods, including isoelectric focusing (IEF), or, alternatively, crossed antigen–antibody electrophoresis or PCR; and 3) A coefficient of variation (CV) of the Pi*S and Pi*Z frequencies in each cohort to measure the precision of the results in terms of dispersion of the data around the mean. The value of this variable was adjusted for each country, according to the methodology used in several previous peer-reviewed publications by our group. The following studies were excluded from the analysis: 1) Cohort studies of patients with AATD-related diseases (eg, COPD, liver cirrhosis, rheumatoid arthritis, arterial dissections, etc.); 2) Screening studies in which phenotypes were determined only in samples with AAT concentrations below any given cut-off point.Citation12
Calculation of Pi allelic frequency and genotypic prevalence
Gene frequency is defined as the frequency of all genes of a particular type, whether occurring in homozygotes or heterozygotes. The total number of alleles is twice the number of subjects. Therefore, the gene frequency was obtained by adding the number of S or Z alleles and expressing this total as a fraction of the total number of Pi alleles in the population (alleles per 1,000 genes of all Pi types).
The prevalence of the SZ genotype was calculated assuming the population to be in Hardy–Weinberg equilibrium: p2 +2pq + q2 =1 (where p is the proportion of the Z allele and q is the proportion of the S allele).
In addition, 95% confidence intervals (95% CI) were calculated for allele frequencies, prevalence, and numbers of Pi*SZ.
Inverse distance-weighting (IDW) multivariate interpolation maps
Pi*SZ prevalence was used to develop maps using a geographic information system (GIS) of an inverse distance-weighted (IDW) interpolation method. IDW interpolation is based on the assumption that the attributed value of an unsampled point is the weighted average of known values within the neighborhood, and the weights are inversely related to the distances between the prediction location and the locations sampled.Citation24 With this approach, maps show quantitative diverging data (starting from zero or a reference value) displayed by two contrasting brightness red-blue ramps, with the darker colors at each end representing “the more positive” (red) and “the more negative” (blue).Citation23 According to this concept, in this study, Pi*SZ prevalence was represented by scales of 10 colors (with the range of reds representing the highest prevalence; the range of yellow and green colors depicting intermediate prevalences; and blues representing the lowest prevalence). Since the different colors correspond to numerical values, they can easily be converted into quantitative data with the naked eye.
Results
Selected cohorts and the number of subjects studied
A total of 262 cohorts (90 from Europe, 40 from America and Caribbean islands, 17 from Africa, 106 from Asia, 8 from Australia, and 1 from New Zealand) were selected. The CIA database comprised 71 of the 193 countries existing in the world. These cohorts included a total of 205,273 subjects, distributed as follows: 79,118 in America and Caribbean; 75,603 in Europe; 38,682 in Asia; 5,031 in Africa; 5,536 in Australia, and 1,303 in New Zealand.
Prevalence and the number of Pi*SZ genotypes
– show the population of each country and the corresponding Pi*S and Pi*Z frequencies (expressed per 1,000, with 95% CI) extracted from the selected studies. These basic data were used to calculate the SZ prevalence (with the Hardy–Weinberg formula) and the number of SZ (with 95% CI) in each of the selected countries.
Table 1 Estimated Pi*S and Pi*Z gene frequencies, Pi*SZ gene prevalence, and Pi*SZ number in 23 European countries with reliable data
Table 2 Estimated Pi*S and Pi*Z gene frequencies, Pi*SZ gene prevalence, and Pi*SZ number in 21 American and Caribbean countries
Table 3 Estimated Pi*S and Pi*Z gene frequencies, Pi*SZ gene prevalence, and Pi*SZ number in 10 African countries
Table 4 Estimated Pi*S and Pi*Z gene frequencies, Pi*SZ gene prevalence, and Pi*SZ number in 15 Asian countries
Table 5 Estimated Pi*S and Pi*Z gene frequencies, Pi*SZ gene prevalence, and Pi*SZ number in Australia and New Zealand
Europe
In Europe (), the mean SZ prevalence by regions (from the highest to the lowest) was as follows: Southern Europe, 1 SZ per 483 subjects (1:483); Western Europe, 1:581; Northern Europe, 1:1,492; Central Europe, 1:1,712; and Eastern Europe, 1:11,818.
The mean SZ prevalence by countries (from the highest to the lowest) was as follows: Portugal, 1:205; Spain, 1:278; Latvia, 1:354; France, 1:413; Republic of Ireland, 1:424; Belgium, 1:551; the Netherlands, 1:617; UK, 1:900; and it was over 1 per 1,000 in the rest of European countries, reaching the minimum prevalence of almost 1:25,000 in Russia.
Consistent with the prevalence and number of inhabitants, the total number of SZ in Europe was 708,792 and their distribution by regions (from highest to lowest) was as follows: Western Europe, 295,187; Southern Europe, 291,856; Central Europe, 86,544; Northern Europe, 27,815; and Eastern Europe, 7,389.
By individual countries, the highest numbers were found in Spain (ie, 174,822), followed by France (161,680), UK (73,973), Italy (64,137), Germany (60,396), and Portugal (52,836). The SZ numbers in the other countries were very variable, but always much lower than the above mentioned.
America and Caribbean
In America (), the highest prevalence was found in Canada with 1 SZ per 907 subjects (1:907) and the USA (1:1,018). SZ prevalence was twice lower in Central and South America and Caribbean Islands, with an approximate mean value of ~1:2,000.
In concordance with the prevalence and number of inhabitants of each country, the total number of SZ was 582,984, and the estimated number for geographic regions (from highest to lowest) was as follows: North America; 343,229; South America; 207,446; Central America and Caribbean, 32,309.
By individual countries, the highest numbers were found in the non-Hispanic white population from USA (ie, 254,641), followed by Brazil (105,486), Mexico (49,590), Canada (38,997), Venezuela (25,103), Colombia (23,327), and Argentina (18,133). In the remaining countries, the numbers were very variable, but always much lower than the above mentioned.
Africa
In Africa (), the highest prevalence was in Nigeria with 1 SZ per 2,209 subjects (1:2,209) and Somalia (1:2,509). Prevalence was three times lower in Cape Verde Islands. In the rest of African countries, the prevalence was so low that it was practically unmeasurable.
In concordance with the prevalence and the number of inhabitants of each country, the total number of SZ was 85,925; 98% of them in Nigeria; 1,437 in Somalia; 175 in Morocco, and 88 in Cape Verde. Remarkably, in most African countries, no SZ genotypes were found.
Asia
In Asia (), the highest prevalence was found in Thailand with 1 SZ per 1:2,247 subjects (1:2,247), followed by Pakistan (1:4,824) and Iran (1:9,614). In the remaining countries, the SZ prevalence was so low that it was practically unmeasurable.
In concordance with the prevalence and number of inhabitants of each country, the total number of SZ was 77,940 (most of them in Pakistan and Thailand). Remarkably, in the vast majority of Asian countries, there were no SZ genotypes.
Australia and New Zealand
In Australia and New Zealand (), the SZ prevalence was 1:840 and 1:574, respectively, both values being very similar to those found in the Republic of Ireland and UK.
In concordance with the prevalence and number of inhabitants, the calculated total number of SZ was 35,176 (27,380 in Australia and 7,796 in New Zealand).
IDW interpolation maps of Pi*SZ prevalence
Europe
shows an IDW interpolation map, with the Pi*SZ prevalence found in European countries. Black points indicate the places where the studies that provided the data were conducted. Areas in dark red correspond to the regions of the highest prevalence, ranging from 1:205 in Portugal (the highest in the world) to ~1:300–500 in Spain, Latvia, France, and Republic of Ireland. Light red areas correspond to a prevalence range of 1:501–2,000. Dark yellow corresponds to a range of 1:2,001–2,500. Light yellow corresponds to a range of 1:2,501–5,000. Yellow green corresponds to a range of 1:5,001–25,000. Finally, medium blue and dark blue areas correspond to a range of 1:25,001–50,000 and 1:>50,000, respectively.
Figure 1 Distribution of SZ prevalence in Europe.
Abbreviation: IDW, inverse distance-weighted.
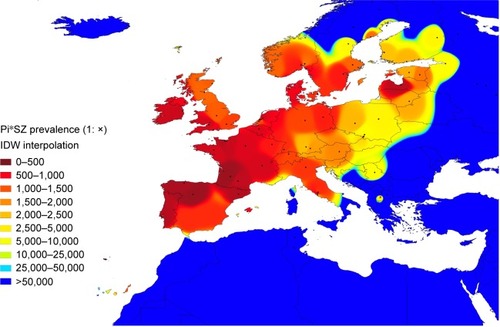
Interpolation maps have the important advantage of being able to provide data from regions lacking studies, based on the available data from other neighboring regions. In this regard, some of the Canary Islands closer to the coasts of Morocco appear stained with light red and yellow, suggesting that they may have a relatively high SZ prevalence of ~1:1,000–2,000. Belarus, western of Ukraine, Czech Republic, Slovakia, Hungary, or Croatia appear stained in light yellow, suggesting that they may have a moderate prevalence of SZ of ~1:2,500–5,000. The blue colors from Romania, Bulgaria, Turkey, mainland Greece, and its islands are indicative of very low prevalence (as is the case in the whole of northern Africa and the Middle East, included in this map for comparison).
America, Africa, Asia, Australia, and New Zealand
shows a Pi*SZ prevalence IDW interpolation map of the world. Points indicate the places where the selected studies were conducted, and the 10-color scale is the same as previously described.
Figure 2 Distribution of SZ prevalence in the world.
Abbreviation: IDW, inverse distance-weighted.
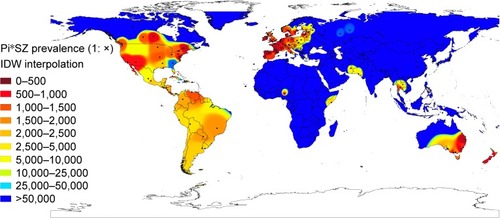
Outside Europe, there are very high SZ frequencies in large areas of Canada and the USA, which appear almost totally stained in red and yellow, except in some southern states stained in medium blue, such as Georgia (with a population of African Americans, Asian Americans, Hispanics, and Latinos of 40%, very close to that of the American whites). There are also very high frequencies in the east and south of Australia, Tasmania, and throughout New Zealand.
In Central America, the Caribbean Islands, and South America, there are predominate yellow tones, indicative of a SZ intermediate mean prevalence of ~1:2,000, with the exception of Venezuela and Brazil that have a higher prevalence. However, the low number of points in Central America, the Caribbean, and South America significantly reduces the reliability of these findings.
Interestingly, several coastal regions bathed by the Indian Ocean, including the Horn of Africa (Somalia), Iran, Pakistan, and Thailand, appear stained with various shades of yellow, indicating moderate or low prevalence of SZ genotypes in these areas.
In contrast, blue colors, indicative of very low or nonexistent SZ types, predominate in the Arctic regions, and in most parts of Russia, Asia, Indonesia, Africa, and northern Australia.
Discussion
The results of this analysis show that compound heterozygous SZ is relatively frequent in Caucasian subjects living in Europe, the American continent, Australia, and New Zealand. Anecdotally, low or moderate values of SZ prevalence have been found in some countries populated by non-European people from West and Northeast Africa and South Asia. However, the paucity of available studies in these countries greatly reduces the reliability of the results. Interestingly, the IDW interpolation maps detected some unexpectedly high prevalence of SZ genotypes in numerous regions around the world completely lacking in studies, such as the Canary Islands, Eastern Europe, Mexico, Central and South America, Tasmania, etc., and also showed much higher prevalence than previously thought in the USA, Canada, Australia, and New Zealand.
Summarizing the findings of this study, it could be concluded that of the ~1.5 million people with SZ genotype worldwide, 48% are in southern, western, northern, and central Europe; 39% in America (the majority in North America, Brazil, Venezuela, and Colombia); and the remaining 13% in white individuals residing in New Zealand and Australia, and in a small number of African and Asian subjects unevenly distributed throughout Africa, and western and southern Asia.
The authors are aware that, despite having tried to make the best possible selection of studies, the estimates of this study may have biases related to the composition of the samples studied, which included newborns, blood donors, school or college students, soldiers, hospital staff, persons undergoing pre-employment or routine medical examinations, active workers, natives with specific genetic traits, a mixture of subjects generically called “healthy unrelated people,” etc. Really, only a few samples from a minority of studies were representative of the general population. Another bias that may distort the results of this study is that they were necessarily based on the available data of only 37% of all the countries in the world. IDW interpolation maps were created to solve this problem, providing data to regions lacking these maps. In any case, the data estimated by IDW interpolation are much more reliable the greater the number of real data and the closer they are to one another. The points close to each other allow more precise estimates than distant points. Therefore, this technique is more reliable if the data are dense and evenly spaced. In this sense, in large regions of the world, such as South America, Africa, and large regions of Asia, not only data shortages were found but also large distances between points, which reduce the accuracy of these interpolated values. In addition, because IDW computes an average value, the value calculated for a non-sampled point can never be higher than the maximum value for a sample point or lower than the minimum value of the sample point, so this technique may be wildly inaccurate in some locations. Nevertheless, the findings of this study seem to be in accordance with the reported S and Z frequency distribution worldwide,Citation12–Citation23 and with the hypothesis that both deficiency alleles originate from Caucasians living in Europe at different historical times. It is believed that the Pi*Z mutation has a relatively recent origin in Caucasians living in northern Europe ~2,000 years or 66 generations ago (one generation =30 years),Citation25 and it was spread into the rest of the continent through maritime and inland waterways, via Baltic countries. On the other hand, it has been proposed that the S variant emerged in the Iberian Peninsula 300–450 generations ago (ie, 10–15,000 years ago), and in the Franco-Cantabrian refuge area during the last glacial era, spreading from there by people who later repopulated Europe.Citation26 Then, especially from the 16th-century AD, Europeans dispersed both genes for non-European countries to which they colonized or where they emigrated.
Since SZ genotypes express serum levels ranging from 10 to 23 µM/L, and 20% of them express concentrations below the protective level of 11 µM7 leading experts on the subject have estimated that ~10% of SZ individuals may develop emphysema particularly if they have a history of smoking,Citation27 and besides a possibly smaller but unknown percentage of SZ, individuals may develop liver cirrhosis, systemic vasculitis, or panniculitis. Therefore, if these previous assumptions were true, 10% (ie, 150,000 of the 1.5 million estimated SZs in the world) would be at high risk for COPD.
Both PiZ and PiS proteins form polymers that are retained within the endoplasmic reticulum of hepatocytes causing continued cell stress, and over time cell death and repair, leading in some cases to liver damage, fibrosis, cirrhosis, and carcinomas, whereas the lack of circulating protein promotes the development of COPD.Citation28,Citation29 However, while in the Z mutation intracellular polymerization/retention occurs in 85%–90% of the molecules, in the S mutation polymerization occurs at most in 60% of them.Citation30 In addition, the dramatic conformational changes of the Z protein determine a loss of 80% of its functional activity. In contrast, the conformational changes of the S protein are much less dramatic, having a normal serum half-lifeCitation31 and an association rate constant for neutrophil elastase that is close to normal, retaining its inhibitory capacity unchanged.Citation32
Interestingly, in AATD heterozygotes, the composition of their circulating AAT is inversely proportional to the amount of liver polymerization/retention of each type of AAT. For example, in a recent study, the percentage of Z protein in MZ patients was only 18% and that of S protein in MS patients was 37%.Citation33 In this regard, although the composition of serum AAT in SZ patients has not been sufficiently studied, it seems logically reasonable to accept that it could be ~70% S and 30% Z. This would mean that some SZs with AAT levels close to the lower limit, having two-third of the circulating AAT of S-type (ie, efficient) and 1/3 of Z-type (ie, poorly efficient), may be below the protective level, and therefore at increased risk for AATD-related disease development.
Pioneering researchers from Europe and the USA reported an increased risk of developing COPD in a short series of subjects with SZ phenotypes,Citation34,Citation35 and these results have been confirmed in subsequent studies.Citation11,Citation36
The data provided by some Registries of Patients with AATD have generally coincided with those findings. For example, researchers from the Spanish Registry of Patients with AATD reported the data of 348 Pi*ZZ, 100 Pi*SZ, and 21 carriers of rare deficiency variants, noting that Pi*ZZ showed more severe impairment in lung function and younger age at baseline compared with Pi*SZ subjects.Citation37 In this same way, an observational study in 547 ZZ and 547 SZ patients registered in the Spanish and Italian national registries showed that SZ patients were older at diagnosis and had better preserved lung function, despite a higher smoking consumption.Citation38 Also, a comparative study between 63 PiSZ and 63 PiZZ subjects from the UK AATD registry showed that subjects with Pi*SZ type showed less emphysema on CT scans, more apical predominance, less abnormal respiratory physiology test results, but similar health status impairment compared with matched subjects Pi*ZZ.Citation39
The massive neonatal screening conducted by Sveger et al between 1972 and 1974 in 200,000 Swedish newborns detected 127 individuals Pi*ZZ and 54 Pi*SZ, who has been followed up regularly.Citation40 At age 26, SZ individuals (5% smokers) had normal lung function test results, and a negligible percentage had marginal deviations in liver test results.Citation41 In subsequent checkups, the lung function and quality of life of SZ patients remained quite well preserved.Citation42
In addition, a meta-analysis performed by Dahl et al showed that pooled data from six studies found that the OR for COPD of the SZ heterozygotes was moderately but significantly increased with respect to that of the MM subjects.Citation10
Therefore, in the absence of definitive evidence, it is generally accepted that individuals who have the Pi*SZ genotype with serum AAT levels below the protective threshold value have an increased risk of developing lung disease, especially if they smoke or if they are exposed to occupational and environmental pollutants.Citation6
The association between SZ heterozygosity and the risk of developing a chronic liver disease, panniculitis, and granulomatosis with polyangiitis is controversial, but in any case incomparably smaller than that of homozygotes ZZ.Citation7
In conclusion, compound heterozygous SZ is relatively frequent in Caucasian subjects resident in Europe, and in their descendants residing in the American continent, Australia, and New Zealand. Since ~10% of SZ individuals may develop emphysema particularly if they have a history of smoking,Citation27 at least 150,000 of the 1.5 million estimated SZs in the world would be at high risk for COPD, and therefore, knowledge of the SZ prevalence of AATD in every community may be important for patients, physicians, and health authorities, to increase the diagnosis and to implement appropriate preventive measures.
Author contributions
This study was designed by IB, PB, and ID. IB provided the database and wrote the draft document. PB, SP-H, BL, FC, CE, and MM collaborated in the redaction and revision of the manuscript. ID designed the IDW figures summarizing the database. All authors contributed toward data analysis, drafting and revising the paper, gave final approval of the version to be published, and agree to be accountable for all aspects of the work.
Disclosure
The authors report no conflicts of interest in this work.
References
- de SerresFBlancoIRole of alpha-1 antitrypsin in human health and diseaseJ Intern Med201427631133524661570
- LongGLChandraTWooSLCDavieEWKurachiKComplete sequence of the cDNA for human alpha-1-antitrypsin and the gene for the S variantBiochemistry198423482848376093867
- BrantlyMNukiwaTCrystalRGMolecular basis of alpha-1-antitrypsin deficiencyAm J Med19888413313289385
- CoxDWJohnsonAMFagerholMReport of nomenclature meeting for alpha-1 antitrypsinHum Genet1980534294336102963
- LomasDAMahadevaRAlpha1-antitrypsin polymerization and the serpinopathies: pathobiology and prospects for therapyJ Clin Invest20021101585159012464660
- American Thoracic Society/European Respiratory Society Statement: standards for the diagnosis and management of individuals with alpha1-antitrypsin deficiencyAm J Respir Crit Care Med200316881890014522813
- StollerJKLacbawanFLAboussouanLSAlpha-1 antitrypsin deficiencyPagonRAAdamMPArdingerHHWallaceSEAmemiyaABeanLJHBirdTDLedbetterNMeffordHCSmithRJHStephensKGeneReviews® [Internet]Seattle (WA)University of Washington, Seattle1993–2017 updated January 19, 2017
- BrantlyMLPaulLDMillerBHFalkRTWuMCrystalRGClinical features and history of the destructive lung disease associated with alpha-1-antitrypsin deficiency of adults with pulmonary symptomsAm Rev Respir Dis19881383273363264124
- BrantlyMLWittesJTVogelmeierCFHubbardRCFellsGACrystalRGUse of a highly purified alpha 1-antitrypsin standard to establish ranges for the common normal and deficient alpha 1-antitrypsin phenotypesChest19911007037081889260
- DahlMHershCPLyNPBerkeyCSSilvermanEKNordestgaardBGThe protease inhibitor PI*S allele and COPD: a meta-analysisEur Respir J200526677615994391
- TurinoGMBarkerAFBrantlyMLClinical features of individuals with PI*SZ phenotype of alpha 1-antitrypsin deficiency. alpha 1-Antitrypsin Deficiency Registry Study GroupAm J Respir Crit Care Med1996154171817258970361
- BlancoIBuenoPDiegoIAlpha-1 antitrypsin Pi*Z gene frequency and Pi*ZZ genotype numbers worldwide: an updateInt J Chron Obstruct Pulmon Dis20171256156928243076
- HutchisonDCAlpha 1-antitrypsin deficiency in Europe: geographical distribution of Pi types S and ZRespir Med1998923673779692092
- BlancoIFernándezEBustilloEFAlpha-1-antitrypsin PI phenotypes S and Z in Europe: an analysis of the published surveysClin Genet200160314111531967
- BlancoIBustilloEFRodríguezMCDistribution of a1-antitrypsin PI S and PI Z frequencies in countries outside Europe: a meta-analysisClin Genet20016043144411846735
- MiravitllesMAlpha1-antitrypsin deficiency: epidemiology and incidenceRespir Med20029620511905555
- de SerresFJWorldwide racial and ethnic distribution of alpha1-antitrypsin deficiency: summary of an analysis of published genetic epidemiologic surveysChest20021221818182912426287
- de SerresFJBlancoIFernández-BustilloEEthnic differences in alpha-1 antitrypsin deficiency in the United States of AmericaTher Adv Respir Dis2010426370
- de SerresFJBlancoIFernández-BustilloEHealth implications of alpha1-antitrypsin deficiency in Sub-Sahara African countries and their emigrants in Europe and the New WorldGenet Med2005717518415775753
- BlancoIde SerresFJFernandez-BustilloELaraBMiravitllesMEstimated numbers and prevalence of PI*S and PI*Z alleles of alpha1-antitrypsin deficiency in European countriesEur Respir J200627778416387939
- de SerresFJBlancoIFernández-BustilloEEstimated numbers and prevalence of PI*S and PI*Z deficiency alleles of alpha1-antitrypsin deficiency in AsiaEur Respir J2006281091109917005586
- de SerresFJBlancoIPrevalence of α1-antitrypsin deficiency alleles PI*S and PI*Z worldwide and effective screening for each of the five phenotypic classes PI*MS, PI*MZ, PI*SS, PI*SZ, and PI*ZZ: a comprehensive reviewTher Adv Respir Dis2012627729522933512
- BlancoIde SerresFJCárcabaVLaraBFernández-BustilloEAlpha-1 antitrypsin deficiency PI*Z and PI*S gene frequency distribution using on maps of the world by an inverse distance weighting (IDW) multivariate interpolation methodHepat Mon20121210 HCCe7434.2423166537
- LuGYWongDWAn adaptive inverse-distance weighting spatial interpolation techniqueComput Geosci20083410441055
- LaceBSvegerTKramsACernevskaGKruminaAAge of SERPINA1 gene PI Z mutation: Swedish and Latvian population analysisAnn Hum Genet20087230030418294358
- LuisettiMSeersholmNAlpha1-antitrypsin deficiency. 1: epidemiology of alpha1-antitrypsin deficiencyThorax20045916416914760160
- McElvanyNCrystalRGClinical manifestations of α1AT deficiencyCrystalRGAlpha1-antitrypsin deficiencyNew YorkMarcel Dekker1996227243
- LomasDAEvansDLFinchJTCarrellRWThe mechanism of Z alpha 1-antitrypsin accumulation in the liverNature19923576056071608473
- TeckmanJHLiver disease in alpha-1 antitrypsin deficiency: current understanding and future therapyCOPD201310Suppl 13543
- ElliottPRSteinPEBiltonDCarrellRWLomasDAStructural explanation for the dysfunction of S α1-antitrypsinNat Struct Biol199639109118901864
- JeppssonJOLaurelCBNosslinBCoxDWCatabolic rate of alpha1-antitrypsin of Pi types S, and MMalton and of asialylated M-protein in manClin Sci Mol Med197855103107307478
- OgushiFHubbardRCFellsGAEvaluation of the S-type of alpha-1-antitrypsin as an in vivo and in vitro inhibitor of neutrophil elastaseAm Rev Respir Dis19881373643703257660
- DonatoLJKarrasRMKatzmannJAMurrayDLSnyderMRQuantitation of circulating wild-type alpha-1-antitrypsin in heterozygous carriers of the S and Z deficiency allelesRespir Res2015169626243289
- LarssonCDirksenHSundströmGErikssonSLung function studies in asymptomatic individuals with moderately (Pi SZ) and severely (Pi Z) reduced levels of alpha1-antitrypsinScand J Respir Dis1976572672801087749
- GadekJECrystalRGα1-antitrypsin deficiencyStansburyJBWyngaardonJBFredericksonDSGoldsteinJIBrownMSThe metabolic basis of inherited disease5th edNew YorkMcGraw-Hill1982450467
- HutchisonDCTobinMJCookPJAlpha 1 antitrypsin deficiency: clinical and physiological features in heterozygotes of Pi type SZ. A survey by the British Thoracic AssociationBr J Dis Chest19837728346602622
- LaraBMiravitllesMSpanish registry of patients with alpha-1 antitrypsin deficiency; comparison of the characteristics of PISZ and PIZZ individualsCOPD201512Suppl 1273125938288
- PirasBFerrarottiILaraBClinical phenotypes of Italian and Spanish patients with α1-antitrypsin deficiencyEur Respir J201342546423222880
- HolmeJLStockleyRACT scan appearance, densitometry, and health status in protease inhibitor SZ alpha1-antitrypsin deficiencyChest20091361284129019892672
- SvegerTLiver disease in alpha1-antitrypsin deficiency detected by screening of 200,000 infantsN Engl J Med1976294131613211083485
- PiitulainenECarlsonJOhlssonKSvegerTAlpha1-antitrypsin deficiency in 26-year-old subjects: lung, liver, and protease/protease inhibitor studiesChest20051282076208116236857
- TanashHANystedt-DüzakinMMonteroLCSvegerTPiitulainenEThe Swedish α1-antitrypsin screening study: health status and lung and liver function at age 34Ann Am Thorac Soc20151280781225803183