
Abstract
The study aimed to determine the relationship between throat microbiome and COPD. Sixty-five Chinese males (n=20, smokers without COPD; n=45 smokers with COPD) were included. Nonmetric multidimensional scaling indicated differences of microbiome between COPD and controls, but no difference was observed between COPD patients with differing degrees of lung function or disease severity. Rarefaction analyses suggested that operational taxonomic units (OTUs, species-level) richness decreased in COPD. The dominant taxa between COPD and controls were similar, but the proportions of taxonomic distribution were different. The dominant phyla were Bacteroidetes, Proteobacteria, Firmicutes and Fusobacteria. The dominant genera were Haemophilus, Leptotrichia, Porphyromonas, Fusobacterium, Veillonella, Streptococcus, Neisseria and Prevotella. Two dominant OTUs, otu3 (Veillonella_dispar) and otu4 (Streptococcus_unclassified), were identified. Otu3 and its father-level taxa, which were negatively correlated with predicted percent of forced expiratory volume in a second (FEV1%pred), were increased in COPD. By contrast, otu4 and its father-level taxa, which were positively correlated with FEV1%pred, were decreased in COPD. Otu4 also showed a slight potential as a COPD biomarker. To conclude, the throat microbiome was different between smokers with or without COPD, which is similar to findings from the lower respiratory tract. This study may strengthen our understanding of the relationship between microbiomes of different airway sites and COPD.
Introduction
COPD, a common inflammatory pulmonary disease that is characterized by incompletely reversible airflow limitation and progressive loss of alveolar spaces, results in a considerable mortality and economic burden.Citation1 Bacterial infection or colonization is considered to be a key causative factor of the occurrence and progression of COPD.Citation2 In the past, the relationship between COPD and pathogens was investigated in terms of culture-dependent methods,Citation3,Citation4 but this method only identified limited bacterial types.
Recently, high-throughput microbiome strategies have been applied to the COPD field and have identified the microbial features of COPD patients.Citation5,Citation6 These studies predominantly focused on bacterial communities of lower airway using induced sputum or bronchoalveolar lavage fluid (BALF) samples.Citation7–Citation9 However, microbiome studies of throat samples are limited.Citation10,Citation11 Moreover, the goal of these studies was to identify differences of throat flora between COPD and asthma patients,Citation10,Citation11 restricting deep analyses for the throat microbiome of COPD.
To our knowledge, the relationship between oropharyngeal microbial communities and COPD progression has not been determined. Throat swab is easier to collect than induced sputum and is safer than BALF, indicating that it may have a potentially wider clinical application than other samples. Thus, the present study aimed to compare the microbial communities of the throat between smokers and COPD patients with different degrees of lung function or disease severity.
Methods
Participants
A total of 65 subjects (n=20, smokers without COPD; n=45 smokers with COPD) were recruited in the clinic of Peking University Third Hospital from November 2015 to February 2016. The study was approved by the Peking University Institutional Review Board and was strictly carried out in terms of experimental protocols. Written informed consent was obtained from all participants. These patients have been previously diagnosed as COPD and followed up in our clinic, but in this enrollment, they were still required to conduct a spirometry test. The predicted percent of forced expiratory volume in a second (FEV1%pred) and the ratio of residual capacity and total lung capacity (RV/TLC) were determined through a ventilator (SensorMedics, Yorba Linda, CA, USA). All participants reported that they had no special diet habit, no known periodontal disease, no systematic antibiotics in 3 months, and did not use antiseptic mouthwash, corticosteroids and bronchodilators within 12 h before sample collection. Long-standing drug information, age, body mass index (BMI) and smoking history were also acquired by self-report of subjects.
Patients with COPD were included based on the following criteria: 1) males of 40–80 years, 2) smoking index of greater than 10 pack-years, and 3) diagnosed as a clinically stable stage of COPD according to the Global Initiative on Obstructive Lung Disease (GOLD),Citation12 with a post-bronchodilator ratio of FEV1 and forced vital capacity <0.70, without an exacerbation within 8 weeks. Selected patients were excluded based on the following: 1) diagnosed with severe hepatic, cardiovascular, mental or renal dysfunction, 2) diagnosed with asthma, pulmonary cystic fibrosis or active pulmonary tuberculosis in 3 months and 3) had received immunosuppressive medications. In terms of severity of lung function, COPD patients were divided into two subgroups: group 1 (n=24, FEV1%pred ≥50%) and group 2 (n=21, FEV1%pred <50%). According to GOLD classification,Citation12 COPD patients were separated into GOLD_A, GOLD_B, GOLD_C and GOLD_D. Male smokers without COPD were selected as a control group, whose lung function and baseline information were also collected.
Sample collection
Sampling was conducted carefully in case of saliva contamination from other surfaces (ie, tongue and teeth) through a tongue depressor. Only posterior oropharynx was sampled using sterile cotton swabs by an experienced technician. After swabbing, the swab tips were put into sterile container and stored at −80°C until further DNA extraction.
DNA extraction, amplification and sequencing
Each collected swab was randomly allotted to a new identifier for blindness. Bacterial DNA was extracted from all samples using the Qiagen DNA Extraction kit (Qiagen, Hilden, Germany) according to the modified protocol developed by the laboratory of Gary B Huffnagle.Citation13 Amplification and sequencing of throat samples were performed at BGI (Shenzhen, China) in terms of Roche 454-based sequencing protocols.Citation14,Citation15 Briefly, the V3–V5 regions of the gene encoding 16S ribosomal RNA (rDNA) were amplified by polymerase chain reaction using the forward primer (5′-CCGTCAATTCMTTTGAGTTT-3′) and the reverse primer (5′-ACTCCTACGGGAGGCAGCAG-3′) with sample-specific barcodes. After purification of amplicons, sequencing was conducted through 454 platform (Roche Applied Science, Basel, Switzerland).
Microbial analysis
Raw sff. files were processed by Mothur software (v.1.38.1, http://www.mothur.org) as described previously.Citation16 All sequences were aligned through a NAST-based sequence aligner to a custom reference sequence based on the SILVA alignment (v102). Processed sequences were classified by a Ribosomal Database Project training set. High-quality sequences were annotated to specific operational taxonomic units (OTUs) at a 3% distance cutoff.
Statistical analysis
Nonmetric multidimensional scaling (NMDS) based on jclass distance and analysis of molecular variance (AMOVA) were used to determine differences in bacterial communities between groups. Rarefaction curves with repeated-measures analysis of variance (ANOVA) were used to detect differences of OTU richness in the different groups. The Shannon and inverse Simpson indexes were calculated by Mothur software. The proportion of taxonomic distribution was compared by Fisher’s exact test. The relative abundance of specific taxa and OTUs between COPD and controls was compared by Mann–Whitney U (M-U) tests. False discovery rate (FDR) was used to correct multiple testing. Bacteria with the raw P<0.05 and the FDR <0.2 were viewed as prominent ones. Correlations of bacterial taxa and clinical information were analyzed by Spearman coefficient. Receiver operating characteristic (ROC) curve analysis was performed to evaluate bacterial potential as a COPD marker. Statistical analyses were performed by SPSS 19.0, R software 3.3.0, MedCalc 15.1 or GraphPad Prism 5.0.
Results
Study participants
Baseline information for the 65 male subjects (n=20, smokers without COPD; n=45, smokers with COPD) is summarized in . COPD patients were divided into two subgroups: group 1 (n=24, FEV1%pred ≥50%) and group 2 (n=21, FEV1%pred <50%). Age, BMI and smoking history were not statistically different between COPD and controls. Usage of long-acting inhaled bronchodilators was very similar, but that of inhaled corticosteroids (ICSs) was obviously different between group 1 and group 2. More details are presented in .
Table 1 Baseline data of subjects in different groups
Comparison of bacterial communities among controls, group 1 and group 2
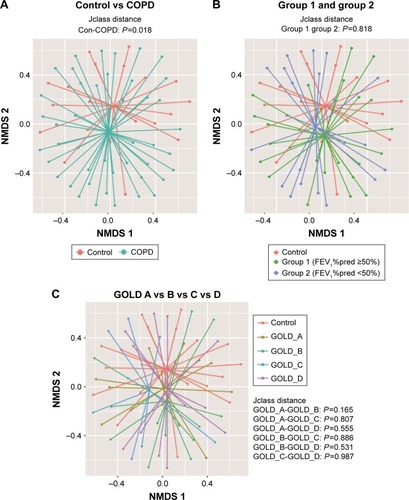
To compare bacterial communities among different groups, unsupervised NMDS was used for data visualization, and AMOVA was used to determine statistical differences, as shown in . indicated a spatial separation between the COPD and the control groups (P=0.018, jclass distance matrix, AMOVA); illustrated that the centroids were close between group 1 and group 2 (P=0.818, jclass distance matrix, AMOVA); and presented that no shift was observed between different GOLD stages. The NMDS and AMOVA based on Bray–Curtis distance matrix also showed a similar result, as presented in Figure S1.
Figure 1 Comparison of bacterial communities between smokers with or without COPD.
Abbreviations: AMOVA, analysis of molecular variance; FEV1%pred, predicted percent of forced expiratory volume in 1 s; GOLD, Global Initiative on Obstructive Lung Disease; NMDS, nonmetric multidimensional scaling.
Rarefaction and alpha diversity analyses among controls, group 1 and group 2
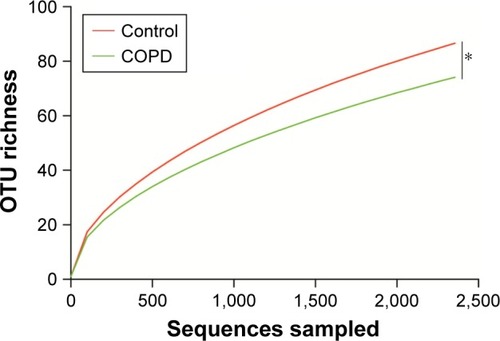
Rarefaction curve showed that OTU richness of COPD was lower than that of controls (P<0.05, repeated-measures ANOVA), as presented in . However, the OTU richness was not different between group 1 and group 2 or between different GOLD stages, as shown in Figure S2A and B, respectively. These implied that OTU richness of COPD patients was decreased compared with that of the controls and was not associated with severity of disease or lung function. Figure S3 shows a decreased trend of Shannon and Simpson indexes in COPD patients compared with those of the controls. Similarly, no alteration was observed in COPD patients with different lung functions.
Figure 2 Rarefaction curve analyses for smokers with or without COPD.
Abbreviations: OTU, operational taxonomic unit; COPD, chronic obstructive pulmonary disease.
Taxonomic distribution between smokers with or without COPD
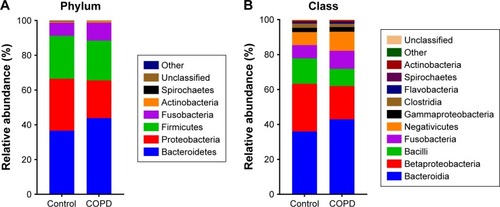
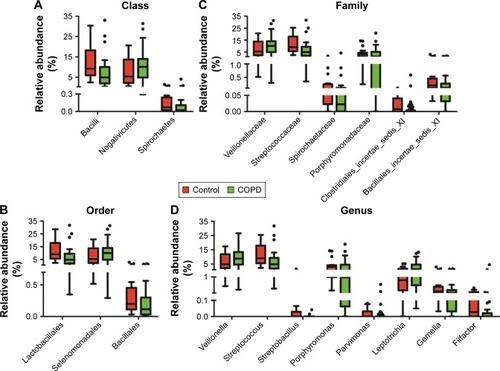
shows that the dominant taxa were the same, but the taxonomic distribution was different between the COPD patients and controls (P<0.05, Fisher’s exact test) from phylum to genus level. The dominant phyla (>1%) were Bacteroidetes, Proteobacteria, Firmicutes and Fusobacteria. The dominant genera (>1%) were Haemophilus, Leptotrichia, Porphyromonas, Fusobacterium, Veillonella, Streptococcus, Neisseria and Prevotella. More detailed information is illustrated in .
Figure 3 Taxonomic distribution between controls and COPD patients.
Prominent bacterial taxa between smokers with or without COPD
To explain the differences of taxonomic distribution between the COPD and the control groups, all prominent bacteria, with a P<0.05 calculated by M-U test and FDR <0.2, are shown in . More details are listed in Table S1. At the (A) class, (B) order, (C) family and (D) genus level, we separately identified three, three, six and eight prominent bacterial taxa. No significant bacteria were found in phylum level. Notably, two highly abundant genera, Streptococcus and Veillonella, and their corresponding classes (Bacilli, Negativicutes), orders (Lactobacillales, Selenomonadales) and families (Streptococcaceae, Veillonellaceae) were significantly different between the COPD and the control groups. The abundance of Veillonella was increased in the COPD (8.8 [4.6–13.4]) vs the control groups (4.8 [2.2–9.9]); by contrast, Streptococcus abundance was decreased in the COPD (4.8 [1.9–8.2]) vs the control groups (9.0 [5.7–17.3]). No differentially expressed bacteria were detected between group 1 and group 2.
Figure 4 Prominent taxa from phylum to genus level between COPD and controls.
Abbreviation: FDR, false discovery rate.
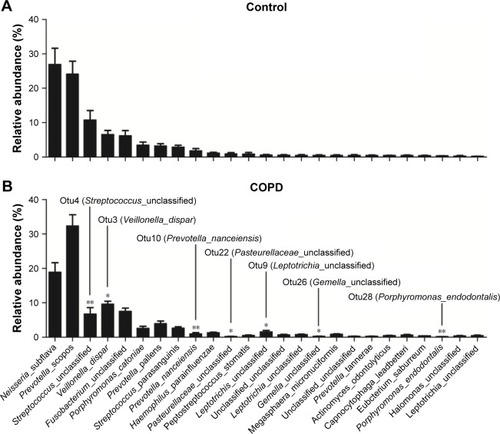
The most abundant OTUs (species level) between COPD and controls
shows an overview of the 25 most abundant OTUs (species level). A total of seven significantly different OTUs were identified between the COPD and the controls. Interestingly, two highly abundant bacteria, otu3 (dispar) and otu4 (unclassified), were classified to the previously identified genera Veillonella and Streptococcus, respectively. Unfortunately, otu4 was not classified to the species level.
Figure 5 Relative abundance of the 25 most abundant OTUs detected in smokers with or without COPD.
Abbreviations: FDR, false discovery rate; OTUs, operational taxonomic units.
Relationship between the throat microbiome and lung function
To explore the relationship between different microbial taxa and lung function, Spearman correlation analyses were performed as listed in . Some taxa showed a correlation with FEV1%pred or RV/TLC. Otu4 (unclassified) and its corresponding father-level Bacilli (class), Lactobacillales (order), Streptococcaceae (family) and Streptococcus (genus) were positively related to FEV1%pred (r=0.391, 0.354, 0.352, 0.352 and 0.352, respectively) and negatively related to RV/TLC (r=−0.263, −0.234, −0.235, −0.234 and −0.234, respectively). By contrast, otu3 (dispar) and its father-level Negativicutes (class), Selenomonadales (order), Veillonellaceae (family) and Veillonella (genus) were negatively correlated with FEV1%pred (r=−0.300, −0.284, −0.284, −0.282 and −0.294, respectively) and positively correlated with RV/TLC (r=0.322, 0.311, 0.311, 0.310 and 0.321, respectively). Several low-abundant bacteria, such as otu28 (Porphyromonas_endodontalis), were also correlated with FEV1%pred (r=0.399) and RV/TLC (r=−0.385).
Table 2 Association between bacterial taxa and lung function
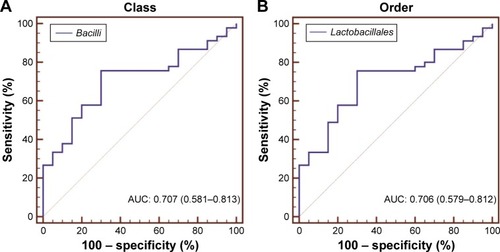
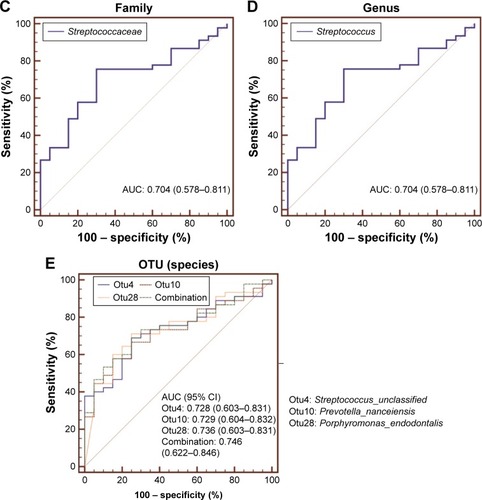
Assessment of bacterial taxa as a potential COPD biomarker
To evaluate the biomarker potential of different taxa for COPD, ROC curve analyses were conducted. The area under curve (AUC) for specific bacteria was calculated based on their relative abundance. ROC curves with an AUC of greater than 0.7 are illustrated in . No phylum-level taxa were identified. Panels (A–D) separately showed that Bacilli, Lactobacillales, Streptococcaceae and Streptococcus uniquely have the slight potential to distinguish COPD from controls (AUC =0.707, 0.706, 0.704 and 0.704, respectively) in their corresponding taxonomic level. And the four taxa separately represented different father levels of otu4. showed that otu4 (Streptococcaceae_unclassified), otu10 (Prevotella_ nanceiensis) and otu28 (Porphyromonas_endodontalis) could weakly identify COPD (AUC =0.728, 0.729 and 0.736, respectively). Combination was calculated by the relative abundance of otu4, otu10 and otu28 using logistic regression (Enter Method). However, the combination (AUC =0.746) did not show stronger distinct ability than otu4, otu10 and otu28 alone. More details are shown in Table S2.
Figure 6 Biomarker potential for COPD at different taxonomic levels.
Abbreviations: AUC, area under curve; OTU, operational taxonomic unit; ROC, receiver operating characteristic.
Discussion
The present study aimed to investigate differences in bacterial communities between smokers with or without COPD. We found that the microbiome of COPD patients differed from that of smokers without COPD, but no differences were observed between COPD patients with different degrees of lung function or disease severity. The OTU richness decreased and the taxonomic distribution shifted with COPD. Notably, two dominant bacteria, otu3 (Veillonella_dispar), otu4 (Streptococcaceae_ unclassified), and their father-level taxa showed a correlation with lung function or biomarker potential for COPD, the alteration of which may be related to COPD pathogenesis.
Results from NMDS and AMOVA suggested that the flora of the COPD groups was different from that of the controls, but there was no difference between COPD patients with different severities of lung function or disease severity, which was consistent with the results of Pragman et al from BALF and Garcia et al from sputum.Citation8,Citation17 Our results indicated that the OTUs, Shannon and inverse Simpson indexes showed a decreased trend in COPD, which were also similar to those of the lower airway.Citation8,Citation18 These find ings based on overall bacterial diversity suggested that the microbiome of the throat may partly reflect alteration of the lower airway.
In the present study, the dominant phyla of the throat were Bacteroidetes, Proteobacteria, Firmicutes and Fusobacteria, which was consistent with the results from BALF and sputum samples.Citation9,Citation19 The dominant genera of the throat were Haemophilus, Leptotrichia, Porphyromonas, Fusobacterium, Veillonella, Streptococcus, Neisseria and Prevotella, which were basically identical to the “bacterial core” of the lower airway.Citation9,Citation19 These findings demonstrated that the “core microbiome” was very similar between the upper and the lower airway, which supported Charlson et al’s hypothesis that bacterial communities of lower respiratory tracts may originate from the oropharynx because of microaspiration.Citation20
Taxonomic distribution plots showed that the dominant bacterial types between smokers with or without COPD were the same, but Fisher’s exact test indicated that their proportions statistically shifted. Therefore, we attempted to identify specific taxa that altered community distribution. Two highly abundant genera, Streptococcus and Veillonella, and their corresponding classes (Bacilli, Negativicutes), orders (Lactobacillales, Selenomonadales) and families (Streptococcaceae, Veillonellaceae) showed a difference between COPD and controls. The analyses based on OTUs (species level) identified seven significant OTUs in the top 25 most abundant ones. Notably, the highly abundant otu3 (dispar) and otu4 (unclassified) were also classified to the previously identified genera Veillonella and Streptococcus, respectively. Currently, Veillonella and Streptococcus, which both belong to the phylum Firmicutes, are commonly considered part of the “core pulmonary microbiome.”Citation7,Citation9,Citation21 Interestingly, many studies of the lower airway and lung tissue have found that the altered abundance of bacteria from the phylum Firmicutes was related to COPD.Citation17,Citation22–Citation24 Thus, we hypothesized that otu3 and otu4 in the throat may reflect the microbiome of the lower airway and may even be related to the pathogenesis of COPD.
The FEV1%pred and RV/TLC can reflect airway obstruction and emphysema, respectively, which are the most important characteristics of COPD. Thus, correlations of bacterial taxa with FEV1%pred and RV/TLC were calculated. Otu3 (Veillonella_dispar) and the corresponding father-level taxa, whose abundance increased in COPD, showed a negative correlation with FEV1%pred and a positive correlation with RV/TLC. By contrast, otu4 (Veillonella_unclassified) and the corresponding father-level taxa, whose abundance decreased in COPD, were positively correlated with FEV1%pred and negatively correlated with RV/TLC. These results indicated that the alteration of “core bacteria” in throat may be involved in the physiological mechanism of COPD. However, this hypothesis requires further experimental evidence.
The potential of various strains to act as a biomarker of COPD was assessed by ROC curve. We found that otu4 (Veillonella_unclassified), including its father-level taxa, otu10 (Prevotella_nanceiensis) and otu28 (Porphyromonas_endodontalis) were slightly able to distinguish COPD from controls, suggesting that throat bacteria may assist in the identification of COPD. However, the ability of these bacteria to identify COPD was weak; thus, other more prominent bacteria need to be identified in further studies.
Other bacterial taxa, such as Streptobacillus (genus level) and otu28 (Porphyromonas_endodontalis), also showed a significant difference, correlation or biomarker potential in COPD compared with that of the controls. However, these results need to be confirmed in a larger population because of their low abundance.
Potential factors influencing throat microbiome were acquired and analyzed. No special diet habits, known periodontal disease and recent systematic antibiotics were reported. Antiseptic mouthwash, bronchodilators and ICS were not also used in 12 h before sample collection. Only long-standing ICS was significantly different between COPD patients with differing severity. However, NMDS and AMOVA implied that throat flora were very similar between group 1 and group 2 or different GOLD stages. Therefore, the impact is expected to be negligible.
Our study has the following strengths. First, compared with previous pilot studies of oropharynx microbiome,Citation11,Citation20 the present study included more COPD patients. Second, only smokers were included in this study, excluding the effect of smoking on oral flora.Citation22
There were several limitations in the present study. First, no female subjects were enrolled because COPD patients in China are almost exclusively males; second, follow-up of the population has not been conducted; third, samples from the lower respiratory tracts were not collected; Fourth, the rarefaction curves still showed an increasing trend, suggesting that sequencing depth was still not enough. Thus, it is necessary that a newer sequencing technique such as Miseq is used in future; Fifth, the present cross-sectional trial was still a small sample-size study, restricting the further analyses. In future, it is necessary to determine the relationship between the throat microbiome and the progression of COPD in a larger cohort with a long-term follow-up.
Conclusion
In summary, the present study found that the throat micro-biome differed among smokers with or without COPD, and the results are similar to those from lower respiratory tracts. These data can help us to better understand the relationship between the microbiome of different airway sites and pathogenesis of COPD.
Author contributions
All authors declared their personal contribution to this manuscript: BH conducted study design and crucially revised the article; WD conducted bioinformatic analyses and biological interpretation, and wrote the manuscript; NS was involved in statistical analyses and enrolled subjects; YD collected throat samples and performed lung function test for subjects; KQ gathered the clinical information of subjects. All authors contributed toward data analysis, drafting and critically revising the paper, approved the final version of the manuscript and agreed to be accountable for all aspects of the work.
Acknowledgments
The present study was funded by the National Natural Science Foundation of China (Grant Nos: 81270097; 81470235) and BMU (Grant No: 20110176). The funders had no role in study design, data collection and analysis, decision to publish, or preparation of the manuscript.
Supplementary materials
Figure S1 Community difference (Bray–Curtis distance) between controls and COPD.
Notes: NMDS with AMOVA was conducted based on Bray–Curtis distance matrix. (A) Indicated that bacterial communities between controls and COPD were different (P=0.042, AMOVA); (B) suggested that no difference was observed between group 1 and group 2 (P=0.961, AMOVA); and (C) implied that there is no difference between GOLD A–D group. The COPD patients included two subgroups: group 1 (FEV1%pred ≥50%) and group 2 (FEV1%pred <50%).
Abbreviations: AMOVA, analysis of molecular variance; GOLD, Global Initiative on Obstructive Lung Disease; FEV1, forced expiratory volume in 1 s; NMDS, nonmetric multidimensional scaling.
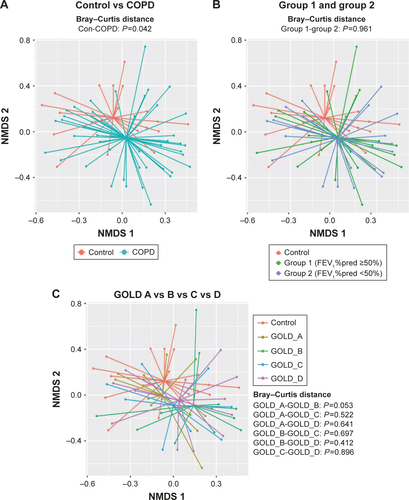
Figure S2 Rarefaction curve analyses for COPD with different degrees of lung function or disease severity.
Notes: (A) The COPD patients included two subgroups: group 1 (FEV1%pred ≥50%); group 2 (FEV1%pred <50%). No shift was observed between group 1 and group 2, and (B) no difference was identified between different GOLD classification.
Abbreviation: GOLD, Global Initiative on Obstructive Lung Disease.
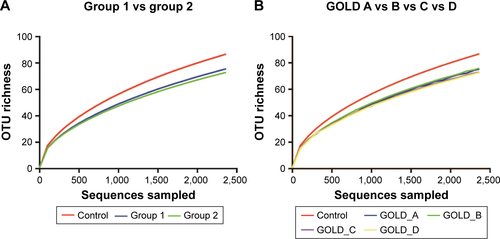
Figure S3 Comparison of Shannon and inverse Simpson index among different groups.
Notes: Inverse Simpson (A) and Shannon (B) index showed a decreasing trend in COPD patients than controls but no observed difference between group 1 and group 2. COPD patients included two subgroups: group 1 (FEV1%pred ≥50%) and group 2 (FEV1%pred <50%).
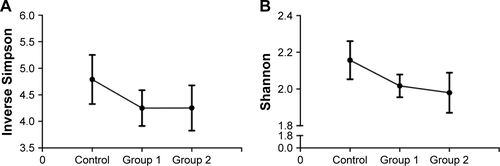
Table S1 Significant taxa between COPD and controls at different taxonomic levels
Table S2 Area under curve, sensitivity, and specificity of different taxonomy
Disclosure
The authors report no conflicts of interest in this work.
References
- BarnesPJCelliBRSystemic manifestations and comorbidities of COPDEur Respir J20093351165118519407051
- PatelISVlahosIWilkinsonTMBronchiectasis, exacerbation indices, and inflammation in chronic obstructive pulmonary diseaseAm J Respir Crit Care Med2004170440040715130905
- PapiABellettatoCMBraccioniFInfections and airway inflammation in chronic obstructive pulmonary disease severe exacerbationsAm J Respir Crit Care Med2006173101114112116484677
- RosellAMonsoESolerNMicrobiologic determinants of exacerbation in chronic obstructive pulmonary diseaseArchiv Intern Med20051658891897
- LeeSWKuanCSWuLSWengJTMetagenome and metatranscriptome profiling of moderate and severe COPD sputum in Taiwanese Han malesPLoS One2016117e015906627428540
- HuangYJErb-DownwardJRDicksonRPCurtisJLHuffnagleGBHanMKUnderstanding the role of the microbiome in chronic obstructive pulmonary disease: principles, challenges, and future directionsTransl Res2017179718327392936
- WangZBafadhelMHaldarKLung microbiome dynamics in COPD exacerbationsEur Respir J20164741082109226917613
- Garcia-NunezMMillaresLPomaresXSeverity-related changes of bronchial microbiome in chronic obstructive pulmonary diseaseJ Clin Microbiol201452124217422325253795
- Erb-DownwardJRThompsonDLHanMKAnalysis of the lung microbiome in the “healthy” smoker and in COPDPLoS One201162e1638421364979
- OgorodovaLMFedosenkoSVPopenkoASComparison study of oropharyngeal microbiota in case of bronchial asthma and chronic obstructive pulmonary disease in different severity levelsVestn Ross Akad Med Nauk20156669678 Russian27093794
- ParkHShinJWParkSGKimWMicrobial communities in the upper respiratory tract of patients with asthma and chronic obstructive pulmonary diseasePLoS One2014910e10971025329665
- VestboJHurdSSAgustiAGGlobal strategy for the diagnosis, management, and prevention of chronic obstructive pulmonary disease: GOLD executive summaryAm J Respir Crit Care Med2013187434736522878278
- MasonKLErb DownwardJRMasonKDCandida albicans and bacterial microbiota interactions in the cecum during recolonization following broad-spectrum antibiotic therapyInfect Immun201280103371338022778094
- Jumpstart Consortium Human Microbiome Project Data Generation Working GroupEvaluation of 16S rDNA-based community profiling for human microbiome researchPLoS One201276e3931522720093
- HovJRZhongHQinBThe influence of the autoimmunity-associated ancestral HLA haplotype AH8.1 on the human gut microbiota: a cross-sectional studyPLoS One2015107e013380426207384
- SchlossPDWestcottSLRyabinTIntroducing mothur: open-source, platform-independent, community-supported software for describing and comparing microbial communitiesAppl Environ Microbiol200975237537754119801464
- PragmanAAKimHBReillyCSWendtCIsaacsonREThe lung microbiome in moderate and severe chronic obstructive pulmonary diseasePLoS One2012710e4730523071781
- EinarssonGGComerDMMcIlreaveyLCommunity dynamics and the lower airway microbiota in stable chronic obstructive pulmonary disease, smokers and healthy non-smokersThorax201671979580327146202
- GalianaAAguirreERodriguezJCSputum microbiota in moderate versus severe patients with COPDEur Respir J20144361787179024311775
- CharlsonESBittingerKHaasARTopographical continuity of bacterial populations in the healthy human respiratory tractAm J Respir Crit Care Med2011184895796321680950
- ZakharkinaTHeinzelEKoczullaRAAnalysis of the airway microbiota of healthy individuals and patients with chronic obstructive pulmonary disease by T-RFLP and clone sequencingPLoS One201387e6830223874580
- HiltyMBurkeCPedroHDisordered microbial communities in asthmatic airwaysPLoS One201051e857820052417
- HuangYJKimECoxMJA persistent and diverse airway microbiota present during chronic obstructive pulmonary disease exacerbationsOmics201014195920141328
- SzeMADimitriuPAHayashiSThe lung tissue microbiome in chronic obstructive pulmonary diseaseAm J Respir Crit Care Med2012185101073108022427533