
Abstract
Background and objective
We have explored whether assessing the degree of concavity in the descending limb of the maximum expiratory flow–volume curve enhanced spirometric detection of early small airway disease.
Methods
We used spirometry records from 890 individuals aged ≥40 years (mean 59 years), recruited for the Burden of Obstructive Lung Disease Australia study. Central and peripheral concavity indices were developed from forced expired flows at 50% and 75% of the forced vital capacity, respectively, using an ideal line joining peak flow to zero flow.
Results
From the 268 subjects classified as normal never smokers, mean values for post-bronchodilator central concavity were 18.6% in males and 9.1% in females and those for peripheral concavity were 50.5% in males and 52.4% in females. There were moderately strong correlations between concavity and forced expired ratio (forced expiratory volume in 1 second/forced vital capacity) and mid-flow rate (forced expiratory flow between 25% and 75% of the FVC [FEF25%–75%]; r=−0.70 to −0.79). The additional number of individuals detected as abnormal using the concavity indices was substantial, especially compared with FEF25%–75%, where it was approximately doubled. Concavity was more specific for symptoms.
Conclusion
The inclusion of these concavity measures in the routine reports of spirometry would add information on small airway obstruction at no extra cost, time, or effort.
Plain language summary
This study investigated whether assessing the concave pattern of the flow–volume curve was more reliable than conventional spirometric indices for detecting early small airway obstruction. We compared conventional spirometric indices with the degree of concavity in 890 individuals, aged ≥40 years, recruited for the Burden of Obstructive Lung Disease Australia study. We found that the prevalence of abnormal spirometry was far higher for concavity than for conventional indices. We also found that concavity was more specific for breathlessness on moderate exercise. We conclude that there is more information in spirometry than is being currently used, which might be valuable in detecting early airway disease.
Introduction
COPD is characterized by airflow obstruction which is slowly progressive and not fully reversible.Citation1 The core pathophysiology is in the small airways with obstruction caused by wall fibrosis and progressive obliteration of the lumen.Citation2 Emphysema may later occur and will then contribute to airflow obstruction.Citation2–Citation4 Clinical guidelines advocate the measurement of spirometry in people suspected of having the disease and emphasize spirometry’s importance in the early detection to arrest disease progression,Citation1,Citation5 using the ratio of the forced expiratory volume in 1 second to the forced vital capacity (FEV1/FVC). However, these spirometric measures may not be best for detecting small airway changes. There is a need for better measures of airflow obstruction, and it has long been recognized that there is more information in the expiratory flow–volume curve than is currently utilized in routine practice. The current advances in spirometers make it entirely feasible to easily access this information, and we have explored one approach to this goal.
The functional information provided by the FEV1 is necessarily limited to detecting abnormal flows during the first second of the expiratory maneuver when the lung is relatively inflated and the thin-walled elastic small airways are exposed to significant distending forces. Consequently, during the first second, the contribution from the small airways to total airway resistance is limited unless advanced generalized small airway narrowing is present and would not particularly be sensitive to abnormalities caused by early small airway lesions.Citation2,Citation6,Citation7 In contrast, the maximal expiratory flow–volume (MEFV) curve represents a complete description of maximum flows and includes the region beyond 1 second where the lung is less inflated and the airway distending forces are lower, resulting in progressive narrowing as lung volume falls.
Furthermore, it has long been recognized that the first indication of abnormal ventilatory function is the development of concavity in the tail of the curve, and this is explicitly acknowledged in the American Thoracic Society/European Respiratory Society statement on the interpretation of lung function.Citation8 Indeed, this is supported by the equal pressure point conceptCitation9 and modeling based on the wave speed theory of airflow limitation,Citation10 which found that the segment of airways limiting expiratory flow moved progressively into smaller airways as lung volume decreased. This suggests that reduced flows, isolated in the tail of the MEFV curve, were more specific to earliest small airway dysfunction. Based on these insights, newer methods have been developedCitation11,Citation12 but are complex and have not yet been translated widely into clinical or research practice.
It is generally agreed that the major underlying mechanism causing concavity is volume-dependent nonuniform airway emptying.Citation13,Citation14 This occurs when lung compartments have widely differing expiratory time constants, as would be expected in obstructive lung disease with small airway dysfunction, with the fastest and slowest emptying compartments contributing disproportionally to expiratory flows as the lung empties. In the early stages of COPD disease, distribution is patchyCitation14 causing an increase in nonuniform airway emptying and the development of a concave-shaped MEFV curve. Hence, we suggest that the first indication of early airflow obstruction is the appearance of concavity, which is in agreement with other measures.Citation8,Citation13,Citation14–Citation17
A number of studies have investigated this concave pattern of the MEFV curve and concluded that the presence of a concavity was closely associated with airflow obstruction,Citation13,Citation18,Citation19 even when the FEV1 was normal,Citation20,Citation21 and correlated with spirometric indices of small airway obstruction.Citation22 Concavity correlated better with symptom scores in childhood asthma than FEV1 and FEV1/FVC,Citation18 was able to differentiate between healthy adults and mild COPD,Citation23 and was sensitive to bronchiolitis and its severity following lung transplantation.Citation24 These and other studies have used a number of methods to assess curvature of the MEFV curve: 1) the slope ratio introduced by Mead,Citation13 which is based on instantaneous tangents slopes measured at multiple points along the descending curve; 2) angle β, which is the angle subtended between two lines drawn from mid vital capacity to residual volume (RV) and peak expiratory flow (PEF) at total lung capacity;Citation25 3) the average curvature index, which is a multistep method requiring data smoothing and fitting a quadratic function to the curve;Citation18 and 4) Kmax, a complex global curvature index obtained by fitting a hyperbolic function.Citation19 Other less-specific methods have included the area under the MEFV curveCitation26 and analysis of expiratory flow patterns against time.Citation27 However, these methods have been complex and difficult to apply routinely, have not been evaluated in a community sample of adults, and none of them have been incorporated into routine spirometry software or clinical guidelines.
We recently reported a preliminary analysis of two new but simple indices of concavity (central and peripheral) and showed that the prevalence of abnormal concavity in the general population was, as perhaps expected, higher than that estimated using the FEV1/FVC ratio.Citation28 In the current study, we report more detailed analysis of concavity in a random sample of people aged ≥40 years from the Burden of Obstructive Lung Disease (BOLD) Australia study.Citation29 We have assessed the reliability of a new measure of concavity and its validity as an indicator of mild airway obstruction in this population.
Methods
This is an analysis of data collected in a randomly selected sample of subjects aged ≥40 years living in Victoria and Tasmania who participated in the Australian part of the BOLD initiative.Citation29 Subjects underwent pre-bronchodilator (pre-BD) and post-bronchodilator (post-BD) spirometry with flow–volume curves. With the assistance of an interviewer, they completed the standardized BOLD questionnaire.Citation30 We assessed MEFV curves to quantify the degree of central and peripheral concavities (detailed below), produced upper limits of normal, and described the prevalence of an abnormal degree of concavity in our sample compared with standard spirometric measurements.
Ethics approval
The study was approved by the Human Research Ethics Committee of the University of Sydney (ref no 12-2006/9724). Additionally, the Tasmania and Melbourne sites obtained local ethics approval from Tasmania Health and Medical Human Research Ethics Committee (Ref: H0009637) and The Alfred Hospital Ethics Committee (Ref: 118/08), respectively. All participants gave written informed consent for this study.
Spirometry
Spirometry was performed according to the European Respiratory Society standardCitation31 using the ultrasonic EasyOne spirometer (ndd Medizintechnik, Zürich, Switzerland). This spirometer was chosen because it is accurate, retains accuracy during extended use,Citation32 and provides automatic grading of test quality with feedback to the tester. Spirometry was measured before and after 15 minutes of the administration of 200 μg salbutamol. At least three pre-BD and three post-BD trials were performed. Only curves that met acceptability criteria and were repeatable to within ±0.2 L for both FEV1 and FVC were included. The highest values for FEV1 and FVC from acceptable curves were used.Citation31
Central and peripheral concavities
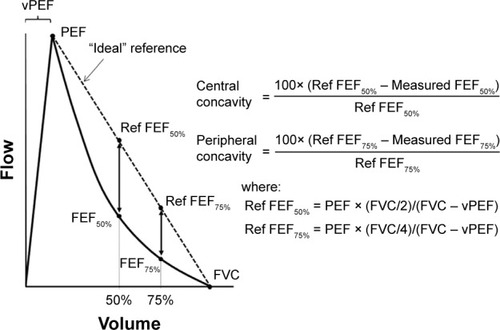
The method used to quantify the degree of concavity has been described previously.Citation28 In brief, our central and peripheral indices of concavity were based on the forced expiratory flow measured at the point where 50% (FEF50%) and 75% (FEF75%) of the FVC had been expired, respectively (). The degree of concavity was expressed as the percentage decrease of these measured flows from the corresponding “ideal” reference flows calculated by assuming that the descending limb had no curvature (ie, was a straight line, see ), a general finding in normal adult spirometry.Citation33 The FEF50% and FEF75% were taken from the single acceptable trial with the highest FEV1. The value of volume expired to peak expiratory flow (vPEF; ) was measured manually from the MEFV curve, but assuming a fixed value equal to the mean values obtained in this study (0.65 L in males and 0.51 L in females) introduced a small error.
Figure 1 Variables used to quantify central and peripheral concavities (see text).
Abbreviations: FEF25%–75%, forced expiratory flow between 25% and 75% of the FVC; FVC, forced vital capacity; PEF, peak expiratory flow; vPEF, volume expired to peak expiratory flow.
The post-BD upper limit of normal (ULN) for central and peripheral concavities were derived separately for males and females who met the following criteria: lifelong non-smokers; <12% change in either FEV1 or FVC post bronchodilator; no diagnosis of asthma, emphysema, COPD, or chronic bronchitis by physician; and not limited in performing moderate exercise.
In the BOLD questionnaire, the assessment of current health-limiting exercise capacity was according to whether capacity to perform “moderate” daily activities (eg, pushing a vacuum cleaner, moving a table) was “not limited at all”, “limited a little”, or “limited a lot”. Since there were few responses in this latter group, we have combined the last two groups to provide separate male and female data. Spirometry and concavity were compared by quantifying their sensitivity and specificity for detecting exercise limitation.
Statistical analysis
Data were expressed as a percentage or mean ± SD for continuous variables. Two-tailed t-test, assuming unequal variances, was used to assess differences between means. A probability of ≤5% was taken as significant. Spirometric reference equations from Hankinson et alCitation34 were used to obtain % predicted. Spearman’s rank correlation was used to determine the relationship between indices of concavity and spirometric values. The ULNs for central and peripheral concavities were determined separately for normal male and female subjects as the 95th percentile. Correlations were used to assess repeatability. Reliability was assessed as the intraclass (within-subject) correlation. We used exercise limitation due to dyspnea as an independent indicator of the presence of (cardio)respiratory disease and assessed the validity of the new measures of concavity (central and peripheral concavities > ULN) and the established measures (FEV1/FVC, FEV1, and forced expiratory flow between 25% and 75% of the FVC [FEF25%–75%], lower limit of normal [LLN]) by quantifying their sensitivity and specificity for this functional limitation.
Results
Demographics and descriptive spirometry
Descriptive data for males (n=424) and females (n=466) are summarized in . By design of the BOLD study, the sample was middle-aged and older (range, 40–87) with a mean age of 59 years. Overall, males had significantly more central (P<0.001) and higher FEF25%–75% (expressed as percent predicted, P=0.001) than females, but peripheral concavity and FEV1/FVC ratio were similar.
Table 1 Descriptive data for the sample
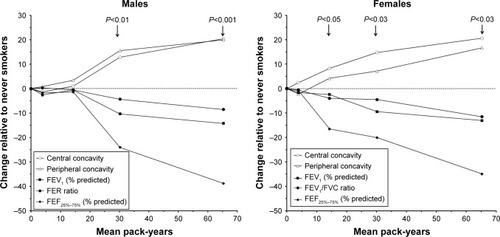
A higher proportion of males than females had ever smoked and had a higher lifetime tobacco consumption (median pack-years: males, 17.8; females, 10.3, P<0.001). Participants who had ever smoked had significantly lower values for FEV1/FVC, FEV1, and FEF25%–75%, and a greater degree of central concavity and in males, peripheral concavity also, when compared with those who had never smoked. However, in females, peripheral concavity was similar between ever and never smokers. Smoking history had little effect on spirometry or degree of concavity up to approximately a 10 pack-year history in females and a 20 pack-year history in males, but above these levels, there was a significant decrease in FEV1, FEV1/FVC, and FEF25%–75%, and a greater degree of central and peripheral concavities ().
Figure 2 Relationship between lifetime tobacco consumption and post-BD spirometry and concavity, expressed as the difference relative to never smokers (nil pack-years).
Abbreviations: FEF25%–75%, forced expiratory flow between 25% and 75% of the FVC; FEV1, forced expiratory volume in 1 second; FVC, forced vital capacity; post-BD, post-bronchodilator.
Following the administration of salbutamol, there was a significant increase in FEV1, FEV1/FVC, and FEF25%–75%, but not in FVC, and a reduction in the degree of central and peripheral concavities.
In both genders, there were strong negative correlations between the new measures of concavity and FEV1, FEV1/FVC, and FEF25%–75%, but not with FVC ().
Table 2 Spearman rank correlations for associations between post-BD concavity and spirometric variables
Upper limits of normal for concavity indices
A total of 268 subjects (131 males and 137 females) were classified as normal never smokers (as defined above) and their descriptive data are summarized in . In these subjects, the mean value for post-BD central (males, 18.6%; females, 9.1%) and peripheral (males, 50.5%; females; 52.4%) concavities deviated significantly from the “ideal” reference value (dotted line in ) of zero, which probably reflected an “aging effect” on small airway function in our middle-aged and older normal sample. However, and perhaps as expected, the ULN for post-BD measurements of central (males 56.4%; females 45.8%) and peripheral (males 77.5%; females 78.1%) concavities were quite large.
Table 3 Descriptive data for subjects classified as normalTable Footnotea
Reliability and sensitivity of the concavity indices
Intraclass (within-subject) correlations for central and peripheral concavities were ~0.96, which was similar to FEF25%–75% and only slightly lower than for FEV1, FVC, and FEV1/FVC (0.99). However, as shown in , the prevalence of an abnormally high degree of central or peripheral concavity was substantially greater than the prevalence of an abnormally low FEV1, FVC, FEV1/FVC, or FEF25%–75%. This was especially the case in males and against the Hankinson et alCitation34 normative values, which were used throughout the BOLD program and elsewhere (which specifically take into account the aging effect in a way that GOLDCitation1 does not for FEV1/FVC values). Thus, these concavity indices substantially increase the pick-up of early airflow obstruction, even when allowing for the quite wide variation of normal in this aging sample. These additional small airway-obstructed subjects are located in the right-upper quadrant of the plots shown in –.
Table 4 Prevalence of abnormal post-BD concavities (central and peripheral) and abnormal spirometric variables
Figure 3 Post-BD relationships between central concavity and FEV1/FVC in males (n=424) and females (n=466).
Notes: The horizontal dotted line is the ULN for central concavity. The vertical dotted line in the two upper plots is the LLN for FEV1/FVC from Hankinson et alCitation34 and for the lower two plots, it is the fixed LLN of 70% from GOLD.Citation1 A negative value for FEV1/FVC indicates values below the LLN.
Abbreviations: FEV1, forced expiratory volume in 1 second; FVC, forced vital capacity; GOLD, global initiative for chronic obstructive lung disease; LLN, lower limit of normal; Post-BD, post-bronchodilator; ULN, upper limit of normal.
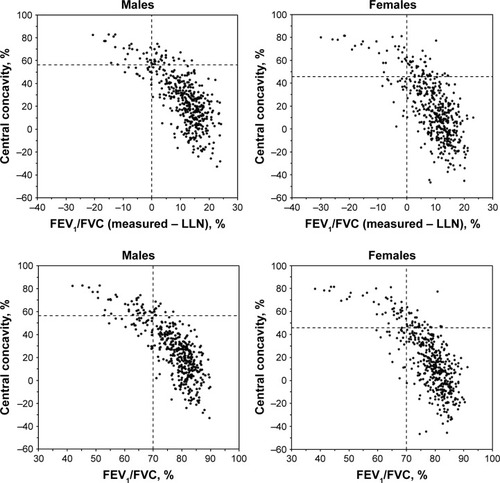
Figure 4 Post-BD relationships between peripheral concavity and FEV1/FVC in males (n=424) and females (n=466).
Notes: The horizontal dotted line is the ULN for peripheral concavity. The vertical dotted line in the two upper plots is the LLN for FEV1/FVC from Hankinson et alCitation34 and for the lower two plots, it is the fixed LLN of 70% from GOLD.Citation1 A negative value for FEV1/FVC indicates values below the LLN.
Abbreviations: FEV1, forced expiratory volume in 1 second; FVC, forced vital capacity; GOLD, global initiative for chronic obstructive lung disease; LLN, lower limit of normal; Post-BD, post-bronchodilator; ULN, upper limit of normal.
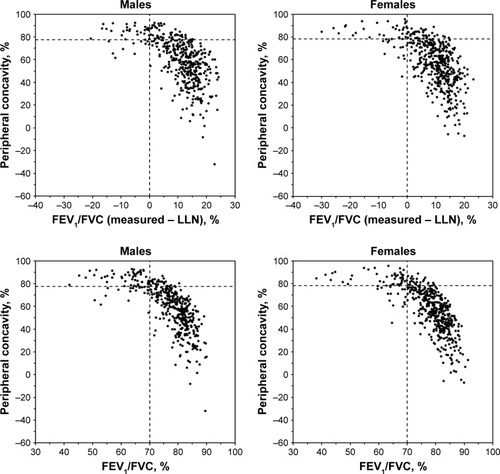
Figure 5 Post-BD relationships between central and peripheral concavities and FEF25%–75% in males (n=424) and females (n=466).
Abbreviations: FEF25%–75%, forced expiratory flow between 25% and 75% of the FVC; LLN, lower limit of normal; Post-BD, post-bronchodilator; ULN, upper limit of normal.
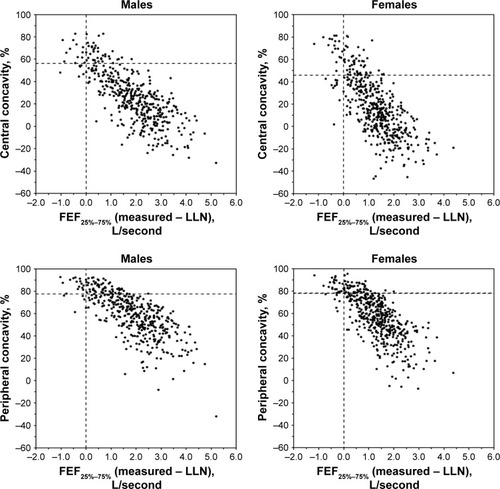
Detailed inspection of these extra abnormal curves in the right upper quadrants suggests that for the most part there was just visually obvious scalloping of the MEFV curves, such that conventional indices of airway obstruction remained relatively unaffected.
Relationship to symptoms
We found that 16.6% of both men and women reported exercise limitation due to breathlessness when other spirometric indices were normal. Approximately 21% of these individuals had abnormal concavity (). On the other hand, the specificity of abnormal concavity indices was high. Over 90% of people without exercise limitation due to breathlessness had normal concavity indices.
Table 5 Sensitivity and specificity analyses of concavity for breathlessness on moderate activity (which occurred in 20% of the total population) in males and females whose FEV1/FVC or FEF25%–75% or FEV1/FVC ratio + FEF25%–75% were normal
Discussion
We have described a simple and reliable method for quantifying the characteristic scalloping affecting the central and peripheral regions of the MEFV curve in chronic airflow obstruction, to determine if this would better detect early small airway obstruction. We have developed ULN reference values and showed that an abnormal degree of concavity was a common finding in our middle-aged and older community sample, especially in males and in those with a significant smoking history.
These concavity indices are statistically related to more conventional spirometric values, so broadly as we might expect, they reflect the same thing, that is, airflow obstruction. On the other hand, we quite commonly detected an abnormal MEFV curve when the FEV1/FVC ratio and FEF25%–75% were within normal limits (–). This, together with our finding of imperfect correlations between our indices of concavity and FEV1, FEV1/FVC, and FEF25%–75%, suggests that assessing concavity could provide additional physiological information not available using these spirometric variables. In this, we have developed on themes already publishedCitation18,Citation20–Citation23 but, in addition, the high specificity of abnormal concavity for breathlessness on exercise in people with normal FEV1/FVC and FEF25%–75% () suggests that concavity is clinically useful for excluding early airway disease as a cause of breathlessness.
It was also informative to visualize the MEFV curves where concavity was not significantly abnormal, but one or more other spirometric indices suggested COPD. Detailed examination suggested for the most part abnormalities in the central airways and did not necessarily reflect the small airway-predominant disease, which is characteristic of smokers.
Perhaps, our most important finding was a higher prevalence of abnormal concavity compared with abnormal FEV1, FEV1/FVC, and especially FEF25%–75%, in our middle-aged and older population, especially when using Hankinson’s normative spirometry values.Citation34 It was less advantageous against GOLD “fixed” FEV1/FVC ratio of <70%, which does not take into account the aging effect on airway narrowing,Citation1 though our regression analyses for concavity measures did not show significant aging effects. It will be of interest whether an early singular increase in concavity alone is a signal for likely progression of airway obstruction to “conventional” COPD with FEV1/FVC reduction.
A particular strength of the concavity indices is that they seemed more sensitive to small airway narrowing than FEF25%–75%, which is currently used for this purpose. There were also few potentially “false negatives” (in the lower left panels in –). The presence of other comorbid causes of dyspnea, such as heart disease, may explain the low sensitivity of this measure, which only detects airflow obstruction, but detailed data on comorbidities were not collected. Our concavity measures are also easy to understand because they closely match the way most reporters already, but imprecisely, visually assess curvature. They intuitively tend to take into account inspection of the ideal reference line from PEF to end FVC and also take into account vPEF in the assessment of MEFV curves. Furthermore, by assuming a fixed value for vPEF equal to the mean obtained in this study (males, 0.65 L; females, 0.51 L), our curvature indices could be directly and easily obtained for current tests and any spirometric datasets that included FVC, FEF50%, FEF75%, and PEF.
Of those whose central concavity was normal, 10.9% of males (but only 3.2% of females) had an abnormal degree of peripheral concavity. This indicated that concavity confined to the terminal region of the MEFV curve was uncommon but may reflect the very earliest small airways disease. The contrasting sole central concave pattern was less common in males (12.9%) than in females (29.2%), perhaps again a reflection of the higher male tobacco consumption. We have previously observed this latter pattern in young adults, and also in lungs that are small relative to chest size post lung transplantation, presumably reflecting excessive recruitment of lung elastic recoil with radial traction as the lung deflates.
The present study has several limitations. Our community sample included relatively few people with established COPD according to established criteria based on FEV1/FVC, as one might expect, but has still highlighted that some of these individuals did not really have classic COPD with generalized airway disease focused physiologically in the small airways, but more likely had an obstructive abnormality focused in the larger airways only. A clinical population more enriched for reduced FEV1/FVC should be studied to get more numeric information on this group in terms of assessing sensitivity and specificity for different measures. Our concavity ULN values were based on a relatively small number of normal subjects (131 males and 137 females), and so they may need to be refined when more data are available. Another potential limitation of this study is the straight line from PEF to RV, assuming this to be the ideal reference line. Such a near-linear descending limb is indeed the most common finding in people with normal spirometry,Citation33 and we believe that our assumption is justified in providing a zero reference for concavity. Further research is also needed to compare this new and easily available spirometric index with more complex measures, such as the forced oscillationCitation12 and multiple-breath nitrogen washout tests,Citation11 which attempt to obtain much the same thing, that is, early signals of airway disease.
Conclusion
We propose that for the assessment of early “small airway” airflow obstruction, this newly updated measurement of concavity in the MEFV curve should be incorporated into routine spirometry reports and indeed should become the standard for defining small airway disease and subclinical COPD. Waiting for the FEV1/FVC ratio to change may be too insensitive and can underestimate the amount of disease present both in the individual and in the community.
Author contributions
All authors contributed toward data analysis, drafting and revising the paper and agree to be accountable for all aspects of the work.
Acknowledgments
We wish to acknowledge the participants and all the previous research staff at each of the study sites for recruiting and testing participants: Australian Operations Centre: Tessa Bird and Wei Xuan, Woolcock Institute of Medical Research, Glebe, NSW; Melbourne site: Angela Lewis, Joan Raven, Joan Green, and Marsha Ivey, Department of Epidemiology and Preventive Medicine, Monash University, Melbourne, VIC; Tasmanian sites: Carol Phillips, Royal Hobart Hospital, TAS; Loren Taylor, University of Tasmania, Hobart, TAS. We are also very grateful to Paula Fottrell, School of Medicine, University of Tasmania, for measuring vPEF from individual MEFV curves and Sheikh M. Alif, Allergy and Lung Health Unit, Centre for Epidemiology and Biostatistics, School of Population and Global Health, for assisting with the figures.
The research was supported by the Australian Lung Foundation Ludwig Engel Grant-in-Aid for Physiological Research and National Health and Medical Research Council of Australian Centre for Chronic Respiratory Disease. The BOLD Australia study was funded by the National Health and Medical Research Council.
Disclosure
The authors report no conflicts of interest in this work.
References
- Global Initiative for Chronic Obstructive Lung Disease (GOLD)Global strategy for the diagnosis, management and prevention of chronic obstructive pulmonary disease2017 Available from: http://www.goldcopd.org/gold-2017Accessed June 29, 2017
- HoggJCMacklemPTThurlbeckWMSite and nature of airway obstruction in chronic obstructive lung diseaseN Engl J Med196827825135513605650164
- MacklemPTThe physiology of small airwaysAm J Respir Crit Care Med19981575S181S1839606316
- DunnillMSThe classification and quantification of emphysemaProc R Soc Med19696210102410275346164
- YangIADabscheckEGeorgeJThe COPD-X Plan: Australian and New Zealand Guidelines for the Management of Chronic Obstructive Pulmonary Disease 2016 Version 2.48Accessed December 15, 2016
- McDonoughJEYuanRSuzukiMSmall-airway obstruction and emphysema in chronic obstructive pulmonary diseaseN Engl J Med2011365171567157522029978
- VerbanckSSchuermansDMeysmanMPaivaMVinckenWNoninvasive assessment of airway alterations in smokers: the small airways revisitedAm J Respir Crit Care Med2004170441441915130906
- PellegrinoRViegiGBrusascoVInterpretative strategies for lung function testsEur Respir J200526594896816264058
- MeadJTurnerJMMacklemPTLittleJBSignificance of the relationship between lung recoil and maximum expiratory flowJ Appl Physiol1967221951086017658
- DawsonSVElliotEAWave-speed limitation on expiratory flow – a uniforming conceptJ Appl Physiol Respir Environ Exerc Physiol1977433498515914721
- VerbanckSSchuermansDVan MuylemAPaivaMNoppenMVinckenWVentilation distribution during histamine provocationJ Appl Physiol (1985)1997836190719169390962
- FrantzSNihlenUDenckerMEngströmGLöfdahlCGWollmerPImpulse oscillometry may be of value in detecting early manifestations of COPDRespir Med201210681116112322613172
- MeadJAnalysis of the configuration of maximal expiratory flow-volume curvesJ Appl Physiol Respir Environ Exerc Physiol1978442156165632154
- CosioMChezzoHHoggJCThe relationship between structural changes in small airways and pulmonary function testsN Engl J Med197829812771281651978
- PedersenOFIngramRHJrConfiguration of maximum expiratory flow-volume curve: model experiments with physiological implicationsJ Appl Physiol 19851985584130513133988684
- O’DonnellCRCastleRGMeadJChanges in flow-volume curve configuration with bronchoconstriction and bronchodilationJ Appl Physiol (1985)1986616224322513804929
- O’DonnellCRRossRMThe flow-ratio index: an approach for measuring the influence of age and cigarette smoking on maximum expiratory flow-volume curve configurationChest19909836436462394142
- WildhaberJHSznitmanJHarpesPCorrelation of spirometry and symptom scores in childhood asthma and the usefulness of curvature assessment in expiratory flow-volume curvesRespir Care200752121744175218028566
- ZhengCJAdamsABMcGrailMPMariniJJGreavesIAA proposed curvilinear index for quantifying airflow obstructionRespir Care2006511404516381616
- SchachterENKappMCMaunderLRBeckGWitekTJSmoking and cotton dust effects in cotton textile workers: an analysis of the shape of the maximum expiratory flow volume curveEnviron Health Perspect1986661451483709477
- KraanJvan der MarkTWKoeterGHChanges in maximum expiratory flow-volume curve configuration after treatment with inhaled corticosteroidsThorax19894412101510212533411
- OhwadaATakahashiKConcave pattern of a maximal expiratory flow-volume curve: a sign of airflow limitation in adult bronchial asthmaPulm Med2012201279749523227333
- DominelliPBForsterGEGuenetteJAQuantifying the shape of the maximal expiratory flow-volume curve in mild COPDRespir Physiol Neurobiol2015219303526275685
- OmlandOSigsgaardTPedersenOFMillerMRThe shape of the maximum expiratory flow-volume curve reflects exposure in farmingAnn Agric Environ Med200072717811153034
- KappMCSchachterENBeckGJMaunderLRWitekTJJrThe shape of the maximum expiratory flow volume curveChest19889447998063262488
- VermaakJCBunnAEde KockMAA new lung function index: the area under the maximum expiratory flow-volume curveRespiration19793726165441534
- MorrisMJLaneDJTidal expiratory flow patterns in airflow obstructionThorax19813621351427268679
- JohnsDPWaltersJWaltersEHDiagnosis and early detection of COPD using spirometry. Invited reviewJ Thorac Dis20146111557156925478197
- ToelleBGXuanWBirdTERespiratory symptoms and illness in older Australians: the Burden of Obstructive Lung Disease (BOLD) studyMed J Aust2013198314414823418694
- BuistASMcBurnieMAVollmerWMBOLD Collaborative Research GroupInternational variation in the prevalence of COPD (the BOLD Study): a population-based prevalence studyLancet2007370958974175017765523
- MillerMRHankinsonJBrusascoVATS/ERS Task ForceStandardisation of spirometryEur Respir J200526231933816055882
- WaltersJAWood-BakerRWallsJJohnsDPStability of the Easyone ultrasonic spirometer for use in general practiceRespirology200611330631016635089
- DavidsonFFJrBurkeGW3rdPhysiologic differentiation of upper and lower airway obstructionAnn Otol Rhinol Laryngol1977865 Pt 1630632911142
- HankinsonJLOdencrantzJRFedanKBSpirometric reference values from a sample of the general U.S. populationAm J Respir Crit Care Med199915911791879872837