
Abstract
Purpose
To evaluate the associations between acute exacerbations of chronic obstructive pulmonary disease (AECOPD) hospitalizations and daily mean temperature (Tmean) as well as daily apparent temperature (AT), and to explore the practical values of these two indices in policymaking and patient education.
Methods
Daily AECOPD hospitalizations and Meteorological data in Beijing were obtained between 2013 and 2016. Distributed lag non-linear model was adopted to investigate the association between daily ambient temperature and AECOPD hospitalizations. The cumulative effects of cold/hot temperature were abstracted. For the extreme and moderate low-temperature effect estimates, we, respectively, computed the RR of AECOPD hospitalizations at the 1st and 10th percentiles of temperature in comparison with that at the 25th percentile of temperature. For the extreme and moderate high temperature effect estimates, we, respectively, computed the RR of AECOPD hospitalizations at the 99th and 90th percentiles of temperature in comparison with that at the 75th percentile of temperature.
Results
During the study period, 143, 318 AECOPD hospitalizations were collected. A reverse J-shape relationship was found between temperature and AECOPD hospitalizations. When comparing the effect of Tmean, higher RRs were associated with increases in AT on AECOPD hospitalizations but a lower value of Akaike’s Information Criterion for quasi-Poisson (Q-AIC). The RR of extremely low temperature of Tmean and AT were 1.55 (95% CI: 1.21,2.00) and 2.08 (95% CI: 1.44,3.01), respectively. Moderate low temperature also had an adverse impact on AECOPD hospitalizations. No associations were found between high temperature and AECOPD risk. We found the females and those aged <65 years to be more susceptible to temperature change.
Conclusion
Lower temperature is associated with a higher risk for AECOPD hospitalizations. Ambient temperature is probably a better predictor in terms of quantifying risk than mean temperature when studying temperature impact on health.
Introduction
Chronic obstructive pulmonary disease (COPD) is a major public health concern, with high prevalence and associated disability and mortality worldwide.Citation1 According to a nation-wide study, there are 99.9 million people living with COPD in China in 2018, and over 0.9 million people died prematurely because of COPD each year.Citation2 Acute exacerbations of COPD (AECOPD) are defined as any sustained worsening of respiratory symptoms in COPD patients.Citation3 Hospitalizations for exacerbations, which only account for $ 18 billion in direct costs annually in the United States, and are associated with 1-year mortality of 21% and 5-year mortality of 55%.Citation4 Identification of risk factors for exacerbation may help slow disease progression and reduce the economic and societal costs of COPD. Known risk factors for COPD exacerbations include cigarette smoking, infections, exposures to air pollutants and occupational hazards.Citation5 Another potential trigger for such exacerbations is short-term exposures to extreme temperature.Citation6
Extremes of temperature, both cold and hot, have also been associated with excess mortality and morbidity among patients suffering from COPD.Citation7 Previously reported works have demonstrated conflicting results on the correlation of ambient temperature and COPD hospitalization, emergency room visits, and outpatient clinic visits.Citation6,Citation8–Citation13 Several published studies suggest that a decline in ambient temperature is linked with a higher susceptibility to COPD risk.Citation6,Citation8–Citation10 Other researches have reported higher COPD risks during high temperature.Citation11–Citation13 However, research conducted in Taiwan from 2000 to 2008 has reported a U-shaped association.Citation14 Furthermore, previous studies on temperature and COPD have been conducted mostly in the developed regions rather than the developing ones. Therefore, high-quality evidence and large population-based study from China are certainly lacking.
Mean ambient temperature and the frequency of extreme temperature weather may increase due to climate change in the near future.Citation15 It is, therefore, important to understand how temperature may impact COPD patients and to find an optimal index of temperature for health environment research. Ambient daily mean temperature and apparent temperature are two commonly studied indices of thermal stress.Citation16 This study aims to examine the relationship between ambient temperature (including Tmean and AT as indices) and AECOPD hospitalizations among residents in urban areas of Beijing between 2013 and 2016. Quantifying the effect of temperature for AECOPD hospitalizations and identifying susceptible populations could provide useful information for disease surveillance and prevention strategies.
Methods
Study Sites and Data Collection
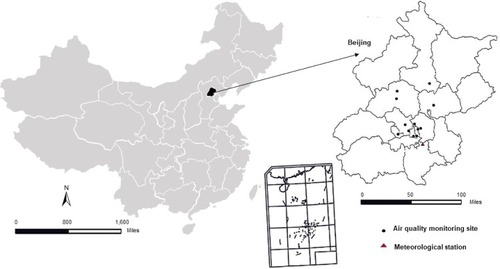
Beijing is the capital of the People’s Republic of China, the world’s third most populous city, and most populous capital city. It has an urban area of 4144 km2 (1600 sq mi), a population of more than 22 million in 2015. It lies in a semi-humid continental monsoon region in a warm northern temperature zone. In terms of seasons, Beijing has dry-cold winters and humid-hot summers while springs and autumns are both windy and relatively short in duration. The location and geographical properties of Beijing are shown in .
Figure 1 Location of 12 air quality monitoring sites, and one meteorological station in Beijing, China.
Data on AECOPD hospitalizations in major hospitals were collected from Beijing Public Information Center between January 1, 2013, and December 31, 2016. AECOPD was defined according to the International Classification of Disease revision 10 (ICD-10: J41–J44). The study was approved by the ethical committee of Peking Union Medical College Hospital. All data were fully anonymized before gathered for research purposes.
Meteorological data were obtained from Beijing Meteorological Bureau and included daily Tmean, relative humidity, wind speed, and air pressure. AT,Citation17 an index to reflect the individual perception of combined exposure to temperature, humidity and wind speed is calculated as
Here, e denotes the water vapor pressure that is performed by the following formula:
To adjust for the possible effects of air conditions on AECOPD hospitalizations, Air Quality Index (AQI) was obtained from the Beijing Environmental Monitoring Center. There was no missing data during the study period. Air pollutant data were measured at 12 monitoring stations spread across Beijing, shown in .
Statistical Analysis
Previous studies suggested that temperature usually has a delayed effect when it comes to respiratory conditions. In the study, a quasi-Poisson function combined with a distributed lag non-linear model (DLNM) was used to examine the temperature effect on AECOPD hospitalizations. This method allows us to simultaneously describe a non-linear exposure-response association and delayed or harvesting effects.Citation18,Citation19
We controlled for the long-term trend and seasonality of daily number of hospitalizations using a natural cubic spline with 7 degrees of freedom (df) per year for time, relative humidity, wind speed, air pressure and AQI using a natural cubic spline with 3 df. To control any confounding weekly pattern, the day of the week was also included as a variable. To analyze the temperature-AECOPD hospitalization relationship, we used a natural cubic spline with 4 df, respectively, for temperature dimension and lag dimension. We placed knots at equally spaced percentiles of temperature distribution and at equally spaced log-values of lag.Citation20 A maximum lag of 30 was used to completely capture the overall temperature effect and adjust for a possible harvesting effect.Citation21
Optimum temperature was used as the reference value to calculate the health risk of high and low temperature. To estimate health effects the extreme and moderate high temperature, we, respectively, computed the RR of AECOPD hospitalizations at the 99th and 90th percentiles of temperature in comparison with 75th percentile of temperature; for the extreme and moderate low-temperature effect estimates, we, respectively, computed the RR of AECOPD hospitalizations at the 1st and 10th percentiles of temperature in comparison with 25th percentile of temperature, which was motivated by previous studies.Citation22,Citation23 Furthermore, to produce an easily interpretable effect estimates with previous studies, we further quantified the effect estimates of low and high temperature by per an absolute change (1°C) of abovementioned temperature range, for example, 1°C increase from 90th percentile of temperature to 99th percentile of temperature for the extreme temperature effect. This method of calculating temperature effects had been applied in the previous study.Citation23 We also examined and plotted cumulative relative risks of temperature at lag 0, lag 0–3, 0–7, 0–14 and 0–30 days to describe the acute, moderate acute, moderate delayed, delayed, and long-lasting level effects, separately.
In addition, to assess which temperature index is a better predictor for the influence of temperature on health, we compared the effect estimates of low and high temperature on hospitalizations by using Tmean and AT, and we also compared the corresponding Akaike’s Information Criterion for quasi-Poisson (Q-AIC) for these two indexes, separately. And to identify the vulnerable subpopulations, we also conducted subgroup analyses that were stratified by gender (male vs. female) and age (<65 years old vs. ≥65 years old). The Z-test was applied to test the statistical significance of the differences between effect estimates by age and gender.Citation24
All analyses and modeling were conducted using the R software (version 3.4.3), with its “dlnm” package. Statistical significance was set at p value <0.05.Citation18
Results
Data Description
Summary of daily AECOPD hospitalizations and Meteorological Data are shown in . A total of 143, 318 AECOPD hospitalizations were collected during the study period, with daily hospitalizations ranging from 17 to 226. The average Tmean and AT were 12.88°C and 5.85°C, respectively. The means and standard deviations (SD) of AP, RH, WS, and AQI were 1016.56±10.17 hPa, 53.43±19.86%, 9.29±4.75 m/s, and 123.65±75.17, respectively. The composition of daily hospitalizations differed by sex-and age-subgroup: Two-thirds of the patients were male and 82.60% were 65 and older. shows the Spearman correlation between meteorological indices. Tmean and AT estimates were strongly correlated. Tmean was positively correlated with relative humidity, while negatively correlated with the other three weather variables.
Table 1 Description of Daily AECOPD Hospitalizations and Meteorological Data in Beijing, China, 2013–2016
Table 2 Spearman Correlation Coefficients Between Meteorological Data in Beijing, China, 2013–2016
Effect of Tmean and AT on Daily Hospitalizations
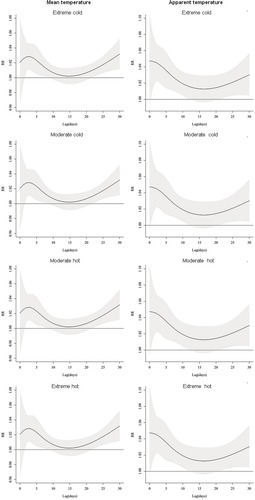
shows the lag structures of cold and hot effects on AECOPD hospitalizations. In general, the effects of extreme cold temperature moderate cold temperature peaked at 2 days after exposure and declined slightly with a duration of 30 days, while moderate cold temperature effects appeared acutely and lasted for 14 days. The hot effects on AECOPD hospitalizations appeared after 2 days’ exposure to hot temperature and peaked after about 4–5 days following the exposure to hot temperature and then leveled off in the next 4 weeks. Notably, no apparent harvesting was found for cold and hot effects. Therefore, we present the accumulative hot and cold effects along 30 days.
Figure 2 The cumulative effects of mean temperature on AECOPD hospitalizations over lag 30days in Beijing. The black lines are relative risks of AECOPD hospitalizations and grey regions are 95% confidence intervals.
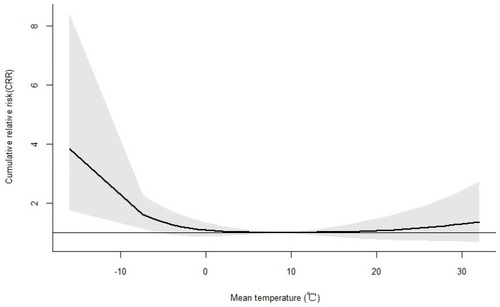
and show the relationship between Tmean and AT on AECOPD hospitalizations over lag 30 days in a reverse J-shaped pattern. The optimum temperature was 9.0°C and 14.7°C for Tmean and AT, respectively. When compared with Tmean, increase in AT had higher RRs for AECOPD hospitalizations, also Q-AIC showed a lower value.
Figure 3 The cumulative effects of apparent temperature on AECOPD hospitalizations over lag 30days in Beijing. The black lines are relative risks of AECOPD hospitalizations and grey regions are 95% confidence intervals.
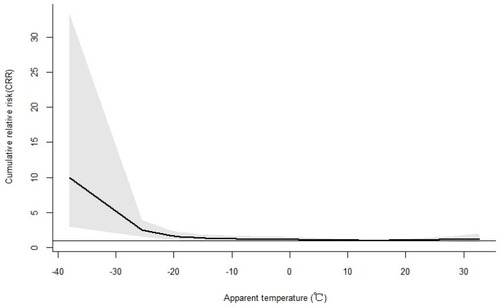
Figure 4 The effect of mean temperature (°C) and apparent temperature on AECOPD hospitalizations along days of lag. The black lines are relative risks and grey regions are 95% confidence intervals.
shows the cumulative effect of cold temperature on AECOPD hospitalization by gender and age over lag 0–30 days. When compared with moderate temperature (10th vs 25th), extreme temperature (1st vs 25th) had greater effects on AECOPD hospitalization. The increased cumulative effects of extreme temperature at Tmean and AT were 1.55 (95% CI: 1.21,2.00) and 2.08 (95% CI: 1.44,3.01) respectively, while those of the moderate temperate were 1.11 (95% CI: 0.99,1.24) and 1.07 (95% CI: 0.93,1.22) respectively. However, there was no significant association between high temperature and AECOPD hospitalization (). The changing trends of CRR from the temperature in subgroups were consistent with the total population. Besides, the effect of temperature indexed by AT on AECOPD event was greater compared to that of Tmean. The adverse effects of temperatures were more prominent for female and people aged <65 years, but the difference was statistically insignificant (P > 0.05).
Table 3 Relative Risks and Their 95% Confidence Intervals of Extreme and Moderate Cold Temperatures on AECOPD Hospitalizations Over Lag 30 Days by Sex and Age Groups
Table 4 Relative Risks and Their 95% Confidence Intervals of Extreme and Moderate Hot Temperatures on AECOPD Hospitalizations Over Lag 30 Days by Sex and Age Groups
The effect estimates of low and high temperature by per absolute change (1°C) of extreme and moderate temperature range were shown in S-Table 1 and S-Table 2 in Supplementary materials.
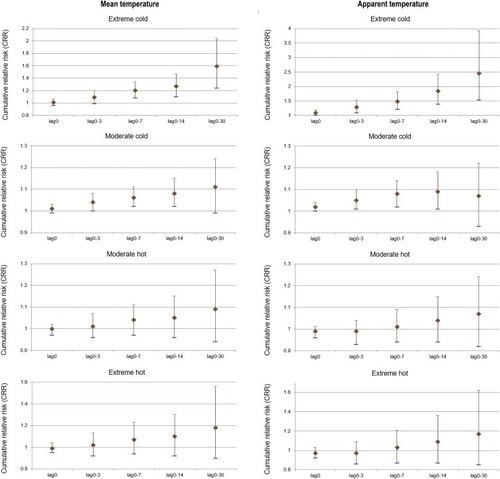
As indicated in , the association between temperature and AECOPD hospitalizations varied by lag periods. The RRs for cold and extreme cold temperatures increased with more lagged days. For cold effect, the CRR of extreme cold temperature on AECOPD hospitalizations gradually increased for up to weeks with statistical significance. Moderate low temperature also had a mild adverse impact on AECOPD hospitalizations. For hot effect, the CRR of hot temperature on AECOPD hospitalizations gradually increased with the lag days. However, the effects were statistically insignificant (P > 0.05).
Figure 5 The cumulative relative risk and their 95% confidence intervals of cold and hot effects on AECOPD hospitalizations along different lag days in Beijing, China, 2013–2016.
Discussion
This large-scale population-based study showed that short-term exposure to low temperature increased the risk of AECOPD hospitalizations, while high temperature had a limited effect. We also showed that the adverse temperature effects are rather delayed, lasting up to a few weeks post-exposure. The females and patients younger than 65 years old were found to be more vulnerable to low temperature.
Our study found that low temperature, rather than high temperature, had a significant and positive correlation with AECOPD hospitalizations in Beijing. This result is consistent with previously reported studies conducted in regions with different climatic conditions. For example, the Korean COPD subgroup study based on big data analysis has also concluded that the lowest temperature was associated with acute exacerbations.Citation25 A previous nationwide study in Taiwan reported that the risk of COPD exacerbation rate increased by over 0.8% for every 1°C rise in air temperature.Citation8 Another cohort study from 1995 to 2009 in London estimated that exposure to lower temperature was associated with more severe COPD exacerbations.Citation26 In a recent study in HongKong during 2004–2011 reported that COPD hospitalization was more sensitive to cool temperatures among adults over 60.Citation10 However, other studies have demonstrated an increase in hospitalization due to exacerbations on days with high mean temperature.Citation12 Although the RR curve tends to increase in hot temperature in our study, there is no statistical significance. Similarly, a study in the UK found no relation between short-term heat and total emergency room visits.Citation27 We speculated that the hot temperature effect may be modified by different climates, air pollution, population sizes, and housing types. Besides, individuals in our study were vulnerable to the effects of cold temperature than hot temperature exposure may be explained by brief excursions in cold outdoor environments and gain more access to air condition in hot weather.
Several mechanisms have been proposed why cold weather is linked to increases in pulmonary diseases. Firstly, cold temperatures were found to decrease lung function. A study conducted in East London showed FEV1 was lower in cold weeks compared to the warm ones during a 1-year epoch.Citation9 Secondly, bronchoconstriction and inflammation were more robust as temperature decreases.Citation28 Thirdly, cold weather may induce mucus hypersecretion in the airway, which may induce AECOPD in the setting of cold exposure.Citation29
Previous studies showed high temperature had a short lag effect on pulmonary diseases while that of low temperature tends to last longer.Citation30–Citation32 However, no apparent harvesting effects of temperature on AECOPD hospitalizations were observed in Beijing, China. Lin et al found that the greatest number of total emergency room visits was 0–14 days after elevated temperatures.Citation30 Baccini et al found that harvesting effect was more pronounced in the North-continental cities than in the Mediterranean cities.Citation33 Different regions, climatic conditions and socioeconomic characteristics may have blunted the harvesting effect. Thus, our results suggest more attention to be paid on the lasting effect of extreme temperature to prevent AECOPD in Beijing.
The effects of temperature indexed by AT were greater than that of Tmean on AECOPD hospitalizations. Compared with Tmean, AT was shown to be a better predictor for the health effect assessment of temperature in Beijing. The potential explanation for this is that the perceived-temperature may be different from the actual temperature because of factors such as wind-chill or humidity. The low temperature of AT is actually colder than low temperature of Tmean. Kunst et al also suggest that AT is a better measure of human response to wind-chill related stress in cold season than simple ambient temperature or other thermal indices.Citation34 In hot weather, when humidity is high and wind speed is low, the actual apparent temperature of the environment is higher because the body cools itself at a slower rate as the environment makes it harder for the sweat to evaporate, thus greater effects on AECOPD.
Contrary to the previous studies,Citation8,Citation13,Citation35 we found that patients under the age of 65 were more susceptible to cold temperature for AECOPD hospitalizations. In theory, the elderly are more sensitive to extreme temperature due to thermoregulation impairment, reduced respiratory function, weaken immune defenses and higher prevalence of comorbidities.Citation36 This inconsistency between theoretical results and our results may be explained by the fact that younger patients are more likely to go outdoors, which increases their exposure to cold temperature. Consistent with previously reported study,Citation35 we found that the impact of cold temperature was greater for females. Temperature-related susceptibility by gender may be due to women’s special reaction to the cold exposure that they require shivering as a source of heat production earlier than men.Citation37
The study has several advantages. Firstly, the majority of research investigating the relationship between temperature and health have largely focused on numbers dying or odds of death. Contrarily, hospitalization is a more susceptible indicator to reflect the health fluctuations in environmental factors, which contain higher counts for patients and confers a better statistical power. Secondly, distributed non-linear lag models, an advanced statistical approach, account for the delayed and non-linear effects of air pollutants and temperature flexibly and provide estimates of the lag-specific risks and cumulative effect simultaneously. Thirdly, we used only the main diagnosis of hospitalizations in metropolitan Beijing, which can avoid admission bias and reduce misclassification of outcomes.
Nevertheless, our present study has some potential limitations. Firstly, we used the average concentrations measured at fixed monitoring stations rather than personal measures for air pollution and weather exposures, which may bias our results toward the null, underestimating the RRs.Citation38 Secondly, potential confounding factors at the individual level for AECOPD, including smoking, use of air conditioning, indoor activity and pollutant patterns, could not be fully accounted for due to lack of information. Thirdly, the possible misdiagnosis of AECOPD interpreting the findings should also be taken into account. Fourthly, we could not identify the re-admissions for patients with the same AECOPD from the available data. Besides, data are only from urban areas of Beijing, with high air pollution and high population density. Also, the study period was only 4 years. It ought to be cautious when generalizing the findings to other climates and other geographic areas. Further assessment aimed at the definition of prevention programs and warning systems should research the potential added effect of specific exposures and adaptation of the population, as well as heat waves and cold spells.
Conclusion
We observed significant nonlinear and delayed effects of cold temperature on AECOPD hospitalizations in this study. Compared with the mean temperature, the apparent temperature indicating how people actually feel is more closely associated with AECOPD. The susceptive groups were females and patients under 65 years. To reduce temperature-related AECOPD hospitalizations, health authority should take measures to protect the vulnerable group and focus more on the long-lasting effect.
Abbreviations
Tmean, daily mean temperature; AT, daily apparent temperature; Q-AIC, Akaike’s Information Criterion for quasi-Poisson; AECOPD, acute exacerbations of chronic obstructive pulmonary disease; DLNM, Distributed Lag Non-linear Model; CRR, Cumulative Relative Risk; RR, Relative Risk; CI, Confidence interval; Total, Total hospitalizations.
Disclosure
Yongqiang Zhang reports grants from Central Public-interest Scientific Institution, during the conduct of the study. The authors report no other conflicts of interest in this work.
Acknowledgment
We sincerely thank those who participated in data collection and management.
References
- VosT, AllenC, AroraM; GBD 2015 Disease and Injury Incidence and Prevalence Collaborators G 2015 D and II and P. Global, regional, and national incidence, prevalence, and years lived with disability for 310 diseases and injuries, 1990–2015: a systematic analysis for the global burden of disease study 2015. Lancet (London, England). 2016;388(10053):1545–1602. doi:10.1016/S0140-6736(16)31678-6
- ZhouM, WangH, ZhuJ, et al. Cause-specific mortality for 240 causes in China during 1990–2013: a systematic subnational analysis for the global burden of disease study 2013. Lancet. 2016;387(10015):251–272. doi:10.1016/S0140-6736(15)00551-626510778
- Rodriguez-RoisinR. Toward a consensus definition for COPD exacerbations. Chest. 2000;117:398S–401S. doi:10.1378/chest.117.5_suppl_2.398S10843984
- ZhouX, LiQ, ZhouX. Exacerbation of chronic obstructive pulmonary disease. Cell Biochem Biophys. 2015;73:349–355. doi:10.1007/s12013-015-0605-927352322
- Lõpez-CamposJL, TanW, SorianoJB. Global burden of COPD. Respirology. 2016;21:14–23. doi:10.1111/resp.1266026494423
- De Miguel-DíezJ, Hernández-VázquezJ, López-De-AndrésA, Álvaro-MecaA, Hernández-BarreraV, Jiménez-GarcíaR. Analysis of environmental risk factors for chronic obstructive pulmonary disease exacerbation: a case-crossover study (2004–2013). PLoS One. 2019;14:5. doi:10.1371/journal.pone.0217143
- HanselNN, McCormackMC, KimV. The effects of air pollution and temperature on COPD. COPD. 2016;13:3. doi:10.3109/15412555.2015.1089846
- TsengCM, ChenYT, OuSM, et al. The effect of cold temperature on increased exacerbation of chronic obstructive pulmonary disease: a nationwide study. PLoS One. 2013;8(3):e57066. doi:10.1371/journal.pone.005706623554858
- DonaldsonGC, SeemungalT, JeffriesDJ, WedzichaJA. Effect of temperature on lung function and symptoms in chronic obstructive pulmonary disease. Eur Respir J. 1999;13:844. doi:10.1034/j.1399-3003.1999.13d25.x10362051
- LamHC, ChanEY, GogginsWB. Comparison of short-term associations with meteorological variables between COPD and pneumonia hospitalization among the elderly in Hong Kong—a time-series study. Int J Biometeorol. 2018. doi:10.1007/s00484-018-1542-2
- FerrariU, ExnerT, WankaER, et al. Influence of air pressure, humidity, solar radiation, temperature, and wind speed on ambulatory visits due to chronic obstructive pulmonary disease in Bavaria, Germany. Int J Biometeorol. 2012. doi:10.1007/s00484-011-0405-x
- AndersonGB, DominiciF, WangY, McCormackMC, BellML, PengRD. Heat-related emergency hospitalizations for respiratory diseases in the medicare population. Am J Respir Crit Care Med. 2013;187(10):1098–1103. doi:10.1164/rccm.201211-1969OC23491405
- ZhaoQ, LiS, CoelhoMD, et al. Ambient heat and hospitalisation for COPD in Brazil: a nationwide case-crossover study. Thorax. 2019. doi:10.1136/thoraxjnl-2019-213486
- WangY-C, LinY-K. Temperature effects on outpatient visits of respiratory diseases, asthma, and chronic airway obstruction in Taiwan. Int J Biometeorol. 2015;59(7):815–825. doi:10.1007/s00484-014-0899-025225115
- SeneviratneSI, NichollsN, EasterlingD, et al. Changes in climate extremes and their impacts on the natural physical environment: an overview of the IPCC SREX report. EGU Gen Assem. 2012;14:12566. doi:10.1016/j.atmosres.2011.1004.1007
- XuW, ThachTQ, ChauYK, et al. Thermal stress associated mortality risk and effect modification by sex and obesity in an elderly cohort of Chinese in Hong Kong. Environ Pollut. 2013;178:288–293. doi:10.1016/j.envpol.2013.03.02023587859
- KrstićG. Apparent temperature and air pollution vs. elderly population mortality in metro Vancouver. PLoS One. 2011. doi:10.1371/journal.pone.0025101
- GasparriniA. Distributed lag linear and non-linear models in R: the package dlnm. J Stat Softw. 2011;43(8):1–20. doi:10.18637/jss.v043.i08
- GasparriniaA, ArmstrongB, KenwardMG. Distributed lag non-linear models. Stat Med. 2010;29(21):2224–2234. doi:10.1002/sim.394020812303
- YangJ, OuCQ, DingY, ZhouYX, ChenPY. Daily temperature and mortality: a study of distributed lag non-linear effect and effect modification in Guangzhou. Environ Health. 2012. doi:10.1186/1476-069X-11-63
- GuoY, BarnettAG, PanX, YuW, TongS. The impact of temperature on mortality in Tianjin, china: a case-crossover design with a distributed lag nonlinear model. Environ Health Perspect. 2011;119(12):1719–1725. doi:10.1289/ehp.110359821827978
- YangJ, YinP, ZhouM, et al. The effect of ambient temperature on diabetes mortality in China: a multi-city time series study. Sci Total Environ. 2016. doi:10.1016/j.scitotenv.2015.11.014
- YangJ, OuCQ, GuoY, et al. The burden of ambient temperature on years of life lost in Guangzhou, China. Sci Rep. 2015. doi:10.1038/srep12250
- YangJ, YinP, SunJ, et al. Heatwave and mortality in 31 major Chinese cities: definition, vulnerability and implications. Sci Total Environ. 2019. doi:10.1016/j.scitotenv.2018.08.332
- LeeJ, JungHM, KimSK, et al. Factors associated with chronic obstructive pulmonary disease exacerbation, based on big data analysis. Sci Rep. 2019;9(1):1–8. doi:10.1038/s41598-019-43167-w30626917
- DonaldsonGC, GoldringJJ, WedzichaJA. Influence of season on exacerbation characteristics in patients with COPD. Chest. 2012;141(1):94–100. doi:10.1378/chest.11-028121799024
- KovatsRS, HajatS, WilkinsonP. Contrasting patterns of mortality and hospital admissions during hot weather and heat waves in Greater London, UK. Occup Environ Med. 2004;61(11):893–898. doi:10.1136/oem.2003.01204715477282
- KoskelaHO, KoskelaAK, TukiainenHO. Bronchoconstriction due to cold weather in COPD: the roles of direct airway effects and cutaneous reflex mechanisms. Chest. 1996;110(3):632–636. doi:10.1378/chest.110.3.6328797403
- LiM, LiQ, YangG, KolosovVP, PerelmanJM, ZhouXD. Cold temperature induces mucin hypersecretion from normal human bronchial epithelial cells in vitro through a transient receptor potential melastatin 8 (TRPM8)-mediated mechanism. J Allergy Clin Immunol. 2011;128:3. doi:10.1016/j.jaci.2011.04.03221477849
- LinS, LuoM, WalkerRJ, LiuX, HwangS-A, ChineryR. Extreme high temperatures and hospital admissions for respiratory and cardiovascular diseases. Epidemiology. 2009;20(5):738–746. doi:10.1097/EDE.0b013e3181ad552219593155
- ChanEY, GogginsWB, YueJS, LeeP. Hospital admissions as a function of temperature, other weather phenomena and pollution levels in an urban setting in China. Bull World Health Organ. 2013;91(8):576–584. doi:10.2471/BLT.12.11303523940405
- EbiKL, MillsD. Winter mortality in a warming climate: a reassessment. Wiley Interdiscip Rev Clim Change. 2013;4(3):203–212. doi:10.1002/wcc.211
- BacciniM, KosatskyT, BiggeriA, BaradaranHR. Impact of summer heat on urban population mortality in europe during the 1990s: an evaluation of years of life lost adjusted for harvesting. PLoS One. 2013;8:e69638. doi:10.1371/journal.pone.006963823894516
- KunstAE, GroenhofF, MackenbachJP. The association between two windchill indices and daily mortality variation in the Netherlands. Am J Public Health. 1994;84:1738–1742. doi:10.2105/AJPH.84.11.17387977910
- LuanG, YinP, WangL, ZhouM. Association between ambient temperature and chronic obstructive pulmonary disease: a population-based study of the years of life lost. Int J Environ Health Res. 2019. doi:10.1080/09603123.2018.1533533
- YuW, MengersenK, WangX, et al. Daily average temperature and mortality among the elderly: a meta-analysis and systematic review of epidemiological evidence. Int J Biometeorol. 2012;56(4):569–581. doi:10.1007/s00484-011-0497-321975970
- KaikaewK, van den BeukelJC, NeggersSJCMM, ThemmenAPN, VisserJA, GrefhorstA. Sex difference in cold perception and shivering onset upon gradual cold exposure. J Therm Biol. 2018;77:137–144. doi:10.1016/j.jtherbio.2018.08.01630196892
- ZegerSL, ThomasD, DominiciF, et al. Exposure measurement error in time-series studies of air pollution: concepts and consequences. Environ Health Perspect. 2000;108:419–426. doi:10.1289/ehp.0010841910811568