
Abstract
Purpose
The Global Initiative for Chronic Obstructive Lung Disease (GOLD) has published three classifications of COPD from 2007 to 2017. No studies have investigated the ability of these classifications to predict COPD-related hospitalizations. We aimed to compare the discrimination ability of the GOLD 2007, 2011, and 2017 classifications to predict COPD hospitalization and all-cause mortality.
Patients and Methods
We followed 1300 participants with COPD aged ≥40 years who participated in the HUNT Study (1995–1997) through to December 31, 2015. Survival analysis and time-dependent area under receiver operating characteristics curves (AUC) were used to compare the discrimination abilities of the GOLD classifications.
Results
Of the 1300 participants, 522 were hospitalized due to COPD and 896 died over 20.4 years of follow-up. In adjusted models, worsening GOLD 2007, GOLD 2011, or GOLD 2017 categories were associated with higher hazards for COPD hospitalization and all-cause mortality, except for the GOLD 2017 classification and all-cause mortality (ptrend=0.114). In crude models, the AUCs (95% CI) for the GOLD 2007, GOLD 2011, and GOLD 2017 for COPD hospitalization were 63.1 (58.7–66.9), 60.9 (56.1–64.4), and 56.1 (54.0–58.1), respectively, at 20-years’ follow-up. Corresponding estimates for all-cause mortality were 57.0 (54.8–59.1), 54.1 (52.1–56.0), and 52.6 (51.0–54.3). The differences in AUCs between the GOLD classifications to predict COPD hospitalization and all-cause mortality were constant over the follow-up time.
Conclusion
The GOLD 2007 classification was better than the GOLD 2011 and 2017 classifications at predicting COPD hospitalization and all-cause mortality.
Introduction
The Global Initiative for Chronic Obstructive Lung Disease (GOLD) published classifications of COPD in 2007, 2011 and recently in 2017.Citation1 In 2007, GOLD grades were introduced based on the severity of airflow limitation. In 2011, ABCD groups were introduced by combining severity of airflow limitation with exacerbation history and symptom burden.Citation2,Citation3 In 2017, the ABCD groups were updated to include only exacerbation history and symptom burden, and used severity of airflow limitation separately.Citation1
Although the GOLD classifications were meant to guide therapy, clinicians use the prognostic value of these classifications for risk classification at an individual level.Citation4 Studies have compared the discrimination abilities of the GOLD 2007 and GOLD 2011 classifications to predict exacerbation and mortality.Citation4–Citation8 Johannessen et alCitation5 found that the GOLD 2007 and GOLD 2011 classifications predicted respiratory hospitalization similarly well; however, Lange et alCitation6 and Chen et alCitation7 found that the GOLD 2011 classification was better than the GOLD 2007. In a pooled analysis of 22 cohorts, the GOLD 2007 and GOLD 2011 classifications did not differ significantly in predicting mortality.Citation4
Since the publication of the GOLD 2017 classification, the prognostic value of this classification has been debatable with less clear findings.Citation9–Citation12 To our knowledge, only one study has compared all three GOLD classifications and found that the GOLD 2017 classification predicted respiratory and all-cause mortality similarly well as the GOLD 2007 and GOLD 2011 classifications.Citation9 No previous studies have investigated the risk of COPD hospitalization using the GOLD 2017 classification or compared their discrimination ability with the previous GOLD classifications to predict COPD hospitalization. Criner et alCitation11 found that the prediction ability of the GOLD 2011 and GOLD 2017 classification was similar for exacerbation, however, exacerbations were used as binary rather than time-to-event data. They found that GOLD 2011 classification predicted mortality better than the GOLD 2017 classification.Citation11
We aimed to compare the discrimination abilities of all three GOLD classifications to predict COPD hospitalization and all-cause mortality in a large Norwegian COPD cohort over a 20-year follow-up.
Materials and Methods
Study Population
Trøndelag is a county in central Norway with a homogenous and stable population. The HUNT Study invited the entire adult population (≥20 years) of northern Trøndelag to attend clinical examinations and answer questionnaires.Citation13
The study cohort included people aged ≥40 years who participated in HUNT2 (1995–1997, n=44,384, 75.2% participation). A 5% random sample (n=2300) and persons reporting asthma related symptoms, diagnosis or medication use (n=7123) were invited to perform spirometry.Citation14 Participants from rural municipalities and participants from urban municipalities having an airflow limitation [pre-bronchodilator (BD) FEV1/forced vital capacity (FVC)<0.75 or percent-predicted forced expiratory volume in first second (ppFEV1)<80 using the European Coal and Steel Community (ECSC) equationsCitation15] were invited to attend post-BD spirometry (n=5678). We used the airflow limitation criteria to allow for future changes in diagnosis and severity classification of COPD. Among those performing post-BD spirometry (n=4178, 73.6% of invited), 3840 (91.9%) had acceptable spirometry maneuvers. Participants with acceptable post-BD spirometry and COPD were included in the analysis (n=1300) (Supplementary Figure S1). COPD was defined as participants having post-BD FEV1/FVC<0.70 and [respiratory symptoms (daily cough in periods, cough with phlegm, wheezing, and dyspnea) or self-reported doctor-diagnosed COPD].Citation1
This study was conducted in accordance with the Declaration of Helsinki. Ethical approval was obtained from the Regional Committee for Medical Research Ethics (2015/1461/REK midt). All participants gave informed written consent.
Spirometry and Lung Function Classification
Spirometry was performed before and 30 mins after inhalation of 1 mg terbutaline according to the 1994 ATS-guidelines.Citation16,Citation17 Quality assurance of spirometry is described in detail elsewhere.Citation16,Citation18
The GOLD 2007 classification (GOLD grades)Citation1 was categorized as grade 1 (ppFEV1≥80), grade 2 (80>ppFEV1≥50), grade 3 (50>ppFEV1≥30), or grade 4 (ppFEV1<30). The GLI-2012 reference equation was used to calculate ppFEV1 and ppFVC.Citation16,Citation19
The GOLD 2011 (ABCD groups) and GOLD 2017 classification (new ABCD groups)Citation1,Citation3 were categorized as group A, B, C, or D (Supplementary-Figure S2). We defined symptom burden as low or high based on our local dyspnea scale where “dyspnea when walking” (“Do you become short of breath when walking on flat ground at a normal pace?”) corresponds to the 2nd scale on the mMRC dyspnea scale. All the questions on our local dyspnea scale were similar to those of the mMRC dyspnea scale but were phrased as individual “yes or no questions”.Citation20,Citation21 Exacerbation history was based on two questions: “Have you ever taken cortisone tablets for breathing problems/asthma?” and “Have you previously taken it in periods when your illness had worsened?” Participants answering ‘yes’ to both questions and having ≥2 cortisone courses during the last year or ≥3 courses during the last two years were categorized as having a high exacerbation risk.
Clinical Examination and Questionnaires
From clinical examinations and questionnaires, information on age (years), sex, body mass index (BMI, kg/m2), smoking status, smoking pack-years, physical activity, education, diabetes ever, asthma ever, cardiovascular disease, systolic blood pressure (mmHg), and non-fasting total serum cholesterol (mmol/L) were recorded.
Age was recorded to one decimal place. Height and weight were measured with light clothing and without shoes. Height was rounded to the nearest centimeter and weight to the nearest half kilogram.Citation14,Citation22 Cardiovascular disease included self-reported angina pectoris, myocardial infarction, and stroke. From three measurements of systolic blood pressure, the mean of the last two measurements was used.Citation22
Follow-Up and Outcomes
Follow-up for both events (first unplanned COPD hospitalization and all-cause mortality) began at the date of participation in HUNT2 and ended at an event date or at the end of follow-up, 31 December 2015. Participants were right-censored on emigration (n=4). When COPD hospitalization was the event, observations were right-censored at the date of death. There was no other loss to follow-up. COPD hospitalizations were identified from the international statistical classification of disease and related health problems (ICD) codes in medical records (Supplementary-Table S1).Citation23 Information on date of COPD hospitalizations and all-cause mortality was obtained from the Norwegian Cause of Death Registry and The Nord-Trøndelag Hospital Trust, respectively.
Statistical Analysis
COPD hospitalization rates and all-cause mortality rates per 1000 person-years and 95% confidence intervals (CI) were calculated. Cumulative incidence curves for COPD hospitalization and all-cause mortality were constructed. We used the GOLD classifications as continuous measures to test for trend.
Cox proportional hazard models were used to calculate hazard ratios (HRs) and 95% CIs for the association of the GOLD classifications with COPD hospitalization or all-cause mortality. We presented crude HRs (Model 1) and adjusted HRs (Model 2). Model 2 accounts for age (as a continuous variable), sex (women, men), smoking [never, former (<10, 10–19, ≥20 pack-years), current (<10, 10–19, ≥20 pack-years), unknown], body mass index (<25.0, 25.0–29.9, ≥30.0, unknown), and education (<10, ≥10 years, unknown). In supplementary analysis (Model 3) we additionally adjusted for physical activity (no, light exercise, hard exercise, unknown), cardiovascular diseases (no, yes, unknown), asthma ever (no, yes, unknown), diabetes ever (no, yes, unknown), systolic blood pressure (sex-specific quartiles, unknown), and cholesterol (sex-specific quartiles, unknown).
Proportional hazards assumptions were assessed with log-log survival curves and Schoenfeld residuals tests.Citation24 Multicollinearity was tested where the variance inflation factor (VIF) was less than 1.2 in all models.Citation25,Citation26 As a measure of goodness of fit, Akaike Information Criteria (AIC) for each model were estimated (Supplementary-Table S2).Citation27
Incident/dynamic time-dependent area under the receiver operating characteristic curves (AUCs) were used to assess the discrimination ability of the GOLD classifications to predict COPD hospitalization and all-cause mortality.Citation28–Citation30 We used crude models to compare AUCs, as the clinical decision does not explicitly take into account other factors.Citation4,Citation31 We used 10,000 bootstrap iterations to calculate 95% CI for the AUCs.Citation32 A general bootstrap algorithm (gBA) was applied to compare the AUCs.Citation33
Statistical analyses were performed using R 3.5.0 software (http://www.r-project.org) and Stata 15.1 software (StataCorp., College Station, Texas).
Results
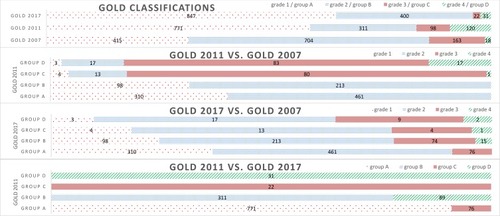
In this population-based COPD cohort with over 20.4 years of follow-up, 522 were hospitalized due to COPD and 896 people died. Using the GOLD 2007 classification, 31.9%, 54.2%, 12.5%, and 1.4% were classified as grades 1–4, respectively. The number of people in the highest two categories was slightly higher using the GOLD 2011 (16.8% in groups C or D) than the GOLD 2007 (13.9% in grades 3 or 4) but considerably lower using the GOLD 2017 (4.1% in groups C or D) (, ).
Table 1 Characteristics of COPD Participants Aged ≥40 Years in the HUNT Study (N=1300)
Figure 1 Distribution of participants in different GOLD classifications.
We observed increasing COPD hospitalization and all-cause mortality with worsening categories of the GOLD 2007, GOLD 2011, or GOLD 2017 classifications (ptrend<0.001), except for the GOLD 2017 classification and all-cause mortality (ptrend=0.411) (). Similar results were observed in unadjusted cumulative incidence curves (Supplementary-Figure S3) and for HRs in adjusted models (: Model 2; Supplementary-Table S3: Model 3).
Table 2 Hazard Ratios for GOLD 2007, GOLD 2011, and GOLD 2017 Among Participants with COPD Aged ≥40 Years in the HUNT2 Study (N=1300)
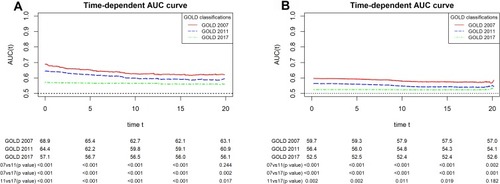
In crude models, the AUCs (95% CI) for COPD hospitalization at 20 years of follow-up for the GOLD 2007, GOLD 2011, and GOLD 2017 classification were 63.1 (58.7–66.9), 60.9 (56.1–64.4), and 55.1 (54.0–58.1), respectively (; ). A similar pattern was observed over the follow-up time (). For all-cause mortality, the corresponding estimates were 57.0 (54.8–59.1), 54.1 (52.1–56.0), and 52.6 (51.0–54.3) at 20 years of follow-up (; ). We observed similar results over follow-up time ().
Table 3 AUC for GOLD 2007, GOLD 2011, and GOLD 2017 at 20 Years of Follow-Up Among Participants with COPD Aged ≥40 Years in the HUNT2 Study (N=1300)
Figure 2 AUC curves for the GOLD 2007, GOLD 2011, and GOLD 2017 classifications for (A) COPD hospitalization and (B) all-cause mortality over follow-up time (years) among participants with COPD aged ≥40 years in the HUNT2 study (N=1300).
Discussion
To our knowledge, this is the first study to investigate the association between the GOLD 2017 classification and COPD hospitalization and to compare its discrimination ability to the previous GOLD classifications (GOLD 2007 and GOLD 2011). We found that the GOLD 2007 classification (based on lung function) was better than the GOLD 2011 classification (based on lung function, symptom burden, and exacerbation history) and the GOLD 2017 classification (based on symptom burden and exacerbation history), where the GOLD 2017 classification was the worst at predicting COPD hospitalization and all-cause mortality.
We found that group D of the GOLD 2017 classification had lower hazards for COPD hospitalization and all-cause mortality than group C. However, the estimates were imprecise for these two groups due to low numbers and the confidence intervals for the HRs overlapped considerably. The GOLD 2017 classification might however misclassify the severity of some COPD cases because it accounts only for symptom burden and exacerbation history and does not include airflow limitations. This leads to 9% of group A and 10% of group D of the GOLD 2017 classification having severe (GOLD grade 3) and mild COPD (GOLD grade 1), respectively. Similar results to our study have been observed by other studies.Citation9,Citation10 The PLATINO study showed no clear pattern for all-cause mortality across the categories of the GOLD 2017 classification.Citation34 No previous studies had investigated COPD hospitalization in relation to the GOLD 2017 classification. However, the COPDGene Cohort study reported the annual rate of exacerbation and found no clear pattern across the categories of the GOLD 2017 classification.Citation11
Other studies have compared the GOLD 2017 with the previous GOLD classifications to predict COPD exacerbation. In contrast to our study, three studiesCitation11,Citation12,Citation35 observed that the GOLD 2017 and the GOLD 2011 classifications predicted exacerbation similarly well. The discrepancies might be because these studies did not take exacerbations as time-to-event data when comparing the discrimination ability. Furthermore, we observed COPD hospitalization where COPD hospitalization and exacerbation are related; however, not all exacerbations lead to hospitalizations. None of these studies included the GOLD 2007 classification. Similar to our study, a study by Cabrera Lopez et alCitation10 observed that all-cause mortality was better predicted by the GOLD 2011 than by the GOLD 2017 classification. In contrast to our study, Gedebjerg et alCitation9 found that the three GOLD classifications did not differ significantly in predicting respiratory and all-cause mortality. When they further divided the GOLD 2017 classification into a 16 sub-group classification by severity of airflow limitation, they found that the 16 sub-groups classification predicted mortality better than the GOLD classifications.Citation9 We attempted to repeat this analysis but we had sparse data for this classification with no observations in some sub-groups and highly imprecise estimates.
The GOLD classifications are recommended to guide the treatment approach for individual patients in clinics.Citation1,Citation4 The GOLD 2007 classification used airflow limitation but due to disease complexity that might not be fully explained by lung function in individual patients, the classification was upgraded in 2011 to include clinical parameters such as symptom burden and exacerbation history to classify patients into ABCD groups.Citation1,Citation5 Furthermore, in 2017, the GOLD separates airflow limitation from ABCD groups.Citation1 In our study, we observed that from group C and D of GOLD 2011 classification 78% of group C were moved to group A of the GOLD 2017 classification and 74% of group D participants were moved to group B of the GOLD 2017 classification. In addition, we observed that using the GOLD 2017 classification, 9% of group A participants had severe COPD (GOLD grade 3) and 22% of group B participants had severe or very severe COPD (GOLD grades 3 or 4). Although the recently updated GOLD 2019 reportCitation36 recommended use of the GOLD 2017 classification for prescribing an initial pharmacological treatment, the use of the GOLD 2017 classification to select a treatment approach should be cautioned for those in groups A or B. Further studies are required to understand the treatment effects related to prognosis of outcomes using the GOLD 2017 classification. In our study, the GOLD 2007 classification was better than the GOLD 2011 classification, followed by the GOLD 2017 classification to predict COPD hospitalization and all-cause mortality. Despite this observation, all classifications were generally still poor prognostic markers for COPD hospitalization and all-cause mortality.Citation37 The best prognostic marker might not necessarily be the best guide to pharmaceutical treatment because two individuals might have the same risk of mortality for different reasons, which would indicate different treatment strategies, therefore, a new classification based on other or additional criteria should be suggested to assess prognosis.
This study had several strengths. It is the first study to investigate the discrimination ability of all three GOLD classifications over a 20-year period to predict COPD hospitalization. The study is based on the HUNT2 Lung Study which had a reasonably high level of participation (76.0% of people invited to the HUNT2 Lung Study), limiting the potential for selection bias. We had complete information on mortality and there was no loss to follow-up other than very few emigrations (4 out of 1300 participants). To reduce measurement error, quality assurance of spirometry curves was performed.Citation16,Citation18
This study also had certain limitations. We had information on COPD hospitalizations only from the hospitals of study area (northern Trøndelag) and we lacked data from other hospitals of Norway. We lacked information on COPD hospitalizations prior to baseline; however, we used exacerbation history to classify groups in the GOLD 2011 and GOLD 2017 classification. The mMRC dyspnea questionnaire should have been used as a scale but we used them as individual questions when the survey was conducted.Citation20 However, a study has found close agreement between our dyspnea questions and mMRC dyspnea scale.Citation20,Citation21 We do not have baseline information on treatment used for the people with COPD during 1995–1997. Due to this, there may be bias in the association of GOLD classifications and outcomes (COPD hospitalization and all-cause mortality). However, we do not expect this to have substantially influenced the comparison of discrimination abilities between GOLD classifications. There was missing information on some covariates, therefore to avoid sample loss in adjusted models, a missing indicator variable (missing information as unknown category) was used which might bias the association between the GOLD classifications and COPD hospitalization or all-cause mortality.
Conclusion
We found that the GOLD 2007 classification was better than the GOLD 2011 and GOLD 2017 classifications at predicting COPD hospitalization and all-cause mortality.
Author Contributions
All authors contributed to data analysis, drafting or revising the article, gave final approval of the version to be published, and agree to be accountable for all aspects of the work.
Disclosure
LB reports personal fees for presenting the abstract of this study at Nordic Respiratory Science Forum (NRSF) organized by AstraZeneca in 2019. The authors report no other conflicts of interest in this work.
Acknowledgments
The Nord-Trøndelag Health Study (HUNT) is a collaboration between HUNT Research Centre (Faculty of Medicine and Health Science, Norwegian University of Science and Technology NTNU), Nord-Trøndelag County Council and the Norwegian Institute of Public Health. The HUNT2 Lung Study was partly funded through a non-demanding grant from AstraZeneca Norway. We thank Nord-Trøndelag Hospital Trust for providing patient records.
Funding
This study was funded by ExtraStiftelsen Helse og Rehabilitering and Landsforeningen for hjerte-og-lungesyke (the Norwegian Extra Foundation for Health and Rehabilitation and the Norwegian Heart and Lung Patient Organization) (project number 2016/FO79031) and the liaison committee of the Central Norway Regional Health Authority – NTNU (Norwegian University of Science and Technology). Ben Brumpton works in a research unit funded by Stiftelsen Kristian Gerhard Jebsen; Faculty of Medicine and Health Sciences, NTNU; The Liaison Committee for education, research and innovation in Central Norway; the Joint Research Committee between St. Olavs Hospital and the Faculty of Medicine and Health Sciences, NTNU. Ben Brumpton and David Carslake work at Medical Research Council Integrative Epidemiology Unit at the University of Bristol which is supported by the Medical Research Council (MC_UU_00011/1) and the University of Bristol.
References
- Global Initiative for Chronic Obstructive Lung Disease. Global strategy for the diagnosis, management, and prevention of chronic obstructive pulmonary diesease. 2017 Available from: http://goldcopd.org/. Accessed 018 2017.
- Global Initiative for Chronic Obstructive Lung Disease. Global strategy for the diagnosis, management, and prevention of chronic obstructive pulmonary diesease. 2011 Available from: http://goldcopd.org/. Accessed 018 2016.
- VestboJ, HurdSS, Rodriguez-RoisinR. The 2011 revision of the global strategy for the diagnosis, management and prevention of COPD (GOLD) – why and what? Clin Respir J. 2012;6(4):208–214. doi:10.1111/crj.1200222906068
- SorianoJB, LamprechtB, RamirezAS, et al. Mortality prediction in chronic obstructive pulmonary disease comparing the GOLD 2007 and 2011 staging systems: a pooled analysis of individual patient data. Lancet Respir Med. 2015;3(6):443–450. doi:10.1016/S2213-2600(15)00157-525995071
- JohannessenA, NilsenRM, StoreboM, GulsvikA, EaganT, BakkeP. Comparison of 2011 and 2007 global initiative for chronic obstructive lung disease guidelines for predicting mortality and hospitalization. Am J Respir Crit Care Med. 2013;188(1):51–59. doi:10.1164/rccm.201212-2276OC23590268
- LangeP, MarottJL, VestboJ, et al. Prediction of the clinical course of chronic obstructive pulmonary disease, using the new GOLD classification: a study of the general population. Am J Respir Crit Care Med. 2012;186(10):975–981. doi:10.1164/rccm.201207-1299OC22997207
- ChenCZ, OuCY, HsuCH, HsiueTR. Validation of the GOLD 2013 classification in predicting exacerbations and mortality in Taiwanese patients with chronic obstructive pulmonary disease. J Formosan Med Assoc. 2015;114(12):1258–1266. doi:10.1016/j.jfma.2014.12.00325676673
- LeivsethL, BrumptonBM, NilsenTIL, MaiX-M, JohnsenR, LanghammerA. GOLD classifications and mortality in chronic obstructive pulmonary disease: the HUNT Study, Norway. Thorax. 2013;68(10):914. doi:10.1136/thoraxjnl-2013-20327023611880
- GedebjergA, SzepligetiSK, WackerhausenLH, et al. Prediction of mortality in patients with chronic obstructive pulmonary disease with the new global initiative for Chronic Obstructive Lung Disease 2017 classification: a cohort study. Lancet Respir Med. 2018;6(3):204–212. doi:10.1016/S2213-2600(18)30002-X29331311
- Cabrera LopezC, Casanova MacarioC, Marin TrigoJM, et al. Comparison of the 2017 and 2015 global initiative for Chronic Obstructive Lung Disease reports. Impact on grouping and outcomes. Am J Respir Crit Care Med. 2018;197(4):463–469. doi:10.1164/rccm.201707-1363OC29099607
- CrinerRN, LabakiWW, ReganEA; for the COPD Gene Investigators, et al. Mortality and exacerbations by global initiative for Chronic Obstructive Lung Disease Groups ABCD: 2011 versus 2017 in the COPDGene® Cohort. Chronic Obstr Pulm Dis. 2019;6(1):64–73. doi:10.15326/jcopdf.6.1.2018.0130.30775425
- HanM-Z, HsiueT-R, TsaiS-H, HuangT-H, LiaoX-M, ChenC-Z. Validation of the GOLD 2017 and new 16 subgroups (1A-4D) classifications in predicting exacerbation and mortality in COPD patients. Int J Chron Obstruct Pulmon Dis. 2018;13:3425–3433. doi:10.2147/COPD.S17904830425472
- KrokstadS, LanghammerA, HveemK, et al. Cohort profile: the HUNT study, Norway. Int J Epidemiol. 2013;42(4):968–977. doi:10.1093/ije/dys09522879362
- BhattaL, LeivsethL, MaiX-M, et al. Prevalence and trend of COPD from 1995–1997 to 2006–2008: the HUNT study, Norway. Respir Med. 2018;138:50–56. doi:10.1016/j.rmed.2018.03.02029724393
- QuanjerPH, TammelingGJ, CotesJE, PedersenOF, PeslinR, YernaultJC. Lung volumes and forced ventilatory flows. report working party standardization of lung function tests, european community for steel and coal. Official Statement of the European Respiratory Society. Eur Respir J Suppl. 1993;16:5–40. doi:10.1183/09041950.005s16938499054
- LanghammerA, JohannessenA, HolmenTL, et al. Global lung function initiative 2012 reference equations for spirometry in the Norwegian population. Eur Respir J. 2016;48(6):1602–1611. doi:10.1183/13993003.00443-201627824594
- Standardization of Spirometry, 1994 Update. American Thoracic Society. Am J Respir Crit Care Med. 1995;152(3):1107–1136. doi:10.1164/ajrccm.152.3.76637927663792
- HankinsonJL, EschenbacherB, TownsendM, StocksJ, QuanjerPH. Use of forced vital capacity and forced expiratory volume in 1 second quality criteria for determining a valid test. Eur Respir J. 2015;45(5):1283–1292. doi:10.1183/09031936.0011681425537554
- QuanjerPH, StanojevicS, ColeTJ, et al. Multi-ethnic reference values for spirometry for the 3–95 year age range: the global lung function 2012 equations: report of the Global Lung Function Initiative (GLI), ERS Task Force to establish improved lung function reference values. Eur Respir J. 2012;40(6):1324–1343. doi:10.1183/09031936.0008031222743675
- MahlerDA, WellsCK. Evaluation of clinical methods for rating dyspnea. Chest. 1988;93(3):580–586. doi:10.1378/chest.93.3.5803342669
- BroggerJC, BakkePS, GulsvikA. Comparison of respiratory symptoms questionnaires. Int J Tubercul Lung Dis. 2000;4(1):83–90.
- HolmenJ, MidthjellK, KrügerØ, et al. The Nord-Trøndelag Health Study 1995-97 (HUNT 2): objectives, contents, methods and participation. Norsk Epidemiol. 2003;13(1):19–32.
- Northern Norway Regional Health Authority: Centre for Clinical Documentation and Evaluation (SKDE). COPD healthcare atlas. 2018 Available from: https://helseatlas.no/sites/default/files/copd-healthcare-atlas.pdf. Accessed 103 2019.
- GrambschPM, TherneauTM. Proportional hazards tests and diagnostics based on weighted residuals. Biometrika. 1994;81(3):515–526. doi:10.1093/biomet/81.3.515
- BelsleyDA, KuhE, WelschRE. Regression Diagnostics: Identifying Influential Data and Sources of Collinearity. New York (N.Y.): Wiley; 1980.
- O’BrienRM. A caution regarding rules of thumb for variance inflation factors. Qual Quant. 2007;41(5):673–690. doi:10.1007/s11135-006-9018-6
- BozdoganH. Model selection and Akaike’s Information Criterion (AIC): the general theory and its analytical extensions. Psychometrika. 1987;52(3):345–370. doi:10.1007/BF2294361
- KamarudinAN, CoxT, Kolamunnage-DonaR. Time-dependent ROC curve analysis in medical research: current methods and applications. BMC Med Res Methodol. 2017;17(1):53. doi:10.1186/s12874-017-0332-628388943
- HeagertyPJ, ZhengY. Survival model predictive accuracy and ROC curves. Biometrics. 2005;61(1):92–105. doi:10.1111/biom.2005.61.issue-115737082
- SahaP, HeagertyPJ. Time-dependent predictive accuracy in the presence of competing risks. Biometrics. 2010;66(4):999–1011. doi:10.1111/j.1541-0420.2009.01375.x20070296
- MillerMR, PedersenOF. New concepts for expressing forced expiratory volume in 1 s arising from survival analysis. Eur Respir J. 2010;35(4):873–882. doi:10.1183/09031936.0002580919741033
- BansalA, HeagertyPJ. A tutorial on evaluating the time-varying discrimination accuracy of survival models used in dynamic decision making. Med Decis Making. 2018;38(8):904–916. doi:10.1177/0272989X1880131230319014
- Martínez-CamblorP, CorralN. A general bootstrap algorithm for hypothesis testing. J Stat Plan Inference. 2012;142(2):589–600. doi:10.1016/j.jspi.2011.09.003
- MenezesAM, WehrmeisterFC, Perez-PadillaR, et al. The PLATINO study: description of the distribution, stability, and mortality according to the global initiative for Chronic Obstructive Lung Disease classification from 2007 to 2017. Int J Chron Obstruct Pulmon Dis. 2017;12:1491–1501. doi:10.2147/COPD28553101
- MarcoaR, RodriguesDM, DiasM, et al. Classification of Chronic Obstructive Pulmonary Disease (COPD) according to the new Global Initiative for Chronic Obstructive Lung Disease (GOLD) 2017: comparison with GOLD 2011. Copd. 2018;15(1):21–26. doi:10.1080/15412555.2017.139428529161163
- Global Initiative for Chronic Obstructive Lung Disease. Global strategy for the diagnosis, management, and prevention of chronic obstructive pulmonary diesease. 2019 Available from: http://goldcopd.org/. Accessed 022 2019.
- MandrekarJN. Receiver operating characteristic curve in diagnostic test assessment. J Thor Oncol. 2010;5(9):1315–1316. doi:10.1097/JTO.0b013e3181ec173d