
Abstract
Background
Despite wide use of the Global Initiative for Chronic Obstructive Pulmonary Disease (GOLD) 2011, little is known about between-stage transitions and what factors predict worsening transitions in patients with chronic obstructive pulmonary disease (COPD).
Objective
To investigate the transition frequency between GOLD 2011 stages among patients with stable COPD over a 2-year follow-up, to identify potential non-pulmonary predictor factors for worsening transitions, and to compare transition frequencies between GOLD 2011 stages and the new GOLD 2017 stages.
Patients and Methods
We prospectively included 137 patients with stable COPD (mean age, 66.9 ± 8.3 years). GOLD 2011 and GOLD 2017 stages were measured at baseline, 1-year follow-up, and 2-year follow-up. To evaluate non-pulmonary variables as potential predictors of worsening transitions, we used regression models adjusted for sociodemographic, clinical, and pulmonary variables using generalized estimating equations.
Results
The study period included 246 opportunities for transition, and 39 worsening transitions occurred within GOLD 2011 stages. Predictors of worsening transitions included BODE index (OR, 1.20; 95% CI, 1.00–1.44), quadriceps strength (OR, 0.87; 95% CI, 0.76–0.99), and limited mobility activities (OR, 1.02; 95% CI, 1.00–1.05). The frequency of worsening transitions for stages B and C differed between GOLD 2011 and GOLD 2017. Stages A and D were the most stable in both classifications.
Conclusion
Non-pulmonary factors predicted worsening transitions among the GOLD 2011 stages of COPD severity. The choice of GOLD 2011 versus GOLD 2017 may influence transition identification, especially for stages B and C.
Introduction
Until 2011, chronic obstructive pulmonary disease (COPD) evaluation was primarily based on forced expiratory volume during the first second (FEV1). However, it has now been demonstrated that FEV1 is only a partial descriptor of this multisystemic disease, which does not reflect its complexity and effects beyond pulmonary function, including reductions of health status, physical performance, and functional status.Citation1–Citation3
In 2011, the Global Initiative for Chronic Obstructive Pulmonary Disease (GOLD) proposed a multidimensional assessment of the disease, in which patients with COPD are evaluated according to FEV1 value (expressed as a percentage of the predicted value), as well as individual history of previous exacerbations and symptoms, including dyspnea according to the modified Medical Research Council scale (mMRC), and health status based on the Chronic obstructive pulmonary disease Assessment Test (CAT).Citation4 Under the GOLD 2011 assessment, patients with COPD are classified into four severity stages (A–D). The distributions of these stages vary among different populations and studies, but generally range between 17.8% and 24% for group A, 14–37.9% for group B, 4.8–23% for group C, and 39.5–40% for group D.Citation2,Citation3,Citation5
Many epidemiological studies have examined the prevalence of GOLD 2011 stages; however, few studies have investigated the frequency of transitions between these stages,Citation2 or the prognostic factors associated with such transitions. In the few studies that have analyzed these transitions, the data indicate that patients in groups A and D remained stable during follow-up, while groups B and C exhibit greater temporal variability.Citation2 CAT score and BODE index have been identified as predisposing factors to transitions;Citation2 however, since this is demonstrated in only one study, additional investigations are needed to verify their prognostic ability. Moreover, that study only evaluated pulmonary and clinical factors; thus, the relevance of non-pulmonary factors (eg, peripheral muscle strength or physical performance) remains unknown. The identification of modifiable risk factors might be useful for developing interventions to reduce worsening GOLD transitions, and to improve a patient’s ability to cope with the consequences of COPD.Citation2
In the present study, we investigated the frequency of transitions between GOLD 2011 stages, and explored several non-pulmonary factors as possible predictors of worsening transitions, among patients with COPD over a 2-year follow-up. We also determined the frequency of transitions among the new GOLD 2017 stages, and compared these findings with the results using GOLD 2011 stages. Our hypothesis, based on the study by Soriano et alCitation6 was that the frequencies of transitions would differ between these classifications.
Patients and Methods
Study Design and Participants
For this longitudinal study, patients with COPD were prospectively recruited from an outpatient pulmonary service at Morales Meseguer Hospital, Murcia, Spain, in 2015. Patients were included if they had a diagnosis of COPD according to the GOLD recommendations,Citation4 stable stage, and age of between 40 and 80 years. Patients were excluded if they exhibited an unstable cardiac condition within 4 months of the start of the study, cognitive deterioration, or an inability to walk.
Over a 1-year period, a consecutive sample of eligible patients was identified on a rolling-basis, based on patient health examinations. The study was conducted in accordance with the Declaration of Helsinki. All study participants provided written informed consent, and the study protocol was approved by the Ethics Committee of Clinical Research of the General University Hospital (approval number: EST-35/13).
Measurements
Study data were obtained through patient interviews conducted by a pulmonologist at baseline (T0), 1-year follow-up (T1), and 2-year follow-up (T2). At baseline, we obtained data regarding sociodemographic, clinical, pulmonary, and non-pulmonary variables, as described elsewhere.Citation7 Briefly, the non-pulmonary variables included handgrip, quadriceps, and elbow strength that were assessed on the dominant side with a handgrip dynamometer (KERN MAP 80K1, KERN & Sohn GmbH 1) and hand-held dynamometer (HHD) (Nicholas Manual Muscle Tester, model 01160; Lafayette Instrument).Citation8 To measure quadriceps strength, participants stayed seated with knee flexed 70º and a break test was performed. For elbow and handgrip strength, participants stayed seated with their shoulder adducted 0º, elbow flexed 90º, and forearm in a neutral position.Citation8 Six-minute walk test (6MWT), the BODE index, the Short Physical Performance Battery (SPPB) and the self-reported mobility questionnaire were also measured.
Clinical and pulmonary variables included dyspnea, measured with the self-administered modified British Medical Research Council (mMRC);Citation9 perceived health status assessed by the COPD Assessment Test (CAT);Citation10 and depression, assessed by the depression subscale of the Hospital Anxiety and Depression Scale (HADS).Citation11 Pulmonary function was assessed with spirometry according to the American Thoracic Society guidelines.Citation12 The patient’s medical history was reviewed to determine smoking pack-years, current smoker status, the number of comorbidities measured using the Functional Comorbidity Index,Citation13 the number of exacerbations (moderate defined as use of corticosteroids and/or antibiotics; severe defined as requiring hospitalization), and the presence of heart disease. Follow-up interviews were required within 4 weeks of the due date.
Outcome Measure
We assessed patients using both the GOLD 2011 and GOLD 2017 stages. According to these GOLD versions, patients were classified into four groups with increasing severity from A to D.Citation4 A transition was defined as a change in the GOLD stage between one year and the next. These measures were not available if a participant dropped out or died before follow-up. Each annual transition was categorized according to the GOLD stage at baseline and at the end of the year—for example, a transition was termed D–B when the initial stage was D and the final stage B. Moreover, transitions were also categorized into two patterns: worsening (increased severity) or improving (decreased severity). Non-transitions were categorized a stable state.
Statistical Analysis
Using descriptive statistics, we summarized the baseline characteristics of the whole sample as mean and standard deviation (SD) for continuous variables, and number and percentage for categorical data. We also made comparisons between the GOLD 2011 stage groups (A–D) using the Pearson’s chi-square test, Kruskal–Wallis test (for non-normally distributed data), and one-way ANOVA test, based on the variable type and distribution. We calculated the absolute and relative frequencies of GOLD stages at baseline and at the 2-year follow-up, and of each category of annual transition and non-transition, using both GOLD 2011 and GOLD 2017.
To determine the effects of potential predictor variables, we applied generalized estimating equations to fit a repeated measures logistic regression with the dependent variable being the annual transitioning status to worsening transitions vs non-transitions and improving transitions according to GOLD 2011 stages. Several models were constructed for these analyses. Model 1 included each clinical and pulmonary variable, after adjustment for age, sex, and Body Mass Index (BMI). Model 2 was simultaneously adjusted for all significant (P < 0.05) clinical and pulmonary variables, as well as age, sex, and BMI. The final model included each non-pulmonary variable, adjusted for age, sex, BMI, and variables that were significant (P < 0.05) from model 2. Each model provided odds ratios for worsening transitions in the GOLD 2011 stages. All analyses were performed using the Statistical Package for the Social Sciences (SPSS) version 24.0 (IBM SPSS, Chicago, IL, USA).
For the sample size calculation, we selected the generalized estimating equation (GEE) approach. In accordance with PASS 2020 softwareCitation14 a sample of 116 subjects (each one scheduled to be measured 3 times) was established to achieve a power of 0.80 when using a two-sided Wald test from a GEE analysis to test at a significance level of 0.05. Missing values were assumed to occur completely at random. Using similar studies,Citation2 we assumed an autocorrelation of 0.5 between adjacent measurements of the GOLD stage within a subject. We also assumed that this autocorrelation adequately represents the autocorrelation pattern across our 3-assessment design.
Results
Participants
At baseline, this study included 137 patients with a mean age of 66.9 years. Within this cohort, 87.6% were male, and 29.9% were current smokers. Baseline COPD severity according to GOLD 2011 stages were distributed as 24 (17.5%) in stage A, 22 (16.1%) in stage B, 12 (8.8%) in stage C, and 79 (57.7%) in stage D. Analysis of variance revealed that some stage groups differed in the frequency of current smokers, level of dyspnea ≥2, and number of exacerbations ≥2, and in degree of handgrip strength, 6MWT, BODE index, SPPB, 5STS, and mobility activities with limitation ().
Table 1 Characteristics of the Study Population (n = 137), Grouped by GOLD 2011 Stage at Baseline*
During follow-up, 127 patients (92.7%) remained in the study at T1, and 119 (86.9%) remained at T2. Among patients lost to follow-up at T2, 6 (4.3%) died, 8 (5.8%) dropped out due to lung cancer, and 4 (2.9%) chose not to continue. No patients were removed due to unstable stage or exacerbation occurring close to a follow-up visit. The patients lost during follow-up did not significantly differ from those who continued throughout the study.
Rates and Probabilities of a Transition in the GOLD 2011
The 2-year follow-up included 246 annual opportunities for transition between GOLD 2011 stages: 44 were in GOLD stage A (23 between T0–T1, 21 T1–T2), 40 in B (21 between T0–T1, and 19 T1–T2), 27 in C (12 between T0–T1, and 15 T1–T2), and 135 in D (71 between T0–T1, and 64 T1–T2) (). Based on these opportunities for transition, we calculated the 1-year probability of transition between GOLD 2011 stages.
Figure 1 One-year probabilities of transition between different GOLD 2011 (A) and GOLD 2017 (B) stages during a 2-year follow-up. Circles represent a single state for the beginning of each 1-year period. Straight arrows represent the probability of changing to another stage; curved arrows represent continuing in the same stage for another 1-year period.
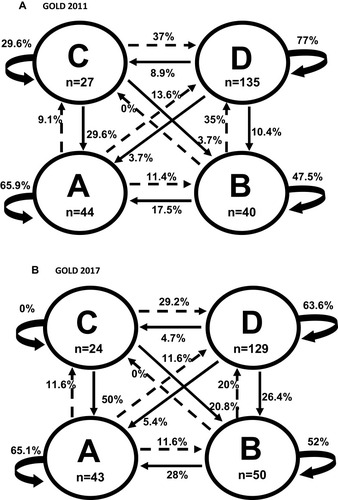
shows the percentages of non-transitions, ie, stable state, which varied among the groups. Stages A and D were more stable (65.9% and 77%, respectively) than stages B and C (47.5% and 29.6%, respectively). Stage A cases that worsened shows similar frequencies of worsening to each other stage (ranging between 9.1% and 13.6%). Stage D cases that improved showed similar frequencies of changing to stages B (10.4%) and C (8.9%), but a lower frequency of changing to stage A (3.7%).
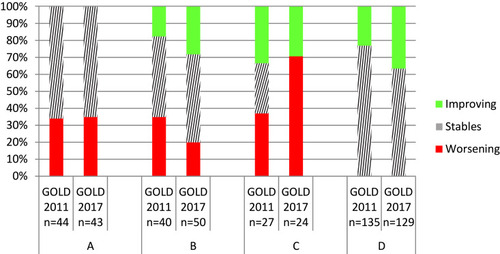
In total, including all four stages, we identified 39 worsening transitions, 47 improving transitions, and 160 non-transitions. The percentages of worsening transitions from initial stages of A, B, and C were very similar (34.1%, 35%, and 37%, respectively) (). We observed greater variability in the percentages of improving transitions from B, C, and D (17.5%, 33.4%, and 23%, respectively).
Figure 2 Percentages of non-transitions, improving transitions, and worsening transitions from each GOLD stage for each classification (GOLD 2011 and 2017).
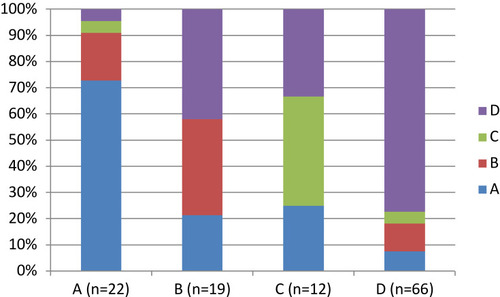
At the 2-year follow-up, the distribution of GOLD 2011 stages were 28 patients (23.5%) in A, 18 (15.1%) in B, 9 (7.6%) in C, and 64 (53.8%) in D. shows these frequencies according to the baseline stages. The majority of patients with baseline stages A and D remained in their original stage after two years, while patients with baseline stages B and C exhibited greater temporal variability.
Figure 3 Frequency of GOLD 2011 stages after two years according to baseline stages.
Predictors of Worsening Transitions in GOLD 2011 Stages
shows clinical and pulmonary predictor factors that may be associated with worsening transitions (vs improving transitions and non-transitions). Model 1 (including each clinical and pulmonary predictor, with adjustment for age, sex, and BMI) suggested that worsening transitions were positively associated with higher number of comorbidities, level of dyspnea ≥2, number of exacerbations ≥2, and higher CAT scores, and negatively associated with higher percentage FEV1. Model 2 (including all significant clinical and pulmonary variables from model 1, plus age, sex, and BMI) showed that participants with a number of exacerbations ≥2 had a greater probability of worsening transitions in the following year.
Table 2 Multivariate Regression Models Show the Predictive Strengths of Clinical and Pulmonary Factors for Worsening Transitions vs Improving Transitions and Non-Transitions in GOLD 2011 (N = 39, 1-Year Transitions)
shows each non-pulmonary factor that may be associated with worsening transitions, with adjustment for age, sex, BMI, and all the significant variables from model 2 (). Lower quadriceps strength, higher BODE index, and higher percentage of limited activities were independent predictors of worsening transitions in GOLD 2011 stages among COPD patients.
Table 3 Multivariate Regression Models Show the Predictive Strengths of Each One of Non-Pulmonary Factors with Worsening Transitions vs Improving Transitions and Non-Transitions in GOLD 2011 (N = 39 1-Year Transitions)
Comparison of Annual Transitions Between GOLD 2011 and GOLD 2017
When assigning GOLD 2017 stages, the distribution of stages at the 246 annual opportunities for transition was similar to that with GOLD 2011: 44 vs 43 in stage A, 40 vs 50 in stage B, 27 vs 24 in stage C, and 135 vs 129 in stage D ().
GOLD 2011 and GOLD 2017 also showed similar percentages of non-transitions from three of the four stages (A, B, and D) (), and similar percentages of annual improving transitions from stages B, C, and D (). However, GOLD 2011 and GOLD 2017 showed different percentages of transitions from stages D and C to other stages (). For example, compared to GOLD 2011, GOLD 2017 showed higher percentages of improving transitions from D to B (26.4% vs 10.4%), from C to A (50% vs 29.6%), and from C to B (20.8% vs 3.7%). The percentages of annual worsening transitions were similar between GOLD 2011 and GOLD 2017 only when starting from A stage. Compared to GOLD 2017, GOLD 2011 showed a higher percentage of worsening transitions from B stage (35% vs 20%), and a lower percentage of worsening transitions from C stage (37% vs 70.8%) (). However, GOLD 2011 and GOLD 2017 did not differ regarding the percentages of worsening transitions to other stages (), eg, around 30% from stage C to D, and 11.5% from stage A to B.
Discussion
In the present study, we primarily examined the likelihood that patients with COPD would experience annual transitions between GOLD 2011 stages, and evaluated predictors of worsening transitions. Our results showed that most patients in stages A and D remained in their initial stage, while patients in stages B and C showed greater numbers of transitions (ie, higher temporal variability) over 2 years. Nevertheless, the percentages of worsening transitions were similar across these groups. The most relevant predictors of worsening transitions were quadriceps strength, BODE index, and limitation of mobility activities.
The percentages of non-transitions from stages A and D, and of transitions from stages B and C, were similar to the percentages reported over one year by Casanova et al,Citation2 which also demonstrated greater variability for stage C and more stability for stage D. Those authors proposed that stage changes may be due to either disease progression or beneficial effects of therapy. Regardless, these data provide evidence regarding the degree of heterogeneity in the natural history of the disease, and may highlight a possible window of opportunity for intervention therapy.
When using GOLD 2011, our percentages of worsening transitions from stage A, and of improving transitions from stage D, were similar to the percentages previously reported by Casanova et al.Citation2 However, our percentages for transitions from stages B and C were different from the previous findings. Compared to our present results, Casanova et al observed a lower percentage of improving transitions from stage C to A, and a lower percentage of worsening transitions from stage B to D.Citation2 The overall percentages of worsening transitions from stages A and C were similar between our present results and those of Casanova et al;Citation2 however, their group observed lower percentages of worsening transitions from stage B than in our study. These differences may be related to differences between the two studies; compared to the study of Casanova et al,Citation2 our present study had a longer follow-up period (1 year vs 2 years, and a greater number of active smokers in stage B).
Our results showed that the BODE index was a predictor of worsening transitions, which is consistent with the findings of Casanova et al that the BODE index was associated with longitudinal changes in GOLD stages one year later.Citation2 Previous cross-sectional studies have also demonstrated associations between the BODE index and GOLD stages.Citation15,Citation16 Medinas-Amorós et al found a similar relationship between GOLD stages and the BODE index in an investigation of quality of life among COPD patients.Citation15 Hu et al found that patients in GOLD stage D had a higher BODE index score compared to patients with less severe disease.Citation16 These authorsCitation15,Citation16 suggested that their findings may be related to the extrapulmonary manifestations of COPD, such as decreased exercise capacity, malnutrition, anxiety, and depression, among others.
To our knowledge, this is the first longitudinal study to show that non-pulmonary aspects of COPD (eg, quadriceps weakness and limitation in mobility activities) can lead to worsening of GOLD stage severity. Previously, only cross-sectional studies have found association between these factors and the GOLD stage.Citation17,Citation18 Seymour et al reported that patients with a more severe GOLD stage exhibited greater weakness of the quadriceps compared to healthy subjects or patients with a less severe stage.Citation17 The predictive ability of quadriceps strength may be explained by the finding that skeletal musculature dysfunction leads to a sedentary lifestyle, and thus to de-conditioning of musculature in patients with more severe COPD.Citation19 Our study found no significant association between GOLD stages and elbow or handgrip strength, possibly because COPD-related muscle dysfunction more readily demonstrable in the lower extremities.Citation20
Ding et al previously found that patients in stages A and C had comparable levels of difficulty when performing mobility activities, while patients in stages B and D exhibited lower performance as measured with the Functional Performance Inventory-Short Form (FPI-SF) questionnaire, which is an approximate measure of the deterioration of several activities requiring physical effort.Citation18 These results are comparable to our present findings in the sense that patients with a higher percentage of limited mobility activities were more likely to have a more severe GOLD stage. This suggests that the difficulty in performing activities may be related to the level of symptoms patients experience, as well as the presence of exacerbations.Citation18
Our study was not the first to analyze changes between GOLD 2011 stages over two years. Previously, Agustí et al investigated the temporal stability of the four stages of GOLD 2011.Citation3 Both our results and theirs indicated that the majority of patients in stages A and D remained in their original stage, while those in stages B and C exhibited greater temporal variability.Citation3
Another important finding of our study was that the GOLD 2011 and GOLD 2017 classifications identified different percentages of transitions among the same patients. The most relevant differences were found in the worsening transitions from stages B and C, and the non-transitions from stage C. Compared to GOLD 2017, GOLD 2011 identified a higher percentage of worsening transitions from stage B, and a lower percentage of worsening transitions from stage C. These results cannot be compared with previous studies. While previous studies have compared clinical characteristics of patients with COPD in both GOLD 2011 and GOLD 2017Citation16,Citation21-24 to our knowledge, none have compared the transitions.
Our results regarding the transitions with GOLD 2017 can only be compared with the findings of Soriano et al, who examined transitions over five years.Citation6 Compared with their results, we found similar percentages of non-transitions for stages A, B, and D. In contrast, for stage C, Soriano et al observed more non-transitions than in our study,Citation6 while we found higher percentages of worsening transitions from stage C to D. Compared to their study, we also found lower percentages of improving transitions from stage D to stages A and B.
Implications for Practice and Research
In addition to impaired lung function and respiratory symptoms, COPD involves a series of extrapulmonary manifestations.Citation16 Here we found that quadriceps strength, BODE index, and limitations of mobility activities were predictors of worsening transitions in GOLD 2011 stage. These factors are potentially modifiable, and may be improved by physical rehabilitation programs for patients with stable COPD.Citation25,Citation26 Our results suggest that the existing evaluation model through GOLD could be improved by the incorporation of non-pulmonary aspects, which would enable a more thorough evaluation of potential deficits, some of which may be improved to help patients improve or maintain their level of severity.
In our study, the tested predictive factors were only measured at baseline. A future more longitudinal analysis might be able to evaluate whether associations between non-pulmonary factors (eg, quadriceps strength, mobility activities, and BODE index) can also be observed in individual patients over time. Such analysis might reveal whether there is a synchronous association between changes in GOLD and changes in non-pulmonary factors, or whether changes in GOLD stage might be influenced by changes in non-pulmonary factors. Additional research is also needed to determine whether the identified non-pulmonary risk factors can predict worsening transitions when using the GOLD 2017 classification system.
Strengths and Limitations
This study has several strengths. First, it was a longitudinal study, which has the main advantage of allowing analysis of changes in individual patients. This study design also allows measurement of the prevalence of GOLD groups at multiple time-points. Our evaluation of data from the three combined time-points could also have provided a more realistic estimate of the prevalence, possibly strengthening our results. Second, our models included a wide variety of previously identified non-pulmonary factors related to COPD, which had not previously been analyzed in relation to GOLD stages. Notably, the GOLD classification is a widely used and previously validated instrument, which allows classifying subjects in a standardized way, and comparisons with other studies that have used standardized validated instruments.
Our study also has several limitations. First, although our model included a wide variety of possible predictive factors of GOLD stage, there may be additional factors that could have improved its predictive power (eg, the quantity of drugs regularly taken, participation in rehabilitation programs, etc.).Citation27,Citation28 Additionally, although many of our predictive factors may vary over time, only baseline values were available. Therefore, all covariates in our models were time-independent. Second, although measurements were acquired at three time-points (once per year) to determine the course of GOLD stages over time, it is likely that additional transitions occurred between these time-points; However, the three measurement time-points were specifically chosen to obtain optimal detection of possible changes in GOLD stage. Although little is known about the patterns of GOLD stage transitions, we assumed that most changes occurred annually,Citation3 and we expected that most of these changes would occur in the first year, as previously described.Citation2 Third, regarding the results of predictors of worsening transitions, our cohort included a wide range of disease severities, but stages A, B and C had less representation in comparison with stage D. Therefore, we must be cautious especially with those changes in these stages, requiring more research. Nevertheless, it seems that these stages behave consistently with other studies in relation to prevalence.Citation2 Fourth, due to the fact that the patients were from a single hospital the cohort might not represent the true distribution of COPD severity in the general population. Finally, the population predominantly consisted of males patients; hence, our results in women should be interpreted cautiously since some of the cardiovascular comorbidities are more prevalent in men that in women.
Conclusion
Our present results demonstrated that non-pulmonary factors were relevant predictors of worsening transitions in COPD severity stages when using the GOLD 2011 classification system. We further found that the choice GOLD 2011 versus 2017 may influence the identification of transitions, especially from stages B and C. Over two years, patients with baseline stages A and D were more stable, while baseline stages B and C showed greater variability.
Disclosure
The authors report no conflicts of interest in this work.
Acknowledgments
The authors wish to thank their patients, and the personnel of the hospital unit, for their cooperation during the course of this study. The study was supported by medical manager of AstraZeneca Pharmaceutical Spain, S.A. and Maite Pérez Hernández.
References
- EisnerMD, BlancPD, YelinEH, et al. COPD as a systemic disease: impact on physical functional limitations. Am J Med. 2008;121(9):789–796. doi:10.1016/j.amjmed.2008.04.03018724969
- CasanovaC, MarinJM, Martinez-GonzalezC, et al. New GOLD classification: longitudinal data on group assignment. Respir Res. 2014;15(1):3. doi:10.1186/1465-9921-15-324417879
- AgustiA, EdwardsLD, CelliB, et al. Characteristics, stability and outcomes of the 2011 GOLD COPD groups in the ECLIPSE cohort. Eur Respir J. 2013;42(3):636–646. doi:10.1183/09031936.0019521223766334
- Global Initiative for Chronic Obstructive Lung Disease (GOLD) [homepage on the Internet]. Global strategy for the diagnosis, management and prevention of COPD, Global Initiative for Chronic Obstructive Lung Disease (GOLD) 2017 Available from: http://www.goldcopd.org/. Accessed 611, 2019.
- LeLAK, JohannessenA, HardieJA, et al. Prevalence and prognostic ability of the GOLD 2017 classification compared to the GOLD 2011 classification in a Norwegian COPD cohort. Int J Chron Obstruct Pulmon Dis. 2019;14:1639–1655.31413559
- SorianoJB, HahslerM, SorianoC, et al. Temporal transitions in COPD severity stages within the GOLD 2017 classification system. Respir Med. 2018;142:81–85. doi:10.1016/j.rmed.2018.07.01930170807
- Medina-MirapeixF, Bernabeu-MoraR, Sánchez-MartínezMP, et al. Mobility limitations related to reduced pulmonary function among aging people with chronic obstructive pulmonary disease. PLoS One. 2018;13(5):e0196152. doi:10.1371/journal.pone.019615229715295
- O’SheaSD, TaylorNF, ParatzJ. Measuring muscle strength for people with chronic obstructive pulmonary disease: retest reliability of hand-held dynamometry. Arch Phys Med Rehabil. 2007;88(1):32–36. doi:10.1016/j.apmr.2006.10.00217207672
- MahlerD, WellsC. Evaluation of clinical methods for rating dyspnea. Chest. 1988;93(3):580–586. doi:10.1378/chest.93.3.5803342669
- JonesPW, HardingG, BerryP, WiklundI, ChenWH, Kline LeidyN. Development and first validation of the COPD assessment test. Eur Respir J. 2009;34:648–654. doi:10.1183/09031936.0010250919720809
- HerreroMJ, BlanchJ, PeriJM, et al. A validation study of the hospital anxiety and depression scale (HADS) in a Spanish population. Gen Hosp Psychiatry. 2003;25(4):277–283. doi:10.1016/S0163-8343(03)00043-412850660
- HankinsonJL, OdencrantzJR, FedanKB. Spirometric reference values from a sample of the general U. S Population Am J Respir Crit Care Med. 1999;159:179–187. doi:10.1164/ajrccm.159.1.97121089872837
- KabboordAD, Van EijkM, Van DingenenL, et al. Reliability and usability of a weighted version of the functional comorbidity index. Clin Interv Aging. 2019;11(14):289–299.
- HintzeJ. PASS 2020, V20.0.1 [Computer Software]. Kaysville, Utah: Number Cruncher Statistical Software; 2020.
- Medinas AmorósM, Mas-TousC, Renom-SotorraF, et al. Health-related quality of life is associated with COPD severity: a comparison between the GOLD staging and the BODE index. Chron Respir Dis. 2009;6:75–80. doi:10.1177/147997230810155119411567
- HuYH, LiangZY, XuLM, et al. Comparison of the clinical characteristics and comprehensive assessments of the 2011 and 2017 GOLD classifications for patients with COPD in China. Int J Chron Obstruct Pulmon Dis. 2018;13:3011–3019. doi:10.2147/COPD.S17466830319249
- SeymourJM, SpruitMA, HopkinsonNS, et al. The prevalence of quadriceps weakness in COPD and the relationship with disease severity. Eur Respir J. 2010;36(1):81–88. doi:10.1183/09031936.0010490919897554
- DingB, JudgeD, SmallM, et al. Functional performance in patients with COPD: association with treatment regimen, GOLD group, lung function, and symptom burden in a cross-sectional study. Int J Chron Obstruct Pulmon Dis. 2018;13:2785–2796. doi:10.2147/COPD.S17039130233169
- PolkeyMI, MoxhamJ. Attacking the disease spiral in chronic obstructive pulmonary disease. Clin Med. 2006;6:190–196. doi:10.7861/clinmedicine.6-2-190
- ManWD, SolimanMG, NikoletouD, et al. Non-volitional assessment of skeletal muscle strength in patients with chronic obstructive pulmonary disease. Thorax. 2003;58(8):665–669. doi:10.1136/thorax.58.8.66512885979
- SongJH, LeeCH, UmSJ, et al. Clinical impacts of the classification by 2017 GOLD guideline comparing previous ones on outcomes of COPD in real-world cohorts. Int J Chron Obstruct Pulmon Dis. 2018;13:3473–3484. doi:10.2147/COPD.S17723830498337
- MenezesAM, WehrmeisterFC, Perez-PadillaR, et al. The PLATINO study: description of the distribution, stability, and mortality according to the Global Initiative for Chronic Obstructive Lung Disease classification from 2007 to 2017. Int J Chron Obstruct Pulmon Dis. 2017;12:1491–1501. doi:10.2147/COPD.S13602328553101
- Cabrera LópezC, Casanova MacarioC, Marín TrigoJM, et al. Comparison of the 2017 and 2015 Global Initiative for Chronic Obstructive Lung Disease Reports. Am J Respir Crit Care Med. 2018;197(4):463–469. doi:10.1164/rccm.201707-1363OC29099607
- BikovA, HorváthA, TomisaG, BártfaiL, BártfaiZ. Changes in the Burden of comorbidities in patients with COPD and Asthma–COPD overlap according to the GOLD 2017 recommendations. Lung. 2018;196(5):591–599. doi:10.1007/s00408-018-0141-730008015
- GriffithsTL, BurrML, CampbellIA, et al. Results at 1 year of outpatient multidisciplinary pulmonary rehabilitation: a randomised controlled trial. Lancet. 2000;355(9201):362–368. doi:10.1016/S0140-6736(99)07042-710665556
- WedzichaJA, BestallJC, GarrodR, et al. Randomized controlled trial of pulmonary rehabilitation in severe chronic obstructive pulmonary disease patients, stratified with the MRC dyspnoea scale. Eur Respir J. 1998;12:363–369. doi:10.1183/09031936.98.120203639727786
- O’DonnellDE, HernandezP, KaplanA, et al. Canadian thoracic society recommendations for management of chronic obstructive pulmonary disease - 2008 update - highlights for primary care. Can Respir J. 2008;15 Suppl A:1A–8A. doi:10.1155/2008/641965
- DoddJW, HoggL, NolanJ, et al. The COPD assessment test (CAT): response to pulmonary rehabilitation. A multicentre, prospective study. Thorax. 2011;66(5):425–429. doi:10.1136/thx.2010.15637221398686