
Abstract
Background
We sought to determine whether circulating inflammatory biomarkers were associated with the frequent exacerbator phenotype in stable COPD patients ie, those with two or more exacerbations in the previous year.
Methods
Eighty-eight stable, severe, COPD patients (4 females) were assessed for exacerbation frequency, pulmonary function, fraction of expired nitric oxide (FENO); inflammatory variables were measured in venous blood. Logistic regression assessed associations between the frequent exacerbator phenotype and systemic inflammation.
Results
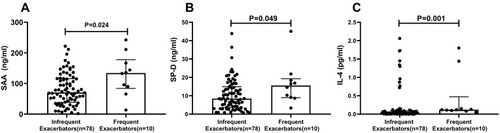
Compared with infrequent exacerbators, frequent exacerbators (n=10; 11.4%) had greater serum concentration (median (25th-75th quartile)) of serum amyloid A (SAA; 134 (84–178) vs 71 (38–116) ng/mL; P=0.024), surfactant protein D (SP-D; 15.6 (9.0–19.3) vs 8.5 (3.6–14.9) ng/mL; P=0.049) and interleukin-4 (IL-4; 0.12 (0.08–1.44) vs 0.03 (0.01–0.10) pg/mL; P=0.001). SAA, SP-D and IL-4 were not significantly correlated with FEV1%predicted or FVC %predicted. After adjusting for sex, age, BMI, FEV1/FVC and smoking pack-years, only SAA remained independently associated with the frequent exacerbator phenotype (OR 1.49[1.09–2.04]; P=0.012). The odds of being a frequent exacerbator was 18-times greater in the highest SAA quartile (≥124.1 ng/mL) than the lowest SAA quartile (≤44.1 ng/mL) (OR 18.34[1.30–258.81]; P=0.031), and there was a significant positive trend of increasing OR with increasing SAA quartile (P=0.008). For SAA, the area under the receiver operating characteristic curve was 0.721 for identification of frequent exacerbators; an SAA cut-off of 87.0 ng/mL yielded an 80% sensitivity and 61.5% specificity.
Conclusion
In stable COPD patients, SAA was independently associated with the frequent exacerbator phenotype, suggesting that SAA may be a useful serum biomarker to inform progression or management in COPD.
Background
Chronic obstructive pulmonary disease (COPD) is characterized by both an accelerated decline in lung function and periods of acute deterioration in symptoms, termed exacerbations. Exacerbations of respiratory symptoms in COPD are of major importance in terms of their prolonged detrimental effects on patients.Citation1 Frequent exacerbations contribute to long-term decline in lung function as well as to increased morbidity, decreased quality of life, and increased mortality of patients with moderate to severe COPD.Citation2–Citation4 Some patients experience frequent exacerbations, and form a distinct clinical subgroup, the ‘frequent exacerbator’ phenotype, in contrast to patients who experience few exacerbations over time.Citation5 The frequent exacerbator phenotype is recognized as a major phenotype in patients with COPD and occurs across disease severities.Citation5
Exacerbations are typically caused by respiratory tract infections.Citation6 During an acute exacerbation episode, the existing airway and systemic inflammation increase further.Citation7–Citation9 Inflammatory mediators, cytokines and chemokines are released into the circulation and induce recruitment of inflammatory cells into the lung parenchyma. Besides local damage to lung structures, activation of immune cells causes systemic inflammation with increases in acute phase proteins such as fibrinogen and C-reactive protein (CRP).Citation7,Citation10 The airways of frequent exacerbators are more inflamed than those with infrequent exacerbations, and frequent exacerbators have greater concentration of sputum interleukin-6 (IL-6) and −8 (IL-8).Citation11 In addition, during the exacerbation recovery period, sputum IL-6 and serum CRP are greater in the frequent exacerbator phenotype,Citation12 consistent with their greater baseline inflammatory state. In the post-exacerbation recovery period, greater serum concentration of inflammatory mediators, such as CRP, are associated with a shorter time until the next exacerbation.Citation12 As a result, CRP has been proposed as a predictive biomarker for COPD exacerbation.Citation13
Similar to CRP, serum amyloid A (SAA) is an acute phase inflammatory biomarker, and is strongly associated with COPD exacerbations.Citation14 Bozinovski et alCitation14 studied stable and exacerbating COPD patients, and found that SAA was four-fold greater in patients experiencing a severe acute COPD exacerbation. They also identified that the increase in SAA was a more sensitive indicator of acute COPD exacerbation than CRP alone or in combination with dyspnea.Citation14
SAA is a family of proteins that form a major component of the acute-phase inflammatory response and, like CRP, is synthesized mainly in the liver in response to infection, inflammation, injury, or stress.Citation15 Considering that SAA is a sensitive marker of an acute inflammatory state, we aimed to determine the association between the frequent exacerbator phenotype of COPD and SAA concentration in the stable state of COPD. We hypothesized that greater SAA is associated with the frequent exacerbator phenotype in COPD and that the relationship is stronger than for other markers of inflammation.
Methods
Patient Population
This cross-sectional study was conducted at the First Affiliated Hospital of Guangzhou Medical University. Patients with severe to very severe COPD (GOLD [Global Initiative for Chronic Obstructive Lung Disease] spirometry stages 3–4),Citation16 were recruited during their stable state. Exclusion criteria included a COPD exacerbation within the previous 4 weeks, lung cancer, bronchiectasis, pneumoconiosis or other restrictive ventilatory dysfunction and chronic systemic inflammatory conditions. Information collected included medical and smoking history, exacerbation frequency, pulmonary function and fraction of expired nitric oxide (FENO). Venous blood was collected and serum was assessed for inflammatory variables. The study protocol was approved by the Medical Ethics Review Committee of the First Affiliated Hospital of Guangzhou Medical University and all subjects provided written informed consent. The study was conducted in accordance with the principles of the Declaration of Helsinki, except for prospective public trial registration.
Subgroups
Moderate and severe exacerbations were captured by a review of medical records. Moderate exacerbations were defined as an acute worsening of respiratory symptoms treated by antibiotics and/or oral steroids and severe exacerbations as a worsening of respiratory symptoms requiring hospitalization or emergency room visit.Citation16 Frequent exacerbations were defined as two or more exacerbations in the previous year.Citation16,Citation17 Subjects were divided into two groups: 1) “frequent exacerbators”, who experienced two or more moderate or severe exacerbations in the 12 months prior to study enrollment; 2) “infrequent exacerbators”, who had one or no exacerbations in the 12 months prior to study enrollment.
Blood Sampling and Measurement of Inflammatory Markers
Venous blood samples were collected from subjects by venipuncture in plain tubes. The samples were centrifuged immediately at 2500 rpm for 15 minutes at room temperature and the serum fraction was collected and frozen at −80°C pending subsequent procedures. The concentration of SAA (R&D, #DY3019-05), SP-D (R&D, #DSFPD0), PRG4 (SAB, #EK2481), LTB4 (Abcam, #ab133040), MMP-8 (R&D, #DMP800), MMP-9 (Bioscience, #85-BMS2016-2) were measured in the serum by an enzyme-linked immunosorbent assay (ELISA). The concentration of GM-CSF, IL-1β, IL-4, IL-6 and IL-8 were measured using human cytokine V-PLEX validated immunoassay kit (Meso Scale Discovery, Gaithersburg, MD). Blood cell counts were made using a hematological analyzer (DxH 800, Beckman Coulter, California, United States). All the measurements were performed in duplicate. The average of each variable is reported.
Pulmonary Function Testing
Spirometry was performed by using a portable spirometer (Carefusion MasterScreen Pneumo, Germany) before, and 20 minutes after, inhalation of 400μg of short-acting β2-agonist (albuterol) in accordance with the ERS/ATS recommendations.Citation18 Spirometric data were reviewed and graded by a quality control software (Sentrysuite V.2.3). Predicted values were calculated according to the use of the reference values from the European Coal and Steel Community (1993) and the application of conversion factors for Chinese adults (male: 0.95, female: 0.93).Citation19
Fractional Exhaled Nitric Oxide (FENO)
FENO was measured by using the NIOX system (NioxMino® ENO analyzer, Aerocrine, Sweden) in accordance with ATS/ERS recommendations.Citation20 FENO was measured before spirometry and measured three times, with differences ≤10% indicating acceptable variance. The mean value of three measurements is reported.
Statistical Analysis
Data were expressed as mean ± standard deviation (SD) or median (25th-75th quartiles) or as percentage. Univariate analyses included independent-samples Student’s t or Mann–Whitney test for continuous variables or chi-square test or Fisher’s exact test for categorical variables between two groups, as appropriate. SAA concentration was divided in quartiles. Relationships among frequent exacerbator phenotype (dependent variable) and clinical data, spirometric values, inflammatory variables and SAA (square root (sqrt) transformed) (independent variables) were assessed by logistic regression. A multivariable logistic regression model was adjusted for age, sex, smoking pack-years, body mass index and FEV1/FVC. The trend for linearity between the odds ratio (OR) and SAA quartiles was estimated by logistic regression including the median of each SAA quartile as a continuous variable. The optimal SAA cut-off point (highest sum of sensitivity and specificity) to identify frequent exacerbators was selected using receiver operating characteristic (ROC) analysis. Correlations between inflammatory variables and pulmonary function were assessed by Spearman correlation. All statistical analyses were performed using SPSS (IBM SPSS V.25.0, Armonk, NY, USA). Statistical significance was set at P<0.05. Figures were created using GraphPad Software (GraphPad Prism V.8.0 for Windows, San Diego, California USA).
Results
Patient Characteristics
A total of 88 patients were enrolled. Patient characteristics are shown in . Overall, the group was predominantly male (96%), aged 64±7 years with severe or very severe COPD (FEV1 38±9%predicted). Ten (11.4%) patients were frequent exacerbators (3 (2–4) exacerbations in the previous 12 months), while 78 (88.6%) were infrequent exacerbators (0 (0–1) exacerbations in the previous 12 months). Frequent exacerbators had a significantly greater CAT score (13 (9–16) vs 9 (6–12); P=0.028), greater mMRC dyspnea scale (2 (1–3) vs 1 (1–2); P=0.001), a lower post-bronchodilator (BD) FVC (2.01±0.40 vs 2.66±0.60 L; P=0.001), and lower post-BD FVC %predicted (58.3±10.9 vs 75.9±15.8%predicted; P=0.001). There was no significant difference between the two groups in age, sex, BMI, current smoker status, smoking pack-years, post-BD FEV1, post-BD FEV1%predicted or post-BD FEV1/FVC. There was no significant difference between the two groups in total white cell count, or count or percentage of neutrophils and eosinophils ().
Table 1 Patient Characteristics
Inflammatory Variables in Groups Based on Exacerbation Frequency
SAA was significantly greater in frequent exacerbators compared to infrequent exacerbators (P=0.024) (; ). Similarly, SP-D (P=0.049; ) and IL-4 (P=0.001; ) concentrations were significantly greater in frequent exacerbators compared to infrequent exacerbators (). There was no significant difference between the two groups in other inflammatory variables including IL-1β, IL-6, IL-8, CRP, LTB4, GM-CSF, FENO, MMP8, MMP9 and PRG4 ().
Table 2 Inflammatory Variables in Groups Based on Exacerbation Frequency
Figure 1 Comparison of SAA, SP-D and IL-4 concentration between frequent exacerbators and infrequent exacerbators. Frequent exacerbators (n=10) are defined as patients with 2 or more exacerbations in the previous year. Infrequent exacerbators (n=78) are defined as patients with 1 or none exacerbations in the previous year. (A) SAA concentration. (B) SP-D concentration. (C) IL-4 concentration. Statistical comparisons by Mann–Whitney test.
Correlations Between SAA, SP-D, IL-4 and Pulmonary Function
shows Spearman correlation between SAA, SP-D, IL-4 and spirometric measures of pulmonary function. For these three inflammatory markers, there was no significant correlation with post-BD FVC %predicted, post-BD FEV1%predicted, and post-BD FEV1/FVC ().
Table 3 The Correlation Between SAA, SP-D, IL-4 and Pulmonary Function
Association Between SAA and Frequent Exacerbations
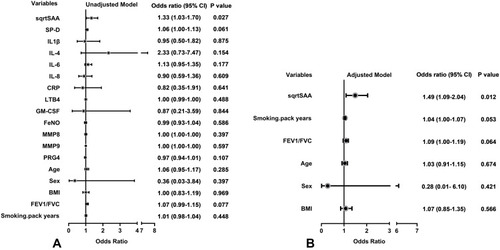
In the univariate logistic regression models, SAA was significantly associated with frequent exacerbator status (OR 1.33; 95% CI 1.03–1.70; P=0.027). SP-D, IL-4 and other inflammatory variables including IL-1β, IL-6, IL-8, CRP, LTB4, GM-CSF, FENO, MMP8, MMP9, PRG4 were not significantly associated with frequent exacerbator status (). In the multivariable logistic regression model, adjusting for sex, age, BMI, Post-BD FEV1/FVC and smoking pack-years, SAA was independently associated with the frequent exacerbator phenotype (OR 1.49; 95% CI 1.09–2.04; P=0.012) ().
Figure 2 Odds ratio for variables associated with the frequent exacerbator phenotype. (A) Univariate logistic regression models. (B) Multivariable logistic regression model adjusting for sex, age, BMI, FEV1/FVC and smoking pack-years. SAA was square root (sqrt) transformed to normalize its distribution.
Associations Between SAA Quartiles and Frequent Exacerbations
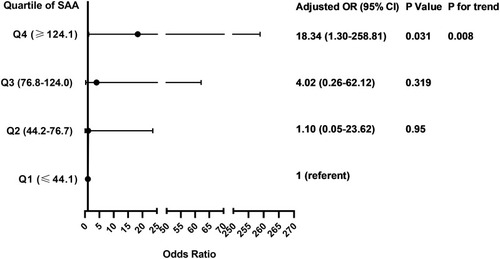
The odds ratio for the association of frequent exacerbator status with quartiles of SAA concentration is presented in . After adjusting for sex, age, BMI, Post-BD FEV1/FVC and smoking pack-years, the hazard of frequent exacerbator status in the highest SAA quartile (≥124.1 ng/mL) was 18 times that of the lowest SAA quartile (≤44.1 ng/mL) (OR 18.34; 95% CI 1.30–258.81; P=0.031). In categorical analysis, we found that a significant linear association between the OR for frequent exacerbator status and increasing SAA quartile (P value for trend=0.008) ().
Figure 3 Associations between SAA quartiles and the frequent exacerbator phenotype. Multivariable logistic regression model adjusting for sex, age, BMI, FEV1/FVC and smoking pack-years. SAA concentration was divided in quartiles: Q1, ≤44.1 ng/mL; Q2, 44.2–76.7 ng/mL; Q3, 76.8–124.0 ng/mL; Q4, ≤124.1 ng/mL. Linear association between OR and SAA quartile was assessed by P for trend using logistic regression model including the median of each SAA quartile as a continuous variable.
Sensitivity and Specificity of SAA to Identify the Frequent Exacerbator Phenotype
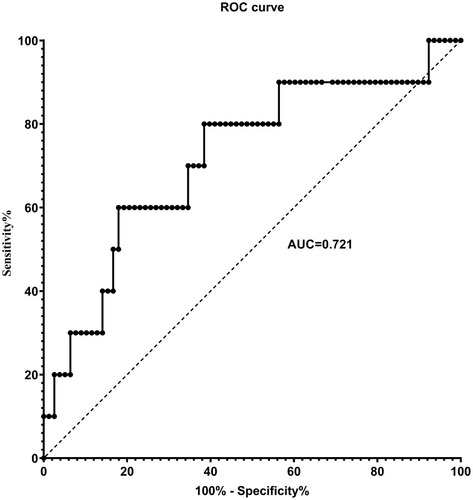
In ROC analysis, yielded an area under the curve (AUC) of 0.721 (95% CI 0.542–0.899) for the identification of frequent exacerbators. The greatest sum of sensitivity and specificity (1.421) was an SAA of 131.7 ng/mL, corresponding to a sensitivity of 60.0% and specificity of 82.1% (). However, choosing to increase test sensitivity (at least 80.0%) did not meaningfully reduce the sum (1.415) and resulted in an SAA of 87.0 ng/mL corresponding to a sensitivity of 80.0% and specificity of 61.5%.
Figure 4 Receiver operating characteristic (ROC) for identification of the frequent exacerbator phenotype by serum amyloid A (SAA). ROC analysis yielded an area under the curve (AUC) of 0.721 (95% CI 0.542–0.899) for the identification of frequent exacerbators. The greatest sum of sensitivity and specificity occurred at SAA = 131.7 ng/mL. Selection of a higher specificity (at least 80%) did not meaningfully reduce the sum and resulted in SAA = 87.0 ng/mL to separate frequent and infrequent exacerbators, corresponding to a sensitivity of 80.0% and specificity of 61.5%.
Discussion
The principal finding of this study was that the serum concentrations of SAA, SP-D and IL-4 were greater in COPD patients who experienced 2 or more exacerbations in the preceding year compared with those who did not. In addition, SAA, but not the other inflammatory biomarkers, was significantly associated with the frequent exacerbator phenotype after adjusting for potential covariates and was independent of spirometric measures of pulmonary impairment and total eosinophil counts or percentage. We also found that the risk of frequent exacerbator status in the highest SAA quartile was 18 times of those in the lowest quartile, suggesting that SAA might be a good indicator of the frequent exacerbator phenotype in COPD. ROC analysis identified SAA = 87.0 ng/mL as providing 80% sensitivity to separate infrequent from frequent exacerbators. Although the inflammatory biomarker SAA is known to be raised during an acute COPD exacerbation,Citation14 this is the first study to our knowledge to demonstrate an association of SAA with the frequent exacerbator phenotype in stable phase of COPD. This observational study cohort contained ~10% frequent exacerbators, which is reflective of the incidence expected in clinical practice. Further research is needed to validate these findings in an independent cohort. Nevertheless, these data show that SAA may be a useful and sensitive biomarker to identify patients at risk of frequent exacerbations, to inform progression and to guide management of COPD.
Investigators have long sought a circulating biomarker that separates non-exacerbators from exacerbators. In the ECLIPSE trial, 2138 COPD patients were followed for three years to determine predictors of exacerbations. None of the measured circulating biomarkers were independent predictors of exacerbation frequency. More recently, Gulati and colleagues reported a greater concentration of fibroblast growth factor 23 (FGF23) in frequent exacerbators compared with patients without frequent exacerbations.Citation21 In addition, these investigators showed that FGF23 is independently associated with frequent exacerbations, after adjusting for age, lung function, smoking and oxygen use.Citation21
Previous studies showed that SAA is dramatically increased during acute phase of a COPD exacerbation, and that SAA is a sensitive biomarker for exacerbation severity in COPD patients.Citation14 Other studies showed increased circulating SAA concentration in COPD and other pulmonary diseases such as idiopathic pulmonary fibrosis (IPF).Citation22–Citation24 Formiga et al reported that inspiratory muscle performance was considerably lower in COPD patients with greater SAA concentration.Citation23 In addition, SAA was greater in patients with IPF than in healthy controls.Citation22 Furthermore, serum levels of SAA and CRP together with other inflammatory markers (eg, IL-6, IL-8, TNF-a, IP-10) were significantly greater in COPD patients experiencing an exacerbation than during remission and in healthy control subjects.Citation24
Elevated SAA was reported in patients with cardiovascular disease where COPD was a comorbidity.Citation25 Since half of the deaths in COPD are associated with cardiovascular events, and the incidence of these events increases dramatically after each exacerbation,Citation26,Citation27 and also because SAA is a good predictor of coronary artery disease as well as future cardiovascular events, SAA might be considered as a potential indicator of frequent exacerbation phenotype as well as an indicator of comorbid cardiovascular disease.
As well as acting as a biomarker for the frequent exacerbator phenotype during the stable phase of COPD, evidence suggests that SAA may mediate an acute COPD exacerbation.Citation14 SAA induces lung inflammation in COPD by promoting lung neutrophilia, which is activated by increasing expression of IL-17a in γδT cells.Citation28 In addition, SAA activates the NLRP3 inflammasome and elicits robust TLR2-, MyD88-, and IL-1-dependent pulmonary inflammation.Citation29 Consistent with this, SAA is found in the lungs and bronchoalveolar lavage fluid of smoke exposed COPD patients and endotoxin-challenged mice.Citation30,Citation31
In stable COPD patients, we also showed that the circulating concentration of SP-D was greater in frequent exacerbators compared to infrequent exacerbators, although SP-D was not independently associated with exacerbation. Although no previous study compared the serum concentration of SP-D between frequent and infrequent exacerbators, the ECLIPSE study showed that SP-D significantly, although weakly, predicted exacerbation during the first year of follow-up.Citation17 SP-D is mainly produced by type II alveolar cells in the lung,Citation32 and is involved in regulating pulmonary surfactants, lipid homeostasis and innate immunity in order to protect the lungs from pathogens.Citation33–Citation35 SP-D has many protective properties including anti-inflammatory and anti-oxidant functionsCitation34 that associate with protection against the development of COPD.Citation36 SP-D knockout mice have large lungs with enlarged airspaces and activated macrophages; they develop progressive pulmonary emphysema and subpleural fibrosis in association with chronic inflammation.Citation37 In this study, we did not have chest-CT or diffusing capacity measures to identify whether the greater SP-D in frequent exacerbators was associated with greater pulmonary emphysema, although this might be expected.
A major role of SP-D is to regulate antibody-independent immune responses against invading microorganisms.Citation38 Indeed, SP-D deficient mice are more susceptible to respiratory infections with Pneumocystis carinii, influenza, respiratory syncytial virus, and bacteria.Citation39–Citation42 This is consistent with the observation that COPD patients with serum SP-D concentration greater than the 95th percentile of nonsmokers had an increased risk of exacerbation over the following 12 months.Citation43
Our results showed no significant correlation between serum SP-D and spirometric lung function (FEV1%pred, FVC%pred, FEV1/FVC), which is consistent with several other studies.Citation43 The interpretation of association of serum SP-D and lung function is complicated in that serum SP-D is affected not only by lung synthesis, but also by increased leakage of SP-D from the COPD lung into the systemic circulation.Citation36 Nevertheless, in our study, SP-D was not as strongly (or independently) associated with the frequent exacerbator phenotype as SAA.
We also found serum IL-4 was significantly greater in frequent exacerbators, but regression analysis showed no significant independent correlation between IL-4 and exacerbator phenotype in our stable COPD patients. IL-4 is secreted by Th-2 lymphocytes which stimulate the proliferation of B lymphocytes to produce IgG and IgE, and to mediate humoral immunization.Citation44 To our knowledge, this is the first study showing greater concentration of IL-4 in frequent than infrequent exacerbators. Previous studies showed that serum IL-4 is greater in COPD patients during an acute exacerbation compared with stable COPD and control groups.Citation45 Additionally, IL-4 concentration was dramatically increased in Mycoplasma pneumoniae-induced airway diseases, including those occurring in COPD patients.Citation46 These data suggest that Th2 secreted cytokines (eg, IL-4) might play an important role in reducing inflammation. Based on this rationale, greater IL-4 in frequent exacerbators compared with infrequent exacerbators might indicate a protective role of Th2 lymphocytes and their secreted cytokines in balancing immune system function during acute infection and exacerbation. On the other hand, increased concentration of IL-4 due to hyper-activated Th2 cells might increase the concentration of IgE immunoglobulin which leads to airway hyper-responsiveness in exacerbating COPD patients.Citation45 In this regard, the greater IL-4 in frequent exacerbators could reflect increased eosinophilic inflammation, although we found no difference in eosinophilia between frequent and infrequent exacerbators. We also did not find a correlation between IL-4 concentration and spirometric pulmonary function.
This study has limitations. We enrolled fewer frequent exacerbators than infrequent exacerbators. This might affect our ability to detect differences between the two groups. In addition, our study suffers from gender imbalance. The majority of our subjects were men (96%), limiting our ability to assert whether our findings also apply to women with COPD. This observational study was not large enough to provide separate discovery and validation sub-groups. Nevertheless, that we were able to identify the utility of SAA to identify the frequent exacerbator phenotype with a small sample size, suggests that these findings are worth exploring in a larger cohort to validate our findings. In order to increase the clinical utility of SAA to identify frequent exacerbators, we chose to prioritize sensitivity over specificity in identifying an SAA cut-off. Nevertheless, this choice resulted in summed sensitivity and specificity (1.415) that was not meaningfully different from the maximum value (1.421), where specificity was 80%.
Conclusions
This study demonstrated that serum SAA, SP-D and IL-4 concentration were greater in stable COPD patients who had 2 or more exacerbations in the previous year compared with those who experienced 1 or none. Further, SAA was significantly and independently correlated with the frequent exacerbator phenotype but not with spirometric indices of lung function. SAA should be considered as a potential biomarker of the frequent exacerbator phenotype in COPD. These findings provide new insights into the phenotyping COPD and may be useful to inform management of COPD patients.
Abbreviations
BMI, body mass index; BD, bronchodilator; CAT, COPD assessment test; CRP, C-reactive protein; FENO, fractional exhaled nitric oxide; FEV1, forced expiratory volume in one second; FEV1%pred, percentage of predicted FEV1; FVC, forced vital capacity; FVC1%pred, percentage of predicted FVC; GM-CSF, granulocyte-macrophage colony-stimulating factor; IL-1β, interleukin-1β; IL-4, interleukin-4; IL-6, interleukin-6; IL-8, interleukin-8; LTB4, leukotriene B4; MMP-8, matrix metalloproteinases-8; MMP-9, matrix metalloproteinases-9; mMRC, modified Medical Research Council dyspnea scale; NLRP3, NLR family pyrin domain containing 3; PRG4, proteoglycan 4; SAA, serum amyloid A; SP-D, surfactant protein D.
Data Sharing Statement
The datasets used and analyzed during the current study are available from the corresponding author on reasonable request.
Ethics Approval and Consent to Participate
The clinical study was approved by the Medical Ethics Review Committee of the First Affiliated Hospital of Guangzhou Medical University, Guangzhou, China. The reference number for the study is 2016-20. Informed consent about the study procedures were signed and obtained from all the subjects before the study.
Consent for Publication
Not applicable.
Author Contributions
All authors contributed to data analysis, drafting or revising the article, have agreed on the journal to which the article will be submitted, gave final approval of the version to be published, and agree to be accountable for all aspects of the work.
Disclosure
Professor Richard Casaburi reports grants, personal fees from GlaxoSmithKline, Boehringer Ingelheim, Astra Zeneca, Regeneron, and Genentech, outside the submitted work. The authors declare that they have no other competing interests.
Acknowledgments
Results of this study have been presented at the American Thoracic Society 2020 annual conference. The authors would like to thank the investigators and patients at the investigative sites for their support of this study.
References
- CelliBR, BarnesPJ. Exacerbations of chronic obstructive pulmonary disease. European Respir J. 2007;29(6):1224–1238. doi:10.1183/09031936.0010990617540785
- PatelIS, SeemungalTAR, WilksM, Lloyd-OwenSJ, DonaldsonGC, WedzichaJA. Relationship between bacterial colonisation and the frequency, character, and severity of COPD exacerbations. Thorax. 2002;57(9):759–764. doi:10.1136/thorax.57.9.75912200518
- SeemungalTAR, DonaldsonGC, PaulEA, BestallJC, JeffriesDJ, WedzichaJA. Effect of exacerbation on quality of life in patients with chronic obstructive pulmonary disease. Am J Respir Crit Care Med. 1998;157(5):1418–1422. doi:10.1164/ajrccm.157.5.97090329603117
- SeneffMG, WagnerDP, WagnerRP, ZimmermanJE, KnausWA. Hospital and 1-year survival of patients admitted to intensive care units with acute exacerbation of chronic obstructive pulmonary disease. JAMA. 1995;274(23):1852–1857. doi:10.1001/jama.1995.035302300380277500534
- WedzichaJA, RabeKF, MartinezFJ, et al. Efficacy of roflumilast in the COPD frequent exacerbator phenotype. Chest. 2013;143(5):1302–1311. doi:10.1378/chest.12-148923117188
- SethiS, WronaC, EschbergerK, LobbinsP, CaiX, MurphyTF. Inflammatory profile of new bacterial strain exacerbations of chronic obstructive pulmonary disease. Am J Respir Crit Care Med. 2008;177(5):491–497. doi:10.1164/rccm.200708-1234OC18079493
- GompertzS, O’BrienC, BayleyDL, HillSL, StockleyRA. Changes in bronchial inflammation during acute exacerbations of chronic bronchitis. European Respir J. 2001;17(6):1112–1119. doi:10.1183/09031936.01.9911490111491152
- CrooksSW, BayleyDL, HillSL, StockleyRA. Bronchial inflammation in acute bacterial exacerbations of chronic bronchitis: the role of leukotriene B4. European Respir J. 2000;15(2):274–280. doi:10.1034/j.1399-3003.2000.15b09.x10706491
- WedzichaJA, SeemungalTAR, MacCallumPK, et al. Acute exacerbations of chronic obstructive pulmonary disease are accompanied by elevations of plasma fibrinogen and serum IL-6 levels. Thromb Haemost. 2000;84(08):210–215. doi:10.1055/s-0037-161399810959691
- DevD, WallaceE, SankaranR, CunniffeJ, EmmanuelFXS. Value of C-reactive protein measurements in exacerbations of chronic obstructive pulmonary disease. Respir Med. 1998;92(4):664–667. doi:10.1016/S0954-6111(98)90515-79659534
- BhowmikA, SeemungalTA, SapsfordRJ, WedzichaJA. Relation of sputum inflammatory markers to symptoms and lung function changes in COPD exacerbations. Thorax. 2000;55(2):114. doi:10.1136/thorax.55.2.11410639527
- PereraWR, HurstJR, WilkinsonTMA, et al. Inflammatory changes, recovery and recurrence at COPD exacerbation. European Respir J. 2007;29(3):527. doi:10.1183/09031936.0009250617107990
- HurstJR, DonaldsonGC, PereraWR, et al. Use of plasma biomarkers at exacerbation of chronic obstructive pulmonary disease. Am J Respir Crit Care Med. 2006;174(8):867–874. doi:10.1164/rccm.200604-506OC16799074
- BozinovskiS, HutchinsonA, ThompsonM, et al. Serum amyloid a is a biomarker of acute exacerbations of chronic obstructive pulmonary disease. Am J Respir Crit Care Med. 2008;177(3):269–278. doi:10.1164/rccm.200705-678OC18006888
- UhlarCM, WhiteheadAS. Serum amyloid A, the major vertebrate acute‐phase reactant. European j Biochem. 1999;265(2):501–523. doi:10.1046/j.1432-1327.1999.00657.x10504381
- Global Strategy for the Diagnosis, Management and Prevention of Chronic Obstructive Lung Disease 2020 Report. Global Initiative for Chronic Obstructive Lung Disease (GOLD). Available from: http://www.goldcopd.org. Accessed 92, 2020.
- HurstJR, VestboJ, AnzuetoA, et al. Susceptibility to exacerbation in chronic obstructive pulmonary disease. N Engl J Med. 2010;363(12):1128–1138. doi:10.1056/NEJMoa090988320843247
- PellegrinoR, ViegiG, BrusascoV, et al. Interpretative strategies for lung function tests. Eur Respir J. 2005;26(5):948–968. doi:10.1183/09031936.05.0003520516264058
- ZhengJ, ZhongN. Normative values of pulmonary function testing in Chinese adults. Chin Med J. 2002;115(1):50–54.11930658
- ATS/ERS recommendations for standardized procedures for the online and offline measurement of exhaled lower respiratory nitric oxide and nasal nitric oxide. Am J Respir Crit Care Med. 2005;171(8):912–930. doi:10.1164/rccm.200406-710ST15817806
- GulatiS, WellsJM, UrdanetaGP, et al. Fibroblast growth factor 23 is associated with a frequent Exacerbator phenotype in COPD: a cross-sectional pilot study. Int J Mol Sci. 2019;20(9):2292. doi:10.3390/ijms20092292
- VietriL, BennettD, CameliP, et al. Serum amyloid A in patients with idiopathic pulmonary fibrosis. Respir Investig. 2019;57(5):430–434. doi:10.1016/j.resinv.2019.03.010
- FormigaMF, VitalI, UrdanetaG, et al. Higher serum levels of systemic inflammatory markers are linked to greater inspiratory muscle dysfunction in COPD. Clin Respir J. 2019;13(4):247–255. doi:10.1111/crj.1300630773817
- LinTL, ChenWW, DingZR, WeiSC, HuangML, LiCH. Correlations between serum amyloid A, C-reactive protein and clinical indices of patients with acutely exacerbated chronic obstructive pulmonary disease. J Clin Lab Anal. 2019;33(4):e22831. doi:10.1002/jcla.2283130666727
- JohnsonBD, KipKE, MarroquinOC, et al. Serum amyloid A as a predictor of coronary artery disease and cardiovascular outcome in women: the national heart, lung, and blood institute-sponsored Women’s Ischemia Syndrome Evaluation (WISE). Circulation. 2004;109(6):726–732. doi:10.1161/01.CIR.0000115516.54550.B114970107
- SinDD, ManSF. Why are patients with chronic obstructive pulmonary disease at increased risk of cardiovascular diseases? The potential role of systemic inflammation in chronic obstructive pulmonary disease. Circulation. 2003;107(11):1514–1519. doi:10.1161/01.CIR.0000056767.69054.B312654609
- Rodriguez-RoisinR. Is this the beginning of unravelling the puzzle of COPD exacerbations? Eur Respir J. 2005;26(3):376–378. doi:10.1183/09031936.05.0007620516135715
- AnthonyD, SeowHJ, UddinM, et al. Serum amyloid A promotes lung neutrophilia by increasing IL-17A levels in the mucosa and gammadelta T cells. Am J Respir Crit Care Med. 2013;188(2):179–186. doi:10.1164/rccm.201211-2139OC23627303
- AtherJL, CklessK, MartinR, et al. Serum amyloid A activates the NLRP3 inflammasome and promotes Th17 allergic asthma in mice. J Immunol. 2011;187(1):64–73. doi:10.4049/jimmunol.110050021622869
- MengQR, GideonKM, HarboSJ, et al. Gene expression profiling in lung tissues from mice exposed to cigarette smoke, lipopolysaccharide, or smoke plus lipopolysaccharide by inhalation. Inhal Toxicol. 2006;18(8):555–568. doi:10.1080/0895837060068622616717027
- MerkelD, RistW, SeitherP, WeithA, LenterMC. Proteomic study of human bronchoalveolar lavage fluids from smokers with chronic obstructive pulmonary disease by combining surface-enhanced laser desorption/ionization-mass spectrometry profiling with mass spectrometric protein identification. Proteomics. 2005;5(11):2972–2980. doi:10.1002/pmic.20040118016075419
- VoorhoutWF, VeenendaalT, KurokiY, OgasawaraY, van GoldeLM, GeuzeHJ. Immunocytochemical localization of surfactant protein D (SP-D) in type II cells, Clara cells, and alveolar macrophages of rat lung. J Histochem Cytochem. 1992;40(10):1589–1597. doi:10.1177/40.10.15273771527377
- FisherJH, SheftelyevichV, HoYS, et al. Pulmonary-specific expression of SP-D corrects pulmonary lipid accumulation in SP-D gene-targeted mice. Am J Physiol Lung Cell Mol Physiol. 2000;278(2):L365–373. doi:10.1152/ajplung.2000.278.2.L36510666121
- SinDD, PahlavanPS, ManSFP. Surfactant protein D: a lung specific biomarker in COPD? Ther Adv Respir Dis. 2008;2(2):65–74. doi:10.1177/175346580808890319124360
- WrightJR. Immunoregulatory functions of surfactant proteins. Nat Rev Immunol. 2005;5(1):58–68. doi:10.1038/nri152815630429
- ObeidatM, LiX, BurgessS, et al. Surfactant protein D is a causal risk factor for COPD: results of Mendelian randomisation. European Respir J. 2017;50(5):1700657. doi:10.1183/13993003.00657-201729191953
- WertSE, YoshidaM, LeVineAM, et al. Increased metalloproteinase activity, oxidant production, and emphysema in surfactant protein D gene-inactivated mice. Proc Natl Acad Sci U S A. 2000;97(11):5972–5977. doi:10.1073/pnas.10044899710801980
- SørensenGL, HjelmborgJVB, KyvikKO, FengerM, HolmskovU. Genetic and environmental influences of surfactant protein D serum levels. Am J Physiol Lung Cell Mol Physiol. 2006;290(5):L1010–1017. doi:10.1152/ajplung.00487.200516361352
- AtochinaEN, GowAJ, BeckJM, et al. Delayed clearance of Pneumocystis carinii infection, increased inflammation, and altered nitric oxide metabolism in lungs of surfactant protein-D knockout mice. J Infect Dis. 2004;189(8):1528–1539.15073692
- LeVineAM, WhitsettJA, HartshornKL, CrouchEC, KorfhagenTR. Surfactant protein D enhances clearance of influenza A virus from the lung in vivo. J Immunol. 2001;167(10):5868–5873. doi:10.4049/jimmunol.167.10.586811698462
- LeVineAM, ElliottJ, WhitsettJA, et al. Surfactant protein-d enhances phagocytosis and pulmonary clearance of respiratory syncytial virus. Am J Respir Cell Mol Biol. 2004;31(2):193–199. doi:10.1165/rcmb.2003-0107OC15016617
- WuH, KuzmenkoA, WanS, et al. Surfactant proteins A and D inhibit the growth of Gram-negative bacteria by increasing membrane permeability. J Clin Invest. 2003;111(10):1589–1602. doi:10.1172/JCI1688912750409
- LomasDA, SilvermanEK, EdwardsLD, et al. Serum surfactant protein D is steroid sensitive and associated with exacerbations of COPD. Eur Respir J. 2009;34(1):95–102. doi:10.1183/09031936.0015650819164344
- van OosterhoutAJ, MottaAC. Th1/Th2 paradigm: not seeing the forest for the trees? Eur Respir J. 2005;25(4):591–593. doi:10.1183/09031936.05.0001410515802329
- WeiB, ShengLC. Changes in Th1/Th2-producing cytokines during acute exacerbation chronic obstructive pulmonary disease. J Int Med Res. 2018;46(9):3890–3902. doi:10.1177/030006051878164229950127
- HaoY, KuangZ, JingJ, et al. Mycoplasma pneumoniae modulates STAT3-STAT6/EGFR-FOXA2 signaling to induce overexpression of airway mucins. Infect Immun. 2014;82(12):5246–5255. doi:10.1128/IAI.01989-1425287927