
Abstract
Background
Chronic obstructive pulmonary disease (COPD) stands as a predominant cause of global morbidity and mortality. This study aims to elucidate the relationship between pyroptosis-related genes (PRGs) and COPD diagnosis in the context of immune infiltration, ultimately proposing a PRG-based diagnostic model for predicting COPD outcomes.
Methods
Clinical data and PRGs of COPD patients were sourced from the GEO database. The “ConsensusClusterPlus” package was employed to generate molecular subtypes derived from PRGs that were identified through differential expression analysis and LASSO Cox analysis. A diagnostic signature including eight genes (CASP4, CASP5, ELANE, GPX4, NLRP1, GSDME, NOD1and IL18) was also constructed. Immune cell infiltration calculated by the ESTIMATE score, Stroma scores and Immune scores were also compared on the basis of pyroptosis-related molecular subtypes and the risk signature. We finally used qRT – PCR to detect the expression levels of eight genes in COPD patient and normal.
Results
The diagnostic model, anchored on eight PRGs, underwent validation with an independent experimental cohort. The area under the receiver operating characteristic (ROC) curves (AUC) for the diagnostic model showcased values of 0.809, 0.765, and 0.956 for the GSE76925, GSE8545, and GSE5058 datasets, respectively. Distinct expression patterns and clinical attributes of PRGs were observed between the comparative groups, with functional analysis underscoring a disparity in immune-related functions between them.
Conclusion
In this study, we developed a potential as diagnostic biomarkers for COPD and have a significant role in modulating the immune response. Such insights pave the way for novel diagnostic and therapeutic strategies for COPD.
Introduction
Chronic Obstructive Pulmonary Disease (COPD) is a significant medical concern worldwide due to its high incidence and mortality rates. Projections suggest that by 2030, COPD will rise as the third leading cause of death globally.Citation1 Research has shown that smoking is an important risk factor for patients with COPD, and harmful components in cigarette smoke can activate the innate immune system, recruit inflammatory cells to target lung tissue, and mediate the process of inflammation.Citation2 A retrospective study has found that smoking cessation can enhance the efficacy of single inhaler triple therapy, leading to better clinical and functional outcomes six months after commencement.Citation3 Liu et al reported pyroptosis influences the development of COPD.Citation4 Currently, there is evidence that cigarette smoke extract induces pyroptosis through the ROS/NLRP3/caspase-1 pathway.Citation5 Therefore, it is particularly important to explore the regulatory mechanisms related to inflammation in COPD.
Pyroptosis is described proinflammatory programmed cell death and could play a significant role in a variety of biological systems.Citation6 This process, driven by the GSDMD pyroptosis driver, forms non-selective pores in the cell membrane. This alteration subsequently induces cell swelling, rupture, and the eventual release of cellular contents.Citation7,Citation8 GSDMD comprises of two domains, namely the N-terminal gasdermin-N and the C-terminal gasdermin-C, which are connected by a linking loop. The cleavage of GSDMD between these domains is adequate to induce pyroptosis. Being a pore-forming protein, GSDMD typically exists in a state of autoinhibition.Citation9 Recently, upon acute exposure of mice to cigarette smoke (CS), NLRP3 facilitates the activation of GSDMD in bronchial epithelial cells and macrophages located in the bronchoalveolar space, presumably via the activation of the NLRP3 inflammasome.Citation10 Notably, the initiation of pyroptosis releases inflammatory factors that can potentiate a robust inflammatory response, serving as precursors to certain diseases.Citation11 It has been reported that the nanotuner platform can cause pyroptotic cell death in various gasdermin-E-positive human cancers, leading to enhanced anti-tumour efficacy and minimized systemic side effects.Citation12 Given that inflammation is pivotal in the pathogenesis of COPD, the identification and elucidation of pyroptosis-related genes (PRGs) can furnish potential biomarkers for COPD diagnosis.
Our extensive literature review on pyroptosis culminated in the identification of 31 known PRGs.Citation13–15 These were subjected to meticulous scrutiny, with specific genes earmarked for subsequent evaluation. Our research integrated mRNA data from three distinct cohorts, synthesized the role of PRGs, and delved into their correlation with COPD-related immune cell infiltration. It was discerned that immune cell infiltration exhibited substantial variations across the two PRG modification patterns. These patterns exhibited a direct relation to immune checkpoints and overall immune activity. Building on this, we devised a pyroptosis scoring system tailored to pinpoint COPD patients based on PRG modification patterns. Our study is to identify and evaluate potential screening markers associated with COPD for early diagnosis and intervention of COPD. Our research was accepted by the medical ethics review of the Anqing Municipal Hospital (2022.No.61).
Materials and Methods
Source of Datasets
Datasets were sourced from the Gene Expression Omnibus (GEO) and annotated using R version 3.6.5,Citation16 in conjunction with the GEO query package. These datasets detailed gene expression profiles and clinical data for patients diagnosed with COPD (Supplementary Table 1), all derived from Homo sapiens. COPD is heterogeneous, defining features include persistent airflow obstruction and respiratory symptoms. We primarily incorporated data from three distinct databases: (GEO dataset information summary Supplementary Tables 1–3).
GSE76925:Citation17 Comprising 40 normal controls and 111 COPD patients (Supplementary Table 1).
GSE8545:Citation18 Including 36 normal controls and 18 COPD patients (Supplementary Table 2).
GSE5058:Citation19 Featuring 24 normal controls and 15 COPD patients (Supplementary Table 3).
For processing, annotation, and normalization of the datasets, we employed the hgu133plus2.dbCitation20 and illuminaHumanv4.dbCitation21 annotations. As a result, the gene expression matrices for these datasets were duly acquired. In addition to these datasets, we conducted a comprehensive literature review pertinent to pyroptosis. Based on this review, we identified and shortlisted 31 recognized pyroptosis-related genes for subsequent analyses.Citation13–15
Express Mechanism of Pyroptosis-Related Genes
Firstly, we obtained an expression matrix of PRGs from the dataset GSE76925. Boxplot was used to visualize the expression of the PRGs between normal controls and COPD patients. Subsequently, the R programme RCircosCitation22 was used to plot the circos plot for the differential expression across chromosomes. Expression pattern of PRGs was visualized with R function “pheatmap”.Citation23 Then, PPI networks of PRGs were constructed using STRING.Citation24 Correlations were visualized using the R corrplot package.Citation25 KEGG and GO term gene set enrichment analysis (GSEA) was done using clusterProfiler.Citation26
Modeling COPD Based on Pyroptosis-Related Genes
A logistic regression analysis was executed on PRGs of the dataset GSE76925 utilizing R, specifically leveraging the glm function.Citation27 Genes linked to the diagnosis of COPD were filtered based on variables with a significance level of p < 0.05. The LASSOCitation28 serves as a shrinkage estimation technique. This methodology involves the construction of a penalization procedure to compress numerous regression coefficients to zero, thus facilitating variable selection. Leveraging the pyroptosis genes associated with COPD diagnosis, a LASSO classifier was designed to pinpoint an optimized feature subset.
Risk scores for each sample across datasets GSE76925, GSE8545, and GSE5058 were computed based on the aforementioned model. ROC curves were subsequently formulated using the R package “pROC”.Citation29 A violin plot was employed to vividly depict the risk distribution between COPD and the control group across the datasets GSE76925, GSE8545, and GSE5058. To forecast the binding miRNA of COPD diagnostic markers, the miRDBCitation30 platform was utilized, culminating in the construction of mRNA-miRNA interaction networks. These networks were visualized employing the Cytoscape software.Citation31
Construction of PRG Molecular Subclusters
Consensus clustering was performed using the ConsensusClusterPlus package in R to identify optimal profiles.Citation32 Differentially expressed genes (DEGs) were identified using the limma packageCitation33 in R. To select DEGs for in-depth analysis, we adopted the following criteria: a log2 fold change (FC) ≥1, and a false discovery rate (FDR) <0.05. The ESTIMATE R-packageCitation34 was employed to compute both ESTIMATE, Stroma scores and Immune scores within the GSE76925 dataset. The ComplexHeatmap packageCitation35 was utilized to generate heatmaps, illustrating the variation in clinical data distributions (such as Age, Sex, Race, BMI, FEV1, and FEV1/FVC subtype) across different groups. For molecular markers of immune-checkpoint subtypes, we selected CD274, CTLA4, HAVCR2, IDO1, LAG3, and PDCD1. Meanwhile, CD8A, CXCL10, CXCL9, GZMA, GZMB, IFNG, PRF1, TBX2, and TNF were chosen as molecular markers for immune-activity subtypes. Box plots were subsequently generated to visualize the immune-related characteristics of each subtype.
Gene Ontology /Kyoto Encyclopedia of Genes (GO/KEGG) Enrichment Analysis
The “GO plot” software package in R was used for GOCitation36 and KEGGCitation37 pathway enrichment analyses. GO included cell composition, biological processes, and molecular functions. Metascape was used to identify significantly enriched terms for GO and KEGG terms for differentially expressed genes (p value ≤0.01).
Gene Set Enrichment Analysis(GSEA)
Annotating potential pathway functional enrichments between gene sets using GSEA.Citation38 Gene set enrichment analysis of the gene expression matrix was used to analyze the gene expression profiles of different subtypes of GSE76925 using clusterProfiler. The “c2.cp.kegg.v7.4.symbols.gmt” was selected as a reference in the Molecular signatures database (MSigDB)Citation39 for GSEA. Statistical significance was defined as p≤0.1. The gseaplot application EnrichmentMap was used to visualize functional enrichment.
Weighted Correlation Network Analysis (WGCNA)
The network analysis was performed using an R package of WGCNACitation40 in genes of GSE76925.Then, the soft threshold value of the correlation matrix was set to 4(R²=0.879) and height to 0.25 to choose parameter most relevant of COPD. With default parameters, Metascape was used to analyze Gene Ontology/KEGG terms and visualize enrichment results, identifying significant terms with a maximum overlap of 3 terms. p-value< 0.01, and a minimum enrichment of 1.5.
Immune Cell Infiltration Analysis and PRG Analysis
Gene expression profiles and immune cell files of GSE76925 were used to extract an immune cell infiltrate matrix in R using CIBERSORT,Citation41 where the source code and the corresponding immune cell file were downloaded. The heatmaps for immune infiltration of 22 immune cells from distributions for each sample were plotted using the R package ”pheatmap”. Correlation heatmaps of immune cell infiltration were calculated in R and visualized with the corrplot package. We analyzed the correlation between pyroptosis related genes and immune cell infiltration and then visualized the results using the PHEATMAP package.
Human Clinical Specimens
RNA samples of COPD and normal person were obtained from Anqing Municipal Hospital, AnHui, P. R. China. The clinical information for these two groups was listed in Supplementary Table 4. The study protocol was approved by Anqing Municipal Hospital Research Ethics Committee. All patients signed clinical study consent forms. Written informed consent for publication of their details was obtained from the patient.
The diagnosis of COPD is based on the presence of risk factors, symptoms, and spirometry demonstrating persistent airflow obstruction. According to GOLD guidelines, post-bronchodilator testing with an FEV1 to forced vital capacity ratio less than 70% is recommended for the diagnosis of obstruction. People with COPD should receive smoking cessation, vaccinations, inhaler therapy, physical activity, pulmonary rehabilitation, long-term oxygen therapy and non-invasive ventilation.Citation42
Quantitative Reverse Transcription-Polymerase Chain Reaction (qRT-PCR)
Total RNA was extracted from whole blood samples of COPD patients and normal individuals using a combination of Trizol reagent (Invitrogen) and silica-based adsorption column method. Then the total RNA was reverse transcribed into cDNA using the HiScript 1st Strand cDNA Synthesis Kit (cDNA first-strand synthesis kit.).
Statistical Analysis
Analyses were performed using the R software (version 4.2.1). To evaluate the diagnostic impact of gene expression on normal and disease conditions, ROC curves were plotted and analyzed using the pROC package. Differential gene expression was assessed using the wilcox. test function in R. Significance levels were defined as: *p <0.05; **p <0.01; ***p <0.001; ****p<0.0001. Regarding the method of genetic identification, we performed univariate logistic regression analysis on the PRGs in GSE76925, selecting genes associated with COPD diagnosis based on a significance level of p<0.05.
Correlations between immune cells were quantified using the Pearson correlation coefficient test. The strength of these correlations was categorized as follows:
Strong correlation: r≥ 0.8
Medium correlation: 0.6≤ |r|≤ 0.79
Moderate correlation: 0.4≤ |r|≤ 0.59
Weak correlation: 0.2≤ |r|≤ 0.39
No correlation: |r| < 0.2
Significant correlations between functional genes were visualized using the corrplot function from the corrplot package in R. Analyses examining associations between PRGs and immune cells were conducted using the psych package in R.
Results
Data Download and Pre-Processing
The mRNA expression profile datasets of GSE76925, GSE8545 and GSE5058 () were downloaded from GEO (http://www.ncbi.nlm.nih.gov/geo/). Data processing of clinicopathological characteristics was performed with the GEOquery, Illuminahumanv4.db and HG U133p lus2.D B packages. Expression data and annotations of genes were then processed using MAS5.0 normalization with the “Affy” Bioconductor package. Gene annotation files were downloaded from HGNC. After matching the expression matrix contains 15,575 genes and 151 samples from GSE76925, 16,930 genes and 54 samples from GSE8545 and 16,930 genes and 39 samples from GSE5058. We searched the literatures related to pyroptosis and obtained 31 pyroptosis related genes ().
Table 1 Summary of Those 3 GEO Datasets of Chronic Obstructive Pulmonary Disease (COPD)
Table 2 The 31 Original Pyroptosis-Related Genes That Were Used in This Study
Expression Mechanism of Pyroptosis Related Genes
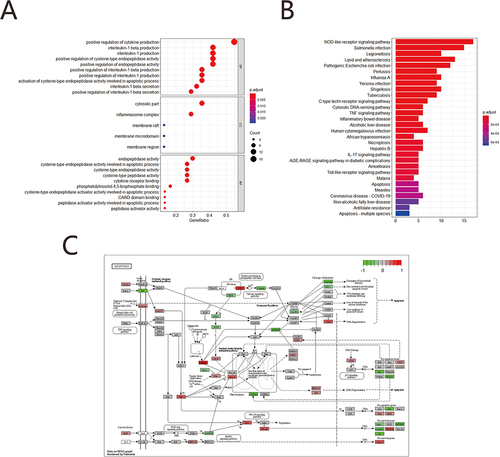
In this study, 31 PRGs derived from the literature were screened for analysis in GSE76925. Moreover, box plots show CASP4, CASP5, ELANE, GPX4, GSDMB, GSDME, NLRP1, NOD1 within highly expressed genes and CASP6, IL18 within lowly expressed ones as compared with the normal samples (). Chromosome map shows that CASP4, CASP5, IL18 locate in chr11; GSDME, NOD1 locate in chr7, and CASP6 locates in chr4 (). There is a distinct difference in the expression patterns of PRGs between COPD and normal samples through a heatmap (). An interactome network graph was generated using STRING (). depicts a heat map representation of correlation between pyroptosis related genes. GO analysis revealed that PRGs were associated with interleukin-1 beta production, interleukin-1 production, positive regulation of interleukin-1 beta production, inflammasome complex, cytosolic part, membrane raft and cysteine-type endopeptidase activity involved in apoptotic process, cysteine-type endopeptidase activity, cysteine-type peptidase activity, cysteine-type endopeptidase activator activity involved in apoptotic process (). KEGG pathway analysis showed PRGs were enriched in pathways, such as NOD-like receptor, TNF signaling pathway, IL-17 signaling pathway, Apoptosis and Necroptosis (). We used the R package Pathview to visualize pathway of apoptosis composing KEGG pathways ().
Figure 1 Expression mechanism of pyroptosis-related genes. (A) Boxplots of pyroptosis-related genes, Blue represents the normal group and red represents the COPD group (*p<0.05; **p<0.01; *** p<0.001; ****p<0.0001). (B) Chromosomal mapping of Differential pyroptosis genes. (C) Heatmap of pyroptosis-related genes, Blue represents the normal group, red represents the COPD group; (D) PPI analysis the differentially expressed pyroptosis-related genes, The larger the node, the darker the color, the more important the gene. (E) Correlation heatmaps of pyroptosis-related genes, The color represents the strength of the relatedness, with red indicating negative correlation, and blue indicating positive correlation.
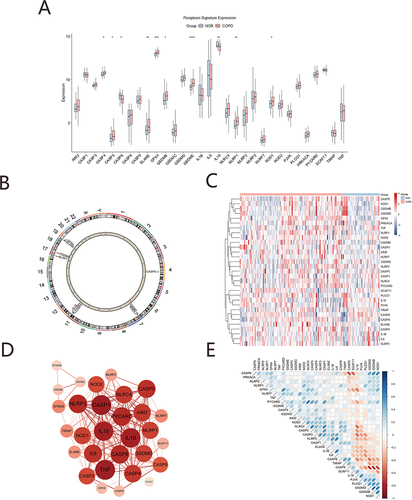
Figure 2 Functional enrichment analysis of pyroptosis-related genes. (A) GO top enrichment function dotplot; (B) KEGG top enrichment function dotplot; (C) Apoptosis pathway diagram.
Construction of PRG Molecular Subclusters
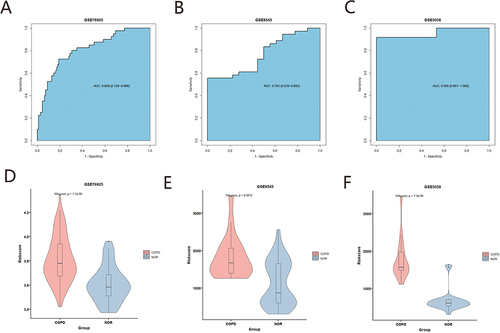
A total of 8 pyroptosis related genes (CASP4, CASP5, ELANE, GPX4, GSDME, IL18, NLRP1, NOD1) with significant diagnosis were selected using univariate logistic regression analysis combined with LASSO in GSE76925 (p<0.05) (). A diagnostic model based on eight diagnostic markers was constructed using multiple logistic regression. Subsequently, we applied the above model to diagnose for each sample in GSE76925, GSE8545 and GSE5058. ROC curve analysis showed that risk scores were a strong diagnostic ability with an AUC of 0.809 in GSE76925, 0.765 in GSE8545 and 0.956 in GSE5058 (). The violin diagram confirms that the model has the same diagnostic ability (). Next, miRDB was used to screen the targeted relationship between miRNAs and diagnostic markers of PRGs. In addition, 7 mRNA and 174 miRNA were obtained, diagnostic marker interaction network of miRNA-pyroptosis was constructed (Supplementary Figure 1).
Figure 3 Construction of a diagnostic model for COPD. (A) Univariate Logistic regression analysis. (B and C) LASSO logistic regression algorithm screening of COPD diagnostic markers. (D) Multivariate Logistic regression analysis.
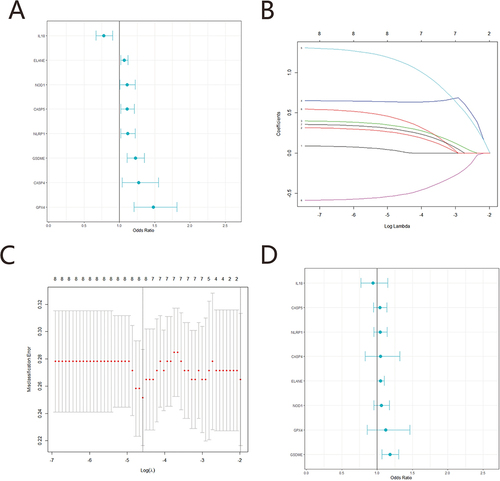
Figure 4 Validation of COPD diagnostic model. (A) GSE76925 ROC analysis of risk score. (B) GSE8545 ROC analysis of risk score. (C) GSE5058 ROC analysis of risk score. (D) GSE76925 violin plots. (E) GSE8545 violin plots. (F) GSE5058 violin plots.
Molecular Typing Analysis Based on PRGs
Based on 31 genes related to pyroptosis, a consensus cluster analysis was performed using the ConsensusClusterPlus R package to classify GSE76925 COPD group into two gene clusters: gene cluster C1 and gene cluster C2 (Supplementary Figure 2).
The “limma” R package was used to screen 105 DEGs associated with pyroptosis, and the filter criteria were |logFoldchange (FC) | >1 and false discovery rate (FDR) <0.05, with 7 genes being upregulated and 98 genes downregulated in GSE76925 COPD group. Upregulated and downregulated genes are plotted by volcano plot (). The expression patterns and clinical characteristics of pyroptosis related genes were significantly different between the C1 and C2 samples through heatmap( and ).
Figure 5 Subtype analysis. (A) Volcano plot of DEGs in C1 and C2, Red represents upregulated gene, blue represents downregulated gene, gray represents indifference gene; (B) Heatmap of PRGs, Red represents C2 group, blue represents C1 group; (C) Heatmap of clinical characteristics, Red represents C2 group, blue represents C1 group; (D) Bee swarm plot of risk score, Red represents C2 group, blue represents C1 group; (E) Violin plot of immune score, Red represents C2 group, blue represents C1 group; (F) Boxplots of immune biomarker, Red represents C2 group, blue represents C1 group (*p<0.05; **p<0.01; ***p<0.001).
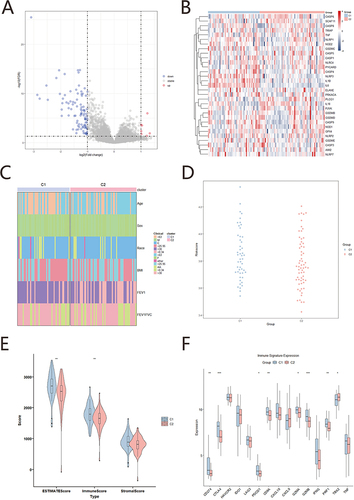
The C1 group has higher risk scores than the C2 group by beeswarm plot in COPD diagnostic model scores (). We applied the Estimate algorithm from GSE76925 (COPD samples) to calculate various immune scores: ESTIMATE score, immune score and matrix score. The violin chart showed that each score of C1 group also exhibited significantly higher immune score than the C2 group (). The C1 group in immune-checkpoint (CD274, CTLA4, PDCD1) was significantly higher than the C2 group. And immune activity gene (CD8A, GZMA GZMB, PRF1) in the C1 group also showed significantly higher than C2 group, while TBX2 in the C1 group lower significantly than in the C2 group ().
GO/KEGG Enrichment Analysis
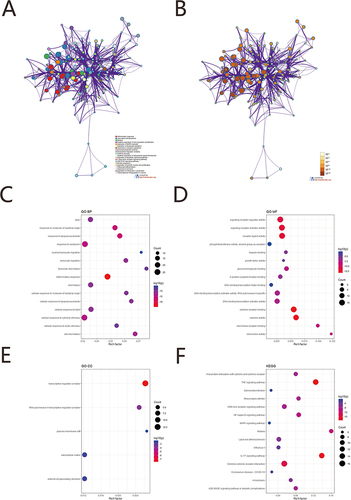
We performed gene enrichment analysis of 105 PRGs of differential genes using the Metascape online tool. The function was screened using p <0.01, minimum count of 3 and enrichment factor >1.5. Overall, the function of DEGs was significantly associated with inflammatory response, response to lipopolysaccharide, response to molecule of bacterial origin, cellular response to cytokine stimulus, leukocyte migration, myeloid leukocyte migration and cytokine receptor binding, receptor ligand activity, chemokine receptor binding, and signaling receptor activator activity. DNA-binding transcription activator activity, growth factor activity, transcription regulator complex, RNA polymerase II transcription regulator complex, extracellular matrix, external encapsulating structure, TNF signaling pathway, IL-17 signaling pathway, NF-kappa B signaling pathway, NOD-like receptor signaling pathway, MAPK signaling pathway () (). The detailed results were shown in Supplementary Table 5.
Table 3 GO/KEGG Enrichment Analysis
Figure 6 GO/KEGG enrichment analysis. (A) Network diagram of the top 20 enrichment functions the top 20 enriched terms in KEGG analysis. Cluster ID to indicate the color. Each node is an enriched term. (B) Network diagram of the top 20 enrichment functions. P value indicates the color. Each node is an enriched term. (C) GO BP enrichment results dot plot. The size of the dot represents the count number, and the color represents P value. (D) GO MF enrichment results dotplot. (E) GO CC enrichment results dot plot; (F) KEGG enrichment results.
GSEA
We conducted GSEA to analyze the pathway enriched in expression profile of GSE76925 /COPD according to C1 and C2 using clusterProfiler. A p-value<0.05 was used as the threshold to determine the significant enrichment of KEGG pathways. (Supplementary Figure 3, ). GSEA pathway of COPD in GSE76925 enrichment results showed that Salmonella infection, MAPK signaling pathway, Cytokine-cytokine receptor interaction, Human cytomegalovirus infection, NF-kappa B signaling pathway, PI3K-Akt signaling pathway, HIF-1 signaling pathway, Chagas disease, Pathways in cancer, Transcriptional misregulation in cancer, Apoptosis, Th17 cell differentiation, AGE-RAGE signaling pathway in diabetic complications, Coronavirus disease COVID-19, MicroRNAs in cancer, TNF signaling pathway, JAK-STAT signaling pathway markedly enriched (Supplementary Table 6) ().
Table 4 GSEA
WGCNA
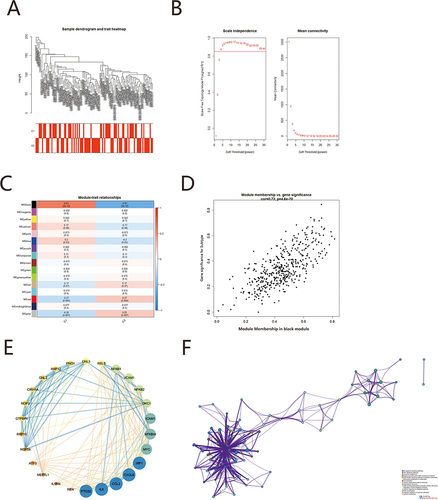
We performed robust weighted gene co-expression network analysis to expression profile in GSE76925/COPD. With the soft threshold set at 4 (scale-free R2 = 0.879) and the cut height at 0.25, we finally identified sixteen modules relevant to this subtype of COPD (). The association between modules and clinical characteristics was measured by the correlation between modular feature gene values and clinical features. and showed that black module was most significantly associated with subtype of COPD. (correlation = 0.72, p = 4.6E-70). We uploaded black module into STRING database to build the protein–protein interaction (PPI) network. The sub-network in the top ranked-score were identified with the MCODE to obtained a module (). We considered that this module might play a special role in the diagnostic mechanism of COPD subtypes, then put this module gene into Metascape. The function was screened by p<0.01, minimum count of 3 and enrichment factor >1.5. The results showed differentially expressed genes are primarily related to NF-kappa B signaling pathway, Epstein-Barr virus infection, Human T-cell leukemia virus 1 infection, MAPK signaling pathway, TNF signaling pathway, IL-17 signaling pathway, inflammatory response, Coronavirus disease-COVID-19, cellular response to biotic stimulus, Chemokine signaling pathway ().
Figure 7 Network analysis identifies modules of co-expressed genes across disease. (A) Sample dendrogram and trait heat map; (B) Analys is of the scale-free fit index (left) and the mean connectivity (right) for various soft-thresholding powers; (C) The correlation of heatmap between subtype and module signature genes in COPD. (D) The correlation of scatterplot between subtype and black module. (E) The sub-networks with the highest of MCODE scores were identified, that is an important functional sub-networks in the black module. (F) GO\KEGG enrichment analysis of functional sub-networks.
Analysis of Correlation Between Immune Cell Infiltration and PRGs
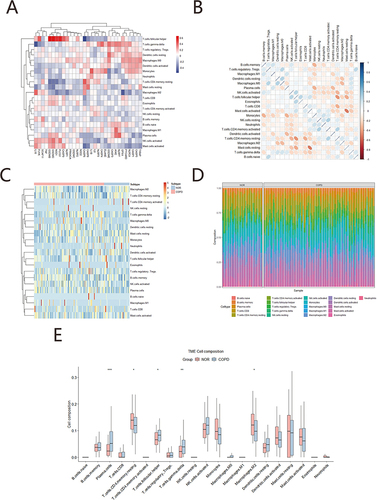
Correlation analysis is results show () that T cells follicular helper was positively correlated with GSDMB, GSDMD, NOD1, PLCG1, negatively correlated with CASP6. Macrophages M2 was significant negative correlated with GPX4, and positively with IL18. There was significant positively correlation between T cells CD4 memory resting and CASP6, Plasma cells and NLRP7, AIM2, T cells gamma delta was significant negatively correlated with IL18. Heat maps of 22 immune cells shows a clear negative correlation between Mast cells resting and Mast cells activated; between T cells CD4 memory resting and T cells follicular helper (). Heatmap of immune cell infiltration showed significant differences between COPD and the normal group (). Compared to normal group, COPD patients had higher proportions of immune cells with CD4 memory activated and CD4 memory resting, and there was a significant difference between COPD and the normal group (). Finally, the box plot of immune cell infiltration presents T cells CD4 memory resting and Macrophages M2 showed a higher level of immune infiltration compared to normal, whereas Plasma cells, T cells follicular helper and T cells gamma delta with a lower level ().
Figure 8 Correlation analysis between immune cell infiltration and pyroptosis. (A) Correlation analysis between pyroptosis genes and 22 immune cell infiltration, red represent positive correlation, blue represent negative correlation; (B) The correlation heat map of 22 immune cells infiltration, red represent negative correlation, blue represent positively correlation, The darker the colour, the stronger the correlation; (C) Heatmaps of immune cells infiltration between COPD group and normal group; (D) Box plots of immune cell infiltrate composition, (E) Box plots of two immune cell infiltrate composition, red represents COPD group; blue represents normal group, *p<0.05; **p<0.01; ***p<0.001.
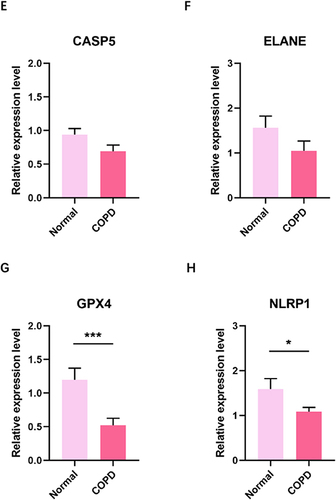
Expression of PRGs in COPD and Normal Control
Quantitative real-time PCR (qRT-PCR) was performed to detect PRGs expression. The results showed that NOD1 and GSDME expression in COPD were significantly higher than in healthy individual ( and ). However, expression of the six PRGs was downregulated in COPD compared with normal individual ().
Figure 9 Continued.
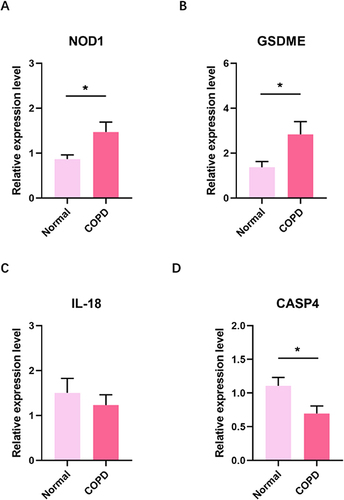
Figure 9 RT-qPCR analyze the mRNA of PRGs in blood between normal and COPD. (A) NOD1 mRNA (B) GSDME mRNA (C) IL-18 mRNA (D) CASP4 mRNA (E) CASP5 mRNA (F) ELANE mRNA (G) GPX4 mRNA (H) NLRP1 mRNA. *p<0.05; ***p<0.001; RT-qPCR: Real-time quantitative PCR.
Discussion
By 2030, COPD is projected to rank as the third primary cause of morbidity and mortality worldwide.Citation1 Current therapeutic strategies for COPD emphasize minimizing disease activity, mitigating symptoms, stalling disease progression, and ultimately reducing disease severity. A significant challenge in the management of COPD remains the accurate diagnosis and prognosis.
Recently, a novel method of programmed cell death, termed Pyroptosis, has come into the spotlight. Investigations have linked pyroptosis with tumor immunity and its therapeutic implications. Chen et alCitation8 have showcased that nanoparticles can induce pyroptosis predominantly through a mitochondrial apoptosis pathway, triggered by PLC in early endosomes. Meanwhile, Chai et alCitation43 revealed the pivotal role of GSDMD-induced inflammatory cytokine release and pyroptosis in fostering host immune responses against infections. Meng et alCitation13 provided evidence suggesting that pyroptosis scores could predict the prognosis and immunotherapy response in patients with cutaneous melanoma. To our knowledge, this study is the pioneer in exploring the role of Pyroptosis-related genes (PRGs) in COPD diagnosis.
Previous research has identified diagnostic biomarker signatures. Meng et alCitation13 pinpointed an optimal panel of PRGs that could guide immunotherapy candidates and therapeutic strategies, anchored in comprehensive evaluations of tumor PRG modifications. By employing pyroptotic patterns, one can ascertain patient immunophenotypes and tailor immunotherapy approaches.Citation14 Furthermore, Chao et alCitation44 introduced a prognostic model associated with PRGs in glioma patients. This model’s AUC values in the test set reached 0.669, 0.713, and 0.709 for 1-year, 3-year, and 5-year intervals, respectively. In contrast, our study identified eight PRGs with an AUC ranging from 0.765 to 0.956. Our findings suggest that a select combination of biomarkers is instrumental in diagnosing COPD.
Notably, CD8+ T cells and NK cells have been evidenced to instigate tumor pyroptosis via the GSDMB-GZMA axis, driven by interferon-γ (IFN γ). These immune cells could potentially target GSDMB-expressing cancer cells to enhance antitumor immunity.Citation45 Additionally, the nuclear PD-L1 family, when overexpressed, could shift TNF-induced apoptosis to pyroptosis, leading to tumor necrosis and potentially promoting tumor growth.Citation46 These studies underscore the intricate ties between pyroptosis and immune responses in tumor treatments. Yet, the domain of COPD remains untouched in the context of PRG bioinformatics.
Our research endeavors led us to devise a pyroptosis score system, gauging the diagnostic potential of PRGs in individual COPD patients. Based on the expression of 8 PRGs, we formulated two distinct pyroptosis modification paradigms. Our diagnostic classifier integrating these PRGs showcased robust discrimination in the training sets (AUC values: GSE76925=0.809, GSE8545=0.765) and held up impressively in the test set GSE5058 (AUC=95.6%). Beyond identifying the eight key PRGs (CASP4, CASP5, ELANE, GPX4, GSDME, IL18, NLRP1, NOD1) as potential biomarkers for COPD, we have also sculpted a diagnostic model rooted in these PRGs. Both internal and external validations reinforced the model’s efficacy in distinguishing COPD patients from control groups.
In addition, our study found five PRGs (NOD1, GSDME, GPX4, NLRP4, CASP4) were significantly different between COPD and normal control, which was consistent with the results of the box plot analysis of PRGs in GSE76925. NOD1 and GSDME were overexpressed in the COPD, while GPX4, NLRP1, CASP4 is underexpressed in the COPD. This finding is inconsistent with the results reported in the literature, which may be due to differences in the clinical samples collected.
The cytoplasmic nucleotide-binding oligomerization domain-1 (NOD1), a member of the NLR family, is widely expressed in various cell types.Citation47,Citation48 The N-terminal of NOD1 contains caspase activation/recruitment domains (CARDs), which are highly expressed in inflammatory cells. The activation of NF- κ B signaling pathway leads to the secretion of inflammatory cytokines.Citation49,Citation50 In advanced COPD stages, the upregulation of TLR4 and NOD1 in bronchial epithelia is connected with heightened inflammation and an increased bacterial load of P. aeruginosa.Citation51 Elevating NOD1 expression in COPD mouse models exacerbated lung function impairments caused by cigarette smoke, as manifested by increased airway resistance, diminished functional residual capacity, and more pronounced pulmonary injury.Citation52 In our study, T cells follicular helper displayed a positive correlation with GSDMB, GSDMD, and NOD1.
GSDME belongs to the Gasdermin family, which also includes GSDMA, GSDMB, GSDMC, GSDMD, and DFNB59.Citation9 Gasdermin E possesses a autoinhibitory dual-domain architecture, comprising the N-terminal and C-terminal domains of Gasdermin.Citation53 As vital substrates for pyroptotic cell death, GSDME and GSDMD facilitate distinct forms of pyroptosis. GSDME-dependent pyroptosis is an inflammasome-independent pyroptosis without the assembly of inflammasomes. However, GSDME-N cleaved by caspase-3 has the pore-forming property to promote the release of cytokines such as IL-1β and IL-18, which have been confirmed in most pathological and pharmacological studies.Citation54–56 Recently, using GSDME-deficient mice and human tubular epithelial cells (TECs), Xia et al found that cisplatin treatment led to pyroptosis in TECs, upregulation of GSDME-N expression, and induction of cell pyroptosis through pharmacological and genetic interventions. Silencing GSDME attenuated acute kidney injury and inflammation in mice. These findings suggest that Caspase-3/GSDME-induced pyroptosis and inflammation contribute to the development of acute kidney injury (AKI).Citation56 Gan et al demonstrate that GSDME plays a role in the development of Crohn’s disease (CD) by inducing GSDME-mediated pyroptosis, which leads to the release of proinflammatory cytokines.Citation57 Furthermore, knockout of GSDME switched the manner of death of A549 and human primary alveolar epithelial cells from pyroptosis to apoptosis upon H7N9 virus infection, and GSDME knockout mice survived H7N9 virus lethal infection.Citation58 GSDME also plays a significant role in Corona Virus Disease 2019 (COVID-19). Specifically, the activation of the caspase-3/GSDME axis triggers the demise of airway epithelial cell during infection with SARS-CoV-2, particularly when GSDMD is absent.Citation59 Both our study and the box plot analysis of PRGs in relevant literature consistently revealed a significant overexpression of GSDME in the COPD group compared to the control group.
GPX4 serves as a crucial regulator of ferroptosis, and it is capable of inducing ferroptosis in mouse tumor xenografts.Citation60 Recent findings indicate that GPX4 exhibits dual functionality in OA, serving both to regulate ferroptosis or oxidative stress and to modulate ECM degradation via the MAPK/NFkB signaling pathway.Citation60 Copper directly binds to GPX4 protein, leading to the formation of GPX4 aggregates and subsequent autophagic degradation of GPX4.Citation61 Our research corroborated that M2 Macrophages were more prevalent in the COPD group, exhibiting a strong inverse correlation with GPX4 and a positive one with IL-18. In contrast, T cells gamma delta had a significant negative correlation with IL-18.
NLRP1, a member of the NOD-like receptor (NLR) family, possesses a domain known as FIIND (function-to-find domain).Citation62 The NLRP1 inflammasome serves as an innate immune sensor for the SARS-CoV-2 3CL protease.Citation59 Inflammasome-dependent caspase-1 activity can result in pyroptosis.Citation63 CASP4/5 bind intracellular lipopolysaccharide (LPS), the primary structural component of the outer membrane of Gram-negative bacteria, with high specificity and affinity via their N-terminal CARD domain, triggering caspase activation and resulting in pyropoptotic cell death.Citation64 Inhibiting CASP4 results in compromised cell migration and adhesion to the extracellular matrix in epithelial cancer cells.Citation65 Alveolar macrophages isolated from asthma patients display elevated expression of caspase-4, which is the human homologue of caspase-11. This upregulation of caspase-4/11 suggests a significant role in allergic airway inflammation.Citation66
Additionally, our thorough examination revealed significant differences in immune cell infiltration patterns in relation to various pyroptosis types and their clinical implications. Notably, the GSEA result was significantly enriched in a myriad of pathways, including the MAPK signaling pathway, NF-kappa B signaling pathway, and HIF-1 signaling pathway, among others.
We employed CIBERSORT for an exhaustive analysis of COPD immune infiltration to delve deeper into the role of immune cell infiltration in this disease. We found the proportion of CD4 memory-resting T cells and M2 macrophages in COPD patients was significantly elevated compared to controls, while the presence of Plasma cells, T cells follicular helper, and T cells gamma delta was considerably lower.
Research indicates that pyroptosis affects immune system components, such as macrophages and dendritic cells (DCs).Citation67 Pyroptosis mediates interactions between innate and adaptive immunity, shaping the cancer microenvironment to induce an immunostimulatory response.Citation68 In our study, we explored the relationship between several pyroptotic genes and immune cell infiltration. We found these PRGs to be significantly correlated with immune cells, suggesting an interplay between pyroptosis and the immune response in COPD. The underlying molecular mechanisms remain to be elucidated.
Our study has certain limitations. Although there were differences in PRGs between the two groups in our clinical specimens and database data analysis, CASP4, CASP5, ELANE, GPX4, and NLRP1 were found to be expressed at lower levels in the COPD group compared to the control group in our clinical whole blood specimens. This finding is inconsistent with the results reported in the literature, which may be due to differences in the clinical samples collected. Our external validation was performed on two datasets with a relatively small sample size in the external validation set. Although the model’s AUC demonstrated reasonable discriminatory power, there is room for improvement. Consequently, our goal in this study was to identify and evaluate potential screening biomarkers associated with COPD for early diagnosis and intervention. Assessing their diagnostic accuracy and sensitivity in a larger population is a crucial direction for future research.
Conclusion
In this study, we identified eight potential PRGs—namely, CASP4, CASP5, ELANE, GPX4, GSDME, IL18, NLRP1, and NOD1—as potential diagnostic biomarkers for COPD. Notably, This is the first time these PRGs have been associated with COPD diagnosis. We conducted both internal and external validations of a PRGs diagnostic model for COPD using LASSO logistic regression. The AUC value of this model in the test set yielded values of 0.765, 0.809, and 0.956 for datasets GSE8545, GSE76925, and GSE5058, respectively.
To further investigate the role of the immune response in COPD, we employed CIBERSORT to assess immune cell infiltration using our gene signatures. Preliminary correlation analysis suggests that pyroptosis may be implicated in the immune response observed in COPD patients. Thus, our gene signature serves as potential markers for the screening of COPD. The insights gained from this study not only enrich our understanding of the pyroptosis genes in patients with COPD but also aim to screen for biomarkers to achieve early intervention, reduce the disease burden, and improve the quality of life for patients with COPD.
Ethical/Copyright Corrections
Medical ethics review (2022) No. 61 by Anqing municipal hospital.
Consent for Publication
We give our consent for publication.
Author Contributions
All authors made a significant contribution to the work reported, whether that is in the conception, study design, execution, acquisition of data, analysis and interpretation, or in all these areas; took part in drafting, revising or critically reviewing the article; gave final approval of the version to be published; have agreed on the journal to which the article has been submitted; and agree to be accountable for all aspects of the work.
Disclosure
The authors report no conflicts of interest in this work.
Acknowledgment
We thank (https://www.helixlife.cn/) for its linguistic assistance during the preparation of the manuscript. We would like to acknowledge Yingchun Ji’s contribution to data collection for this article.
Data Sharing Statement
The data that support the findings of this study are openly available in GEO. We used three databases: GSE76925 (doi:10.1038/srep44232), GSE8545 (doi:10.1378/chest.07-2245), and GSE5058 (doi:10.1164/rccm.200705-795OC).
Additional information
Funding
References
- Wu CT, Li GH, Huang CT, et al. Acute exacerbation of a chronic obstructive pulmonary disease prediction system using wearable device data, machine learning, and deep learning: 483 development and cohort study. JMIR mHealth uHealth. 2021;9(5):e22591. doi:10.2196/22591
- Tashkin DP. Smoking cessation in chronic obstructive pulmonary disease. Semin Respir Crit Care Med. 2015;36(4):491–507. doi:10.1055/s-0035-1555610
- Pezzuto A, Tonini G, Ciccozzi M, et al. Functional benefit of smoking cessation and triple inhaler in combustible cigarette smokers with severe COPD: a retrospective study. J Clin Med. 2022;12(1):234. PMID: 36615032; PMCID: 489 PMC9821177. doi:10.3390/jcm12010234.
- Liu X, Huang X, Xu F. The influence of pyroptosis-related genes on the development of chronic obstructive pulmonary disease. BMC Pulm Med. 2023;23(167). doi:10.1186/s12890-023-02408-5
- Zhang MY, Jiang YX, Yang YC, et al.. Cigarette smoke extract induces pyroptosis in human bronchial epithelial cells through the ROS/NLRP3/caspase-1 pathway. Life Sci. 2021;269:119090. PMID: 33465393. doi:10.1016/j.lfs.2021.119090
- Cookson BT, Brennan MA. Pro-inflammatory programmed cell death. Trends Microbiol. 2001;9(3):113–114. PMID: 11303500 doi:10.1016/s0966-842x(00)01936-3.
- Kovacs SB, Miao EA. Gasdermins: effectors of pyroptosis. Trends Cell Biol. 2017;499(27):673–684. doi:10.1016/j.tcb.2017.05.005
- Chen X, He WT, Hu L, et al. Pyroptosis is driven by non-selective gasdermin-D pore and its morphology is different from MLKL channel-mediated necroptosis. Cell Res. 2016;26(9):1007–1020. doi:10.1038/cr.2016.100
- Shi J, Gao W, Shao F. Pyroptosis: gasdermin-mediated programmed necrotic cell death. Trends Biochem Sci. 2017;42(4):245–254. PMID: 27932073 doi:10.1016/j.tibs.2016.10.004.
- Huot-Marchand S, Nascimento M, Culerier E, et al.. Cigarette smoke-induced gasdermin D activation in bronchoalveolar macrophages and bronchial epithelial cells dependently on NLRP3. Front Immunol. 2022;13:918507. PMID: 36045672; PMCID: PMC9421433. doi:10.3389/fimmu.2022.918507
- Jorgensen I, Miao EA. Pyroptotic cell death defends against intracellular pathogens. Immunol Rev. 2015;265(1):130–142. doi:10.1111/imr.12287
- Chen B, Yan Y, Yang Y, et al. A pyroptosis nanotuner for cancer therapy. Nat Nanotechnol. 2022;17(7):788–798. PMID: 35606443. doi:10.1038/s41565-022-01125-0.
- Meng J, Huang X, Qiu Y, et al. Pyroptosis-related gene mediated modification patterns and immune cell 516 infiltration landscapes in cutaneous melanoma to aid immunotherapy. Aging. 2021;13(21):24379–24401. doi:10.18632/aging.203687
- Xiang R, Ge Y, Song W, et al. Pyroptosis patterns characterized by distinct tumor microenvironment infiltration landscapes in gastric cancer. Genes. 2021;12(10):1535. doi:10.3390/genes12101535
- Karki R, Kanneganti T-D. Diverging inflammasome signals in tumorigenesis and potential targeting. Nat Rev Cancer. 2019;19(4):197–214. 522. doi:10.1038/s41568-019-0123-y
- R Core Team. 16.R: A Language and Environment for Statistical Computing. R Foundation 523 for Statistical Computing. Vienna, Austria; 2020. Available from: https://www.R-project.org/. Accessed June 14, 2024.
- Morrow JD, Zhou X, Lao T, et al. Functional interactors of three genome-wide association study genes are differentially expressed in severe chronic obstructive pulmonary disease lung tissue. Sci Rep. 2017;7(1). doi:10.1038/srep44232
- Ammous Z, Hackett NR, Butler MW, et al. Variability in small airway epithelial gene expression among normal smokers. Chest. 2008;133(6):1344–1353. doi:10.1378/chest.07-2245
- Tilley AE, Harvey B-G, Heguy A, et al. Down-regulation of the notch pathway in human airway epithelium in Association with smoking and chronic obstructive pulmonary disease. Am J Respir Crit Care Med. 2009;179(6):457–466. doi:10.1164/rccm.200705-795OC
- Marc Carlson. Affymetrix Human Genome U133 Plus 2.0 Array annotation data (chiphgu133plus2). R package version 3.2.3; 2016 Available from: hgu133plus2.db. Accessed June 14, 2024.
- Dunning M, Lynch A, Eldridge M. illuminaHumanv4.db: IlluminaHumanHT12v4 annotation data (chip illuminaHumanv4). R package version 1.26.0; 2015.
- Zhang H, Meltzer P, Davis S, et al. RCircos: an R package for Circos 2D track plots. BMC Bioinf. 2013;14(1). doi:10.1186/1471-2105-14-244
- Kejin H. Become Competent in generating RNA-seq heat maps in one day for novices without prior R experience. Methods Mol Biol. 2021;2239:269–303. doi:10.1007/978-1-0716-1084-8_17
- Szklarczyk D, Gable AL, Nastou KC, et al. The STRING database in 2021: customizable protein-protein networks, and functional characterization of user-uploaded gene/measurement sets. Nucleic Acids Res. 2021;49(D1):D605–D612. doi:10.1093/nar/gkaa1074
- Salomé PA, Merchant SS. Co-expression networks in Chlamydomonas reveal significant rhythmicity in batch cultures and empower gene function discovery. Plant Cell. 2021;33(4):1058–1082. doi:10.1093/plcell/koab042
- Guangchuang Y. Clusterprofiler: an R package for comparing biological themes among gene clusters. OMICS. 2012;16(5):284 7. doi:10.1089/omi.2011.0118
- Rosell DR. Spatiotemporal distribution of gp130 cytokines and their receptors after status epilepticus: comparison with neuronal degeneration and microglial activation. Neuroscience. 2003;122(2):329–348. doi:10.1016/s0306-4522(03)00593-1
- Tibshirani R. The lasso method for variable selection in the Cox model. Stat Med. 1997;16(4):385–395. doi:10.1002/(SICI)1097-0258(19970228)16:4<385::AID-SIM380>3.0.CO;2-3
- Robin X, Turck N, Hainard A, et al. pROC: an open-source package for R and S+ to analyze and compare ROC curves. BMC Bioinf. 2011;12(1):77. doi:10.1186/1471-2105-12-77
- Chen Y, Wang X. miRDB: an online database for prediction of functionalmicroRNA targets. Nucleic Acids Res. 2020;48(D1):D127–D131. doi:10.1093/nar/gkz757
- Shannon P, Markiel A, Ozier O, et al. Cytoscape: a software environment for integrated models of biomolecular interaction networks. Genome Res. 2003;13(11):2498–2504. doi:10.1101/gr.1239303
- Wilkerson MD, Neil Hayes D. ConsensusClusterPlus: a class discovery tool with confidence assessments and item tracking. Bioinformatics. 2010;26(12):1572–1573. doi:10.1093/bioinformatics/btq170
- Ritchie ME, Phipson B, Wu D, et al. limma powers differential expression analyses for RNA-sequencing and microarray studies. Nucleic Acids Res. 2015;43(7):e47. doi:10.1093/nar/gkv007
- Yoshihara K, Shahmoradgoli M, Martínez E, et al. Inferring tumour purity and stromal and immune cell admixture from expression data. Nat Commun. 2013;4:2612.
- Gu Z, Eils R, Schlesner M. Complex heatmaps reveal patterns and correlations in multidimensional genomic data. Bioinformatics. 2016;32(18):2847–2849. doi:10.1093/bioinformatics/btw313
- The Gene Ontology Consortium. The gene ontology resource: 20 years and still GOing strong. Nucleic Acids Res. 2019;47(D1):D330–D338. doi:10.1093/nar/gky1055.
- Kanehisa M, Goto S. KEGG: kyoto encyclopedia of genes and genomes. Nucleic Acids Res. 2000;28(1):27–30. doi:10.1093/nar/28.1.27
- Subramanian A, Tamayo P, Mootha VK, et al. Gene set enrichment analysis: a knowledge-based approach for interpreting genome-wide expression profiles. Proc Natl Acad Sci U S A. 2005;102(43):15545–15550. doi:10.1073/pnas.0506580102
- Liberzon A, Birger C, Thorvaldsdóttir H, et al. The Molecular Signatures Database (MSigDB) hallmark gene set collection. Cell Syst. 2015;1(6):417–425. doi:10.1016/j.cels.2015.12.004
- Langfelder P, Steve H. WGCNA: an R package for weighted correlation network analysis. BMC Bioinf. 2008;9:559. doi:10.1186/1471-2105-9-559
- Chen B, Khodadoust MS, Liu CL, Newman AM, Alizadeh AA. Profiling Tumor Infiltrating 584 Immune Cells with CIBERSORT. Methods Mol Biol. 2018;1711:243–259.
- GOLD. Global strategy for prevention, diagnosis, and management of COPD: 2024 Report. View list of references for the 2024 Pocket Guide. Available from: https://goldcopd.org/2024-gold-report/. Accessed June 14, 2024.
- Chai Q, Yu S, Zhong Y, et al. A bacterial phospholipid phosphatase inhibits host pyroptosis by hijacking ubiquitin. Science. 2022;378(6616):eabq0132. doi:10.1126/science.abq0132
- Chao B, Jiang F, Bai H, et al. Predicting the prognosis of glioma by pyroptosis-relatedsignature. J Cell Mol Med. 2022;26(1):133–143. doi:10.1111/jcmm.17061
- Zhou Z, He H, Wang K, et al. Granzyme A from cytotoxic lymphocytes cleaves GSDMB to trigger pyroptosis in target cells. Science. 2020;368(6494):eaaz7548. doi:10.1126/science.aaz7548
- Hou J, Zhao R, Xia W, et al. PD-L1-mediated gasdermin C expression switches apoptosis to pyroptosis in cancer cells and facilitates tumour necrosis. Nat Cell Biol. 2020;22(10):1264–1275. doi:10.1038/s41556-020-0575-z
- Clarke TB, Weiser JN. Intracellular sensors of extracellular bacteria. Immunol Rev. 2011;243(1):9–25. PMID: 21884164. doi:10.1111/j.1600-065X.2011.01039.x.
- Strober W, Murray PJ, Kitani A, Watanabe T. Signalling pathways and molecular interactions of NOD1 and NOD2. Nat Rev Immunol. 2006;6(1):9–20. PMID: 16493424 doi:10.1038/nri1747.
- Tukhvatulin AI, Logunov DY, Gitlin II, et al. A in vitro and in vivo study of the ability of NOD1 ligands to activate the transcriptional factor NF-kB. Acta Naturae. 2011;3(1):77–84. doi:10.32607/20758251-2011-3-1-77-84
- Yu JS, Jin J, Li YY. The physiological functions of IKK-selective substrate identification and their critical roles in diseases. STEMedicine. 2020;1(4):e49. doi:10.37175/stemedicine.v1i4.49
- Di Stefano A, Ricciardolo FLM, Caramori G, et al. Bronchial inflammation and bacterial load in stable COPD is associated with TLR4 overexpression. Eur Respir J. 2017;49(5):1602006. doi:10.1183/13993003.02006-2016
- Han G, Li M, Du J, Chen Y, Xu C. Nucleotide-oligomerizing domain-1 activation exaggerates cigarette smoke-induced chronic obstructive pulmonary-like disease in mice. Int J Chron Obstruct Pulmon Dis. 2021;16:2605–2615.
- de Torre-Minguela C, Gómez AI, Couillin I, Pelegrín P, de Torre-Minguela C. Gasdermins mediate cellular release of mitochondrial DNA during pyroptosis and apoptosis. FASEB J. 2021;35(8):e21757. PMID: 34233045 doi:10.1096/fj.202100085R.
- Yu J, Li S, Qi J, et al. Cleavage ofGSDME by caspase-3 determines lobaplatin-induced pyroptosis in colon cancer cells. Cell Death Dis. 2019;10(3):193. doi:10.1038/s41419-019-1441-4
- Jiang M, Wu Y, Qi L, et al. Dihydroartemisinin mediating PKM2-Caspase-8/3-GSDME axis for pyroptosis in esophageal squamous cell carcinoma. Chem Biol Interact. 2021;350:109704. doi:10.1016/j.cbi.2021.109704
- Xia W, Li Y, Wu M, et al.. Gasdermin E deficiency attenuates acute kidney injury by inhibiting pyroptosis and inflammation. Cell Death Dis. 2021;12(2):139. PMID: 33542198; PMCID: PMC7862699. doi:10.1038/s41419-021-03431-2
- Tan G, Huang C, Chen J, Chen B, Zhi F. Gasdermin-E-mediated pyroptosis participates in the pathogenesis of Crohn’s disease by promoting intestinal inflammation. Cell Rep. 2021;35(11):109265. PMID: 34133932 doi:10.1016/j.celrep.2021.109265.
- Wan X, Li J, Wang Y, et al. H7N9 virus infection triggers lethal cytokine storm by activating gasdermin E-mediated pyroptosis of lung alveolar epithelial cells. Natl Sci Rev. 2021;9(1):nwab137. PMID: 35087672; PMCID: PMC8788236. doi:10.1093/nsr/nwab137.
- Planès R, Pinilla M, Santoni K, et al. Human NLRP1 is a sensor of pathogenic coronavirus 3CL proteases in lung epithelial cells. Mol Cell. 2022;82(13):2385–2400.e9. PMID: 35594856; PMCID: PMC9108100. doi:10.1016/j.molcel.2022.04.033.
- Miao Y, Chen Y, Xue F, et al.. Contribution of ferroptosis and GPX4’s dual functions to osteoarthritis progression. EBioMedicine PMID: 35101656; PMCID: PMC8822178. 2022;76:103847. doi:10.1016/j.ebiom.2022.103847
- Xue Q, Yan D, Chen X, et al. Copper-dependent autophagic degradation of GPX4 drives ferroptosis. Autophagy. 2023;19(7):1982–1996. PMID: 36622894; PMCID: PMC10283421. doi:10.1080/15548627.2023.2165323.
- Schroder K, Tschopp J. The inflammasomes. Cell. 2010;140(6):821–832. PMID: 20303873 doi:10.1016/j.cell.2010.01.040.
- Bergsbaken T, Fink SL, Cookson BT. Pyroptosis: host cell death and inflammation. Nat Rev Microbiol. 2009;7(2):99–109. doi:10.1038/nrmicro2070
- Shi J, Zhao Y, Wang Y, et al. Inflammatory caspases are innate immune receptors for intracellular LPS. Nature. 2014;647(514):187. doi:10.1038/nature13683
- Papoff G, Presutti D, Lalli C, et al. CASP4 gene silencing in epithelial cancer cells leads to impairment of cell migration, cell-matrix adhesion and tissue invasion. Sci Rep. 2018;8(1):17705. PMID: 30531914; PMCID: PMC6286322. doi:10.1038/s41598-018-35792-8.
- Cheng KT, Xiong S, Ye Z, et al. Caspase-11-mediated endothelial pyroptosis underlies endotoxemia-induced lung injury. J Clin Invest. 2017;127(11):4124–4135; PMID: 28990935; PMCID: PMC5663346. doi: 10.1172/JCI94495
- Wang Q, Imamura R, Motani K, et al. Pyroptotic cells externalize eat-me and release find-me signals and are efficiently engulfed by macrophages. Int Immunol. 2013;25(6):363–372. doi:10.1093/intimm/dxs161
- Hsu SK, Li CY, Lin IL, et al. Inflammation-related pyroptosis, a novel programmed cell death pathway, and its crosstalk with immune therapy in cancer treatment. Theranostics. 2021;11(18):8813–8835. doi:10.7150/thno.62521