Abstract
Introduction
Pulmonary emphysema causes several electrocardiogram changes, and one of the most common and well known is on the frontal P-wave axis. P-axis verticalization (P-axis > 60°) serves as a quasidiagnostic indicator of emphysema. The correlation of P-axis verticalization with the radiological severity of emphysema and severity of chronic obstructive lung function have been previously investigated and well described in the literature. However, the correlation of P-axis verticalization in emphysema with other P-indices like P-terminal force in V1 (Ptf), amplitude of initial positive component of P-waves in V1 (i-PV1), and interatrial block (IAB) have not been well studied. Our current study was undertaken to investigate the effects of emphysema on these P-wave indices in correlation with the verticalization of the P-vector.
Materials and methods
Unselected, routinely recorded electrocardiograms of 170 hospitalized emphysema patients were studied. Significant Ptf (s-Ptf) was considered ≥40 mm.ms and was divided into two types based on the morphology of P-waves in V1: either a totally negative (−) P wave in V1 or a biphasic (+/−) P wave in V1.
Results
s-Ptf correlated better with vertical P-vectors than nonvertical P-vectors (P = 0.03). s-Ptf also significantly correlated with IAB (P = 0.001); however, IAB and P-vector verticalization did not appear to have any significant correlation (P = 0.23). There was a very weak correlation between i-PV1 and frontal P-vector (r = 0.15; P = 0.047); however, no significant correlation was found between i-PV1 and P-amplitude in lead III (r = 0.07; P = 0.36).
Conclusion
We conclude that increased P-tf in emphysema may be due to downward right atrial position caused by right atrial displacement, and thus the common assumption that increased P-tf implies left atrial enlargement should be made with caution in patients with emphysema. Also, the lack of strong correlation between i-PV1 and P-amplitude in lead III or vertical P-vector may suggest the predominant role of downward right atrial distortion rather than right atrial enlargement in causing vertical P-vector in emphysema.
Introduction
Pulmonary emphysema is a form of chronic obstructive lung disease characterized by lung hyperinflation, caused by destruction of structures feeding the alveoli, mainly as a result of long-term smoking and rarely due to alpha 1-antitrypsin deficiency. Several electrocardiogram (ECG) changes occur with pulmonary emphysema and may serve as diagnostic markers for the disease. P-wave verticalization is a quasidiagnostic indicator of emphysema, and has long been described in the literature.Citation1–Citation10 It also bears a negative correlation with the degree of obstructive lung function and structural severity of the disease.Citation3,Citation6–Citation8 Though several other ECG parameters have been well investigated in emphysema, its effects on the P-wave indices, namely P-terminal force in V1 (Ptf), amplitude of initial positive component of P-wave in V1 (i-PV1) and interatrial block (IAB), have not been well described by previous studies. Our current investigation was thus undertaken to study the effects of emphysema on these P-wave indices and their correlation with P-vector verticalization.
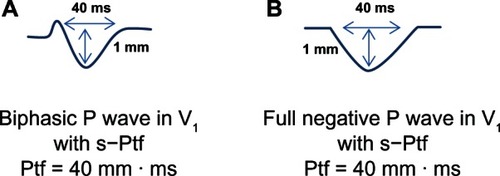
Ptf is calculated by multiplying the duration of the terminal negative phase of P-wave in V1 (in milliseconds) by its depth in millimeters (). Ptf magnitude of ≥40 mm.ms, along with the presence of IAB (P-wave duration >110 ms), is considered a highly specific sign for left atrial enlargement.Citation11 Since the terminal component of V1 is generated by the left atrium, we determined to measure if emphysema would serve as a confounding factor for Ptf as a criterion for left atrial enlargement, due to its anatomical consequences on the diaphragm and mediastinum. Amplitude of i-PV1 >1.5 mm is an established ECG criterion for right atrial enlargement.Citation12 We also wanted to see correlation of this finding with the vertical P-vector and P-amplitude in inferior leads in emphysema patients.
Figure 1 (A and B) Schematic illustration of how to calculate Ptf.
Abbreviation: s-Ptf, significant P-terminal force.
Materials and methods
Unselected, routinely recorded ECGs of 200 hospitalized patients of age >45 years and established diagnosis of pulmonary emphysema, based on clinical history, pulmonary function tests, and radiological studies, were reviewed. ECGs with nonsinus and paced rhythms, and poor quality tracings were excluded, leaving 176 good-quality tracings in normal sinus rhythm. Patients <45 years of age were excluded because a vertical P-wave axis may be a normal finding in healthy children and young adults.Citation1,Citation3,Citation8–Citation10 The ECGs were then analyzed individually by three authors using a handheld 10× loop magnifier to determine the P-wave indices. Any differences in the individual observations were resolved in a conference consensus.
Frontal P-wave axis/P-vector was calculated by using the P-wave amplitudes in leads I, III and aVL. P-vectors were considered vertical (>60°) if P-wave amplitude in lead III was greater than in lead I or if net P-wave amplitude in lead aVL was negative.Citation3,Citation8–Citation10 Ptf was calculated by multiplying the duration of the terminal negative phase of P-waves in V1 (in milliseconds) and the depth of the terminal negative component of P-waves (in millimeters). A negative Ptf of more than 40 mm.ms (ie, Ptf ≥40 mm.ms) was considered significant (s-Ptf). In our study, we divided the Ptf into two categories, based upon whether it was secondary to a biphasic P-wave in V1 or due to a totally negative P-wave in V1. For calculation of Ptf in biphasic P-waves, the duration and amplitude of terminal negative component of P-waves in V1 were used, but for the calculation of Ptf in fully negative P-waves, the duration and amplitude of the whole negative P-wave in V1 were utilized. IAB was considered to be present if P-wave duration was ≥120 ms for the purposes of our current investigation, in order to achieve good interobserver reproducibility, since it is easy to visualize multiples of one small ECG square with the aid of a magnifier.Citation11–Citation16
Dichotomous data were collected for the presence or absence of P-vector verticalization, IAB, and s-Ptf. The categorical data were analyzed using the chi-squared test with Yates’s correction. The Pearson correlation test was used to determine correlation between the amplitude of i-PV1 and frontal P-vector and also between i-PV1 and P-amplitude in lead III. A two-sided P-value <0.05 was considered statistically significant. Statistical analyses were performed using GraphPad Prism version 6 (GraphPad Software, La Jolla, CA, USA).
Results
Mean age (±standard deviation) of the study population was 65.4 ± 10.2 years (n = 176), of which 48% were males. A total of 147 patients (83.5%) had an active or remote history of smoking. Mean (±standard deviation) forced expiratory volume at 1 second of the study population was 50.2% (±18.5). All patients enrolled in the investigation had a documented diagnosis of pulmonary emphysema supported by clinical history, pulmonary function test results, and radiological studies, either chest radiograph (with findings of increased radiolucency of the lungs, flat diaphragm, and a long, narrow heart shadow) or computerized tomographic scan of the chest showing emphysematous changes. summarizes the results of P-wave indices. A total of 125 patients (71%) had vertical P-axis (>60°), 69 patients (39.2%) had interatrial block, and 93 patients (52.8%) had significant Ptf (≥40 mm.ms).
Table 1 Incidence of IAB, s-Ptf and type of P-wave morphology in lead V1 in emphysema patients based upon the presence of vertical or non-vertical P-vector
Relation between significant P-terminal force and vertical P-vector
A total of 73 of 125 (58.4%) emphysema patients with vertical P-axis had s-Ptf, while only 20 of 51 (39.2%) emphysema patients with nonvertical P-axis had s-Ptf. In other words, of 93 patients who had s-Ptf, 73 (78.5%) had vertical P-vectors. Thus, s-Ptf was found to have a statistically significant correlation with vertical P-vectors (P = 0.03) ().
We also attempted to estimate the correlation of the two types of s-Ptf, viz biphasic or totally negative P-wave morphology in V1. In general, totally negative P-waves in V1 leading to s-Ptf were more common in emphysema. Of 93 emphysema patients who had s-Ptf, 67 (72%) had a fully negative P-wave in V1. There was no statistically significant difference in the types of s-Ptf found in emphysema patients with either vertical or nonvertical P-vectors (P = 0.28) ().
Relation between IAB and vertical P-vector
IAB was prevalent in 69 of 176 (39.2%) emphysema patients. A total of 45 of 69 patients (65.2%) with IAB had vertical P-vectors, whereas, 24 of 69 patients (34.8%) with IAB had nonvertical P-vectors. The distribution pattern was not statistically significant among the two groups (P = 0.23) ().
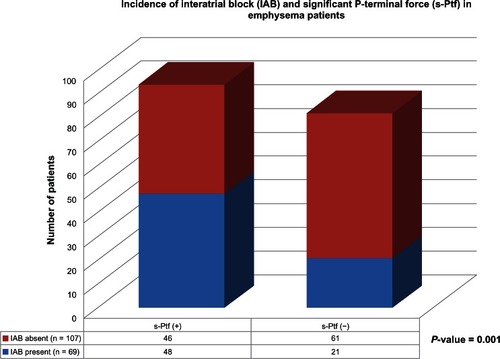
Relation between s-Ptf and IAB
The overall incidence of s-Ptf was 52.8% (93 of 176 patients), and IAB was 39.2% (69 of 176 patients) (). A total of 48 of 69 (70%) patients with IAB had s-Ptf, while 61 of 107 (57%) patients without IAB did not have s-Ptf. The association between IAB and s-Ptf was highly significant (P = 0.001) ().
Figure 2 Schematic illustration of the incidence of interatrial block (IAB) and significant P-terminal force (s-Ptf) in emphysema patients.
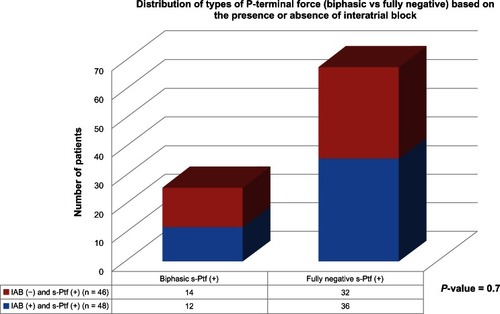
In addition, we attempted to determine if a particular type of s-Ptf (biphasic vs fully negative P-wave in V1) better correlated with the presence of IAB. The results showed that fully negative P-waves in V1 were more common in both types of patients, either with or without IAB. Neither type of P-morphology in V1 better correlated with the presence of IAB when s-Ptf was present (P = 0.7) ().
Figure 3 Distribution of types of P-terminal force (Biphasic vs. Fully negative) based on the presence or absence of interatrial block.
Amplitude of initial positive P-component in V1 and its relation with P-vector
i-PV1 >1.5 mm is a known ECG sign of right atrial enlargement or right atrial strain, and was found to be prevalent in only five of 176 emphysema patients (2.8%). All five patients who had i-PV1 >1.5 mm had a vertical P-vector, while no patient with non-vertical P-vector had i-PV1 >1.5 mm (P = 0.3).
There was a very weak overall correlation between the degree of P-vector and magnitude of i-PV1 in all emphysema patients (Pearson correlation coefficient r = 0.15, P = 0.047).
Relation between i-PV1 and P-amplitude in leads II and III
Since i-PV1 and P-amplitude in leads II and III all represent right atrial abnormality, a correlation was performed among these parameters. We did not find any significant correlation between i-PV1 and P-amplitude in lead III (Pearson correlation coefficient r = 0.07, P = 0.36).
P-amplitude in lead II >2.5 mm is called P pulmonale, and is known to reflect right atrial enlargement or right atrial abnormality. Prevalence of P pulmonale in our study was found in only 5% of emphysema patients (nine of 176 patients).
Discussion
Ptf on ECG accounts for left atrial activity, and previous studies have revealed that significant Ptf (≥40 mm.ms) is a highly specific sign for left atrial enlargement.Citation11–Citation13 IAB represents an interatrial conduction delay and often accompanies an enlarged left atrium, though it may be present in the absence of left atrial enlargement. Ptf and IAB are often together referred to as signs of left atrial abnormality.Citation11–Citation13 Emphysema or chronic obstructive pulmonary disease tends to cause right heart overload, in turn commonly manifesting as signs of right atrial abnormality on electrocardiogram. Conceptually, emphysema should directly exert little effect on the left atrium, except indirectly decreasing the left atrial filling rate, especially during exacerbation resulting from right heart overload. In that respect, one can project that ECG changes sometimes may transiently mimic a left atrial or rather biatrial abnormality. In our study, prevalence of IAB was around 40%, which is comparable to the general prevalence of IAB in this age-group, as shown by previous studies.Citation14–Citation17 s-Ptf and IAB showed a significant correlation in our study results, which is not very surprising, as both ECG parameters are markers of left atrial abnormality, and the presence of one may increase the likelihood of presence of the other parameter. Previous studies including echovolumetric investigations have shown that in the presence of IAB, the left atrium is often hypocontractile.Citation18
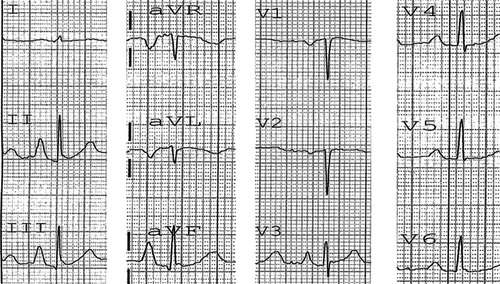
The results of our study clearly show that Ptf is affected by emphysema. In fact, the most commonly encountered type of s-Ptf was due to a fully negative P-wave morphology in V1 (). These results are very interesting, and in fact quite contradictory to what one would expect in emphysema. Anatomically, the right atrium is anterior to the left atrium, and the left atrium is a posterior structure. The right atrium depolarizes toward lead V1, tending to cause an initial positive deflection, and the left atrium depolarizes later and posteriorly, tending to cause a negative P-deflection (negative Ptf) in V1. One should expect an increased amplitude of i-PV1 (>1.5 mm) in emphysema due to right atrial enlargement/abnormality; however, this finding was a rarity in our investigation. In addition, the incidence of totally negative P-waves in V1 with an increased Ptf was noted more often. This finding could possibly be due to either net cancellation of right atrial potential by overwhelming left atrial forces, or it could be more likely due to positional displacement of the right atrium. In patients with emphysema, the diaphragm is flat due to lung hyperinflation, and this pulls the heart/right atrium downwards, as the right atrium is attached to it by a dense pericardial ligament.Citation1,Citation3,Citation19 Thus, in emphysema, although the lead placement of V1 on the chest surface may be standard, in actuality it monitors electrical forces of a much lower-situated heart (right atrium), which probably records the atrial depolarization forces going away from lead V , resulting in a negative P-deflection.
Figure 4 Electrocardiogram of a patient with emphysema.
Our results show that P pulmonale and i-PV1 >1.5 mm carry poor sensitivity by themselves in diagnosing emphysema, as these findings were present in only about 5% and 3% of emphysema patients, respectively. Degree of P-vector and i-PV1 carried a very weak correlation, and P-amplitude in lead III and i-PV1 similarly carried no significant correlation, which may suggest that verticalization of P-vector in emphysema might be a more functional outcome of diaphragmatic depression from severe emphysema rather than right atrial strain or right atrial enlargement. Previous studies have postulated several reasons for vertical P-vector in emphysema, like right atrial enlargement or right atrial strain from right heart overload, chronic hypoxemia, and right atrial distortion.Citation5 Our current investigation reveals that though all these factors may potentially contribute to P-vector verticalization in emphysema, the major role is played by right atrial/mediastinal displacement resulting from pulmonary hyperinflation. Our study results are also consistent with one of the previous echovolumetric investigations, which found a lack of correlation between P pulmonale and right atrial overload in chronic obstructive pulmonary disease patients.Citation20
Limitations
The diagnosis of emphysema was not based on high-resolution computed tomography scans in all study patients, which are known to have higher sensitivity and specificity for diagnosing structural emphysematous changes. Our investigation lacked a control group, as all patients in our study had a diagnosis of emphysema. Echocardiographic correlations were not performed for the observed ECG findings in our study.
Conclusion
s-Ptf is often present in patients with emphysema, and occurs likely as a result of the direct effects of emphysema on atrial anatomy. Vertical P-vectors in emphysema patients better correlate with s-Ptf, as compared with a nonvertical P-vectors.
Totally negative P-waves rather than biphasic P-wave morphology in V1 leading to s-Ptf are more common in emphysema. There was, however, no statistically significant difference in the incidence of types of s-Ptf (viz totally negative P-wave in V1 vs. biphasic P-wave in V1) in emphysema patients with either vertical or nonvertical P-vectors.
There was no significant correlation between i-PV1 and P-amplitude in lead III, suggesting that verticalization of P-vectors in emphysema might be a more functional outcome of diaphragmatic depression from severe emphysema rather than right atrial strain or right atrial enlargement.
Disclosure
The authors report no conflicts of interest in this work.
References
- SpodickDHElectrocardiographic studies in pulmonary disease. I. Electrocardiographic abnormalities in diffuse lung diseaseCirculation1959201067107213833426
- ZuckermanRCabreraCEFishlederBLSodi-PallaresDThe electrocardiogram in chronic cor pulmonaleAm Heart J19483542142518903667
- ChhabraLSareenPPerliDSrinivasanISpodickDHVertical P-wave axis: the electrocardiographic synonym for pulmonary emphysema and its severityIndian Heart J201264404222572424
- SpodickDHVectorcardiogram in pulmonary emphysema: its relation to scalar electrocardiographic findingsAm Rev Respir Dis1968986346394234113
- ChhabraLSpodickDHTransient super-Himalayan P-waves in severe pulmonary emphysemaJ Electrocardiol201245262721907999
- ChhabraLSareenPGandaguleASpodickDHVisual computed tomographic scoring of emphysema and its correlation with its diagnostic electrocardiographic sign: the frontal P vectorJ Electrocardiol20124513614022244933
- ChhabraLSareenPGandaguleASpodickDComputerized tomographic quantification of chronic obstructive pulmonary disease as the principal determinant of frontal P vectorAm J Cardiol20121091046104922221942
- BajajRChhabraLBasheerZSpodickDHOptimal electrocardiographic limb lead set for rapid emphysema screeningInt J Chron Obstruct Pulmon Dis20138414423378754
- ThomasAJApiyasawatSSpodickDHElectrocardiographic detection of emphysemaAm J Cardiol20111071090109221306694
- BaljepallyRSpodickDHElectrocardiographic screening for emphysema: the frontal plane P axisClin Cardiol19992222622810084066
- ChhabraLChaubeyVKDevadossRSpodickDHInteratrial block in modern eraCurr Cardiol Rev2013
- SurawiczBKnilansTAtrial abnormalitiesChou’s Electrocardiography in Clinical Practice: Adult and Pediatric6th edPhiladelphiaSaunders Elsevier20083336
- Bayés de LunaAPlatonovPCosicoFInteratrial blocks. A separate entity from left atrial enlargement: a consensus reportJ Electrocardiol20124544545122920783
- AsadNSpodickDHPrevalence of interatrial block in a general hospital populationAm J Cardiol20039160961012615274
- JairathUCSpodickDHExceptional prevalence of interatrial block in a general hospital populationClin Cardiol2001142823827
- ChhabraLSrinivasanISareenPAnandCSpodickDHInteratrial block – a novel risk factor for acute mesenteric ischemiaIndian J Gastroenterol201231191194
- GialafosEPsaltopoulouTGPrevalence of Interatrial block in young healthy men , 35 years of ageAm J Cardiol2007100995997
- GoyalSBSpodickDHElectromechanical dysfunction of the left atrium associated with interatrial blockAm Heart J200114282382711685169
- ShahNSKollerSMJanowerMLSpodickDHDiaphragm levels as determinants of P axis in restrictive vs obstructive pulmonary diseaseChest1995107697700
- MaedaSKatsuraHChidaKLack of correlation between P pulmonale and right atrial overload in chronic obstructive airways diseaseBr Heart J1991651321362015120