
 ?Mathematical formulae have been encoded as MathML and are displayed in this HTML version using MathJax in order to improve their display. Uncheck the box to turn MathJax off. This feature requires Javascript. Click on a formula to zoom.
Abstract
Background
The respiratory tract is a major target of exposure to air pollutants, and respiratory diseases are associated with both short- and long-term exposures. We hypothesized that improved air quality in North Carolina was associated with reduced rates of death from respiratory diseases in local populations.
Materials and methods
We analyzed the trends of emphysema, asthma, and pneumonia mortality and changes of the levels of ozone, sulfur dioxide (SO2), nitrogen dioxide (NO2), carbon monoxide (CO), and particulate matters (PM2.5 and PM10) using monthly data measurements from air-monitoring stations in North Carolina in 1993–2010. The log-linear model was used to evaluate associations between air-pollutant levels and age-adjusted death rates (per 100,000 of population) calculated for 5-year age-groups and for standard 2000 North Carolina population. The studied associations were adjusted by age group-specific smoking prevalence and seasonal fluctuations of disease-specific respiratory deaths.
Results
Decline in emphysema deaths was associated with decreasing levels of SO2 and CO in the air, decline in asthma deaths–with lower SO2, CO, and PM10 levels, and decline in pneumonia deaths–with lower levels of SO2. Sensitivity analyses were performed to study potential effects of the change from International Classification of Diseases (ICD)-9 to ICD-10 codes, the effects of air pollutants on mortality during summer and winter, the impact of approach when only the underlying causes of deaths were used, and when mortality and air-quality data were analyzed on the county level. In each case, the results of sensitivity analyses demonstrated stability. The importance of analysis of pneumonia as an underlying cause of death was also highlighted.
Conclusion
Significant associations were observed between decreasing death rates of emphysema, asthma, and pneumonia and decreases in levels of ambient air pollutants in North Carolina.
Introduction
Air pollution has a deleterious impact on human health,Citation1–Citation6 with global outdoor air pollutants estimated to account for approximately 1.4% of total mortality and 2% of all cardiopulmonary mortality.Citation7 Both ambient particlesCitation4,Citation8,Citation9 and such gases as nitrogen dioxide (NO2), ozone (O3), and carbon monoxide (CO) have been shown to increase total, cardiovascular, and respiratory (predominantly due to lung cancer and chronic obstructive pulmonary disease [COPD]) mortality and morbidity.Citation3,Citation10,Citation11 While the impact on any individual’s risk of death has been thought to be relatively modest per se, the overall impact of air pollution on the health of an exposed population makes it a major public health concern.Citation12
While more studies on short-term impacts of changes of air quality are available (such as the legislated traffic holidays during the 1996 Atlanta Olympic GamesCitation13 and the 2008 Beijing Olympic GamesCitation14), less is known about the long-term effects of changing air quality on the health of exposed populations. For example, a ban on heating-coal sales in Dublin was thought to be associated with both reduced pollution from airborne particulate matters (PMs) and 5.7% reduction in all-cause, 15.5% reduction in respiratory, and 10.3% reduction in cardiovascular mortality.Citation15 However, these results were considered inconclusive, due to the complexity and expense of evaluating the health effects of air pollution on populations.Citation16,Citation17 Since the 1990s, a variety of acts, standards, and requirements in the US have been adopted to improve air quality. For example, increasingly stringent national gasoline and automotive engine requirements have been applied, resulting in a decrease of CO, NOx, PM, and volatile organic compounds in the air. At the state level, North Carolina in 1992 entered into the Southern Appalachian Mountains Initiative, leading to the development of the Clean Smokestacks ActCitation18 to mandate reduced emissions from coal-fired power plants.Citation19
While few studies have analyzed the associations of both air quality and health over a long period, and they were typically limited to analysis of a specific air pollutant or a couple of pollutants, we were able to study longitudinally a number of air contaminants, including both PMs and noxious gases. In addition, we analyzed both air quality and health outcomes over almost two decades (1993–2010). Because respiratory morbidity and mortality are affected by changes in air quality,Citation20–Citation22 we evaluated the associations between the changes of the levels of PM10 and PM2.5, ozone, CO, NO2, and SO2 in the air and death rates of emphysema, asthma, and pneumonia.
Materials and methods
Data
We analyzed mortality rates for emphysema (International Classification of Diseases [ICD]-9 code 492, ICD-10 code J43), asthma (ICD-9 code 493, ICD-10 codes J45, J46), and pneumonia (ICD-9 codes 480.0, 480.1, 480.2, 480.9, 485, 486, 487.0, 487.1, ICD-10 codes J11.00, J11.1, J12.0, J12.1, J12.2, J12.9, J18.0, J18.9) in North Carolina from 1983 to 2010 using the data from the Vital Statistics National Center for Health Statistics Multiple Cause of Death dataset. We started the mortality analysis with the data from 1983, but could only analyze air quality when monitoring data were available, ie, 1993–2010. The mortality data enabled an analysis of a longer period of death-rate dynamics, thus allowing to observe the dynamics of disease-specific mortality before the measured reduction in particulate and gaseous emissions in North Carolina. Age-adjusted death rates (per 100,000 of population) were calculated using 5-year age-groups and standard 2000 North Carolina population. The data on population were provided by the Surveillance Epidemiology and End Results Registry (SEER) at http://www.seer.cancer.gov/popdata/download.html.
Data on concentrations of PM2.5 (μg/m3), PM (μg/m3 10), ozone (ppb), CO (ppb), NO2 (ppb), and SO2 (ppb) in the air in 1993–2010 were obtained from the US Environmental Protection Agency (EPA) (http://www.epa.gov/ttn/airs/airsaqs/detaildata/downloadaqsdata.htm). We used the averaged month-specific concentrations of air pollutants for North Carolina to further analyze them for associations with the dynamics of cause-specific monthly mortality in the state. A two-stage averaging procedure was used to avoid heterogeneity in the numbers of measurements made in certain days of the month: first, we calculated the day-specific means, and then these values were averaged, resulting in month-specific means. Negative values were excluded, and measurements with various units were converted to μg/m3 for PM2.5 and PM10, and to ppb for ozone, CO, NO2, and SO2. Since the data on air pollutants represented different methods of registration during different durations of sample collection (ie, the length of time used to acquire a sample measurement), an auxiliary analysis was performed to check whether the specific method could be considered as an outlier and therefore excluded from the analyses.
Also, data on the prevalence of tobacco use for 1995–2010 were obtained from the Centers for Disease Control and Prevention Behavioral Risk Factor Surveillance System survey for age–groups 18–24, 25–34, 35–44, 45–54, 55–64, and 65+ years (http://www.cdc.gov/brfss).
Ethics statement
The data used in this study have no individual identifiable information. No specific procedures were required for de-identification of the records. All data analyses were designed and performed in accordance with the ethical standards of the committee on human experimentation and with the Helsinki Declaration (1975, revised in 1983), and were approved by the Duke University Health System Institutional Review Board.
Methods
Trends of cause-specific death rates and of levels of air contaminants were analyzed for correlations. Adjustment by smoking prevalence and seasonal fluctuations in respiratory deaths (for monthly death rates of emphysema, asthma, and pneumonia) were included in a log-linear model that was used to evaluate the associations between the level of each studied air pollutant and the death rates, as follows:
where u was the intercept, β1 represented the effect of each studied air pollutant depending on its concentration (denoted by c) measured in its units (as described in the Data section), β2 represented the effect of smoking prevalence (denoted by s), μm represented the effects of 11 months (January to November for each year) in respect of December (Im is the month indicator), and ε stood for random residuals. Note that if the air-pollutant concentration changes by one unit of its measured level in the air, the rate r changes by the factor of exp(β1). For multiple comparisons, the Bonferroni correction was applied.
Sensitivity analysis
The potential effect of ICD code changes (from ICD-9 to ICD-10), the seasonal fluctuation of air pollutants and mortality during summer and winter, and the analysis validity when only the underlying causes of deaths contributed to the cause-specific death rates were tested. In addition, sensitivity analysis was performed for county-level data on respiratory mortality and air-pollutant levels. Only counties for which the data on air quality were directly measured by monitoring stations were included in the analysis: 37 counties for ozone measurements, 11 counties for NO2, 22 counties for SO2, 16 counties for CO, and 37 counties for PM2.5 and PM10 measurements. As in the main analysis, dynamics of smoking prevalence (on state level) and seasonal fluctuations in respiratory mortality were used for adjustments of the results.
Results
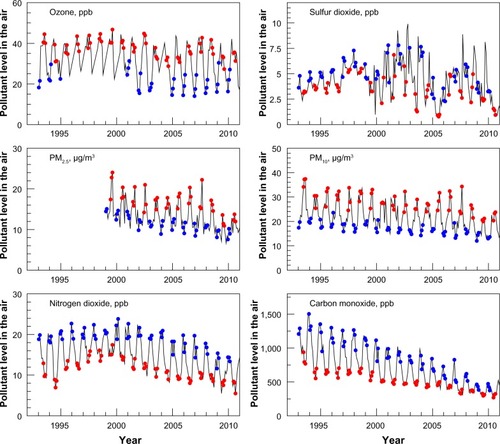
We analyzed up to 180 month-specific measurements of each of the studied air pollutants recorded at multiple monitoring sites in North Carolina (see for detailed air pollutant-specific information). We found air quality in North Carolina gradually improving over time, primarily due to decreasing PM10, NO2, and CO levels. These decreases became more pronounced from 2002 (see ; note that individual pollutants were placed onto a single graph by utilizing the arbitrary units to enable a collective visualization of the trends). The following seasonal fluctuations of pollutants levels were observed (): levels of ozone, PM2.5, and PM10 were higher in summer, while levels of SO2, NO2, and CO were higher in winter.
Table 1 Measurements of air pollutants used in the study, 1993–2010
Figure 1 Levels of six air pollutants in North Carolina, 1993–2011. Individual pollutants were placed onto a single graph by utilizing arbitrary units to enable a collective visualization of the trends.
Abbreviation: PM, particulate matter.
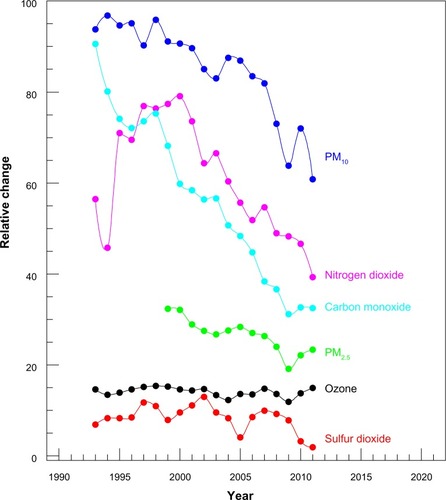
Figure 2 Seasonal fluctuations of air-pollutant levels: summer (red, 3 months) and winter (blue, 3 months), 1993–2011.
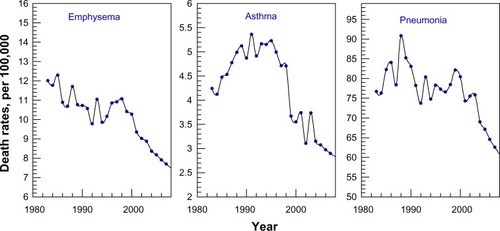
Since 1983, the death rates of three studied diseases have been decreasing (), with declines in emphysema death rates more dramatic since 1998, for asthma since 1995, and for pneumonia since 1990. From 1993 to 2010, 101,374 deaths in North Carolina were caused by pneumonia, 13,187 by emphysema, and 5,509 by asthma. The detailed description of the studied population is presented in . Among those who died from emphysema and from pneumonia, 80.7% and 85.9%, respectively, were older than 65 years. For asthma, ages at death were younger: 9.7% were younger than 40 years, and 31.3% were aged 40–64 years old. However, the declining trends of pollutant concentrations and death rates during 1993–2010 do not essentially confirm causality.
Table 2 Demographic characteristics of North Carolina population with cause-specific respiratory mortality, 1993–2010
Figure 3 Trends in death rates for emphysema, asthma, and pneumonia in North Carolina, 1983–2010. Mortality rates were age-adjusted to the 2000 North Carolina population.
The association between the changes of air-pollutant levels and dynamics of disease-specific death rates after being adjusted for smoking prevalence (for respective year and age-group), and by monthly fluctuations in respiratory disease-specific death rates are shown in , for each air pollutant. The disease-specific death rate (number of deaths per 100,000 population) decreased by a factor calculated based on the value of estimate presented in (ie, per decrease of concentration of each pollutant by one unit of measurement: per 1.0 ppb for ozone, SO2, NO2, CO, and per 1.0 μg/m3 for PM2.5 and PM10). For example, the estimate for emphysema in means that if the SO2 level decreases by 1 ppb, the emphysema death rate (per 100,000 population) can be predicted to decrease by a factor of exp(0.0547) =1.056. Similar interpretation can be developed for smoking estimates, keeping in mind that smoking is represented by its prevalence in population measured in percentages, and thus the respective exponential factor corresponds to a change in smoking prevalence by 1%.
Table 3 Associations between trends in emphysema, asthma, and pneumonia death rates and dynamics of air pollutants in North Carolina, 1992–2010
Among gaseous pollutants, the estimates for associations between reduction of air-pollutant levels and reduction of death rates were significant for SO2 and emphysema (0.0547±0.0106, P<0.0001), asthma (0.0598±0.0173, P<0.001), and pneumonia (0.0309±0.0093, P<0.001), and for CO and emphysema (0.0004±0.0001, P<0.0001) and asthma (0.0006±0.0001, P<0.001). For PM, reduced PM2.5 levels were associated with reduction of emphysema mortality (0.0155±0.0066, P<0.05) and reduced PM10 levels, with reduction of asthma mortality (0.0204±0.0058, P<0.001). As expected, smoking significantly affected the mortality of each disease.
Sensitivity analysis
The sensitivity analysis demonstrated good stability of obtained results (see for detailed information). In the sensitivity analysis, the association between pneumonia mortality and CO levels became significant (P=0.0655 in main versus P<0.0001 in sensitivity analysis) when pneumonia was analyzed as an underlying cause of death. Recent studies have demonstrated that separation of comorbid conditions to underlying and secondary causes can be unreliable;Citation23–Citation25 however, for certain diseases with a predominantly acute course (eg, pneumonia), that may not be the case, and additional information can also be obtained from analysis of underlying causes of death. In addition, sensitivity analysis showed that during summer decreased mortality from emphysema was associated with lower levels of PM10 (P=0.2554 in main versus P=0.017 in sensitivity analysis), and statistical significance was observed for associations between pneumonia mortality and CO levels when ICD code changes were taken into account (P=0.0655 in main versus P=0.018 in sensitivity analysis).
A county-level analysis also demonstrated the stability of most observations in the main analysis. Among associations that were significant under Bonferroni correction in the main analysis, associations between dynamics of SO2 and mortality from emphysema (0.1399, P<0.001) and pneumonia (0.0698, P<0.001), and associations between changes of CO levels and asthma mortality (0.0004, P<0.05) were also significant in the sensitivity analysis. The association between CO and pneumonia mortality was also significant when analysis was performed on a county level (0.0002, P<0.001). Recall that this association was significant in the analysis using state-level data in two cases: when being corrected for changes of ICD codes and when only underlying causes of deaths were considered as contributing to the cause-specific death (see detailed results in ). The effects of dynamics of SO2 and PM10 on asthma mortality became nonsignificant (P>0.05), likely due to the small number of county-specific asthma deaths and due to the large fraction of zeroth death rates that were not successfully described by Equation 1.
Discussion
We found significant correlations between reduction of air pollutants and dynamics of deaths due to respiratory diseases during the period we studied. We need to contextualize these findings, particularly in regard to the multifactorial contributors to respiratory mortality. In general, COPD has been shown to correlate highly with air pollution linked to global urbanization,Citation26 eg, higher prevalence of chronic bronchitis (odds ratio [OR] 2.26, confidence interval [CI] 1.54–3.31), asthma (OR 1.57, CI 1.25–1.98), and emphysema (OR 2.98, CI 1.95–4.54) were observed in the meta-analyses of individuals exposed to urban air.Citation27 Little is known about whether chronic, low-dose exposure to ambient air pollutants can exacerbate COPD progression.Citation28,Citation29 Several recent studies related respiratory symptoms to long-term rather than short-term effects of ambient particles,Citation30 with the long-term exposure to PM10 increasing the risk of COPD.Citation31
Changing air quality in North Carolina could be a good example of analysis of the trends of both improved air quality and respiratory mortality over almost two decades of observations. Improved air quality in North Carolina since the mid-1990s is related to a series of federal and state acts and regulations (see ), including the national heavy-duty truck engine standards, reduction of NOx emissions, the Clean Smokestacks Act, and new engine standards. Regulations of emissions of NOx, PM10, and CO appeared to be very effective in improving air quality in the state. Observed seasonal fluctuations of air-pollutants levels could be due to season-dependent local dispersive conditions, breeze dynamics, differences in concentration process (eg, caused by the thinning of the air mixing layer in winter), and season-specific higher formation of certain compounds, eg, higher nitrate formation in the cold season leads to higher levels of NOx in the air.Citation32 Higher PM levels observed in North Carolina during the summer are of additional concern for health effects being exacerbated by hot humid weather, especially during heat waves.Citation33 For respiratory mortality, no threshold effect has been identified;Citation34,Citation35 therefore, detailed economic analysis is required to evaluate the expenses and benefits of keeping the levels of air pollutants extra low. For current regulations in the US, it has been shown that control of PM2.5 emissions could result in $100 billion of benefits annually.Citation36
Table 4 Timeline of key federal and North Carolina state-specific air regulations and actions
Air quality and emphysema
In our study, the association between reduced levels of ozone, SO2, NO2, CO, and PM2.5 and decreased mortality from emphysema were observed, with associations for SO2 and CO remaining significant under Bonferroni correction. In other studies, emphysema outcomes were usually analyzed as a part of COPD; nonetheless, our findings on emphysema are in general agreement with these publications. For example, higher prevalence of visits to emergency departments for COPD and emphysema have been observed for higher SO2 levelsCitation37 (especially among older adultsCitation38); however, some studies showed that these associations may be attributable to SO2 serving as a surrogate of other substances.Citation39 Few studies are available on the effects of outdoor CO on COPD.Citation40,Citation41 Our results on associations between lower CO levels and lower emphysema mortality are in agreement with studies that showed increased morbidity and mortality risks among patients with COPD.Citation42–Citation45 Note that the impacts of CO could be effectively minimized by controlling transportation activities, which accounts for more than three-quarters of CO emissions in the US.Citation42,Citation46 While in our study associations with PM2.5 became nonsignificant under Bonferroni correction, in other studies higher levels of PM2.5 have been associated with higher admissions for COPD exacerbationCitation47 and with increased COPD mortality.Citation48–Citation50 These differences could be due to the fact that the aforementioned studies were performed outside the US, had different patterns of seasonal fluctuations of PM levels in the air, and also were focused on specific populations (ie, older adults).
Air quality and asthma
We observed decreasing asthma mortality associated with lower levels of NO2, SO2, CO, and PM10, with the latter three pollutants remaining significant under Bonferroni correction. These results are in agreement with other studies. For example, correlations have been reported between asthma mortality and SO2Citation51 and NO2Citation52–Citation56 levels, and between asthma severity (in children) and CO levels.Citation43,Citation44,Citation57 Other studies reported that asthma mortality decreased earlier in response to improvement of air quality (eg, when compared to emphysema or chronic bronchitis),Citation51 with a decrease of asthma deaths occurring approximately 5 years earlier.
The effects of PMs on respiratory health and, in particular, on asthma have been studied predominantly for associations with prevalence of respiratory symptomsCitation58–Citation60 and emergency department visits or hospital admissions.Citation28,Citation61–Citation63 It has been shown that asthma symptoms were exacerbated even at PMs concentrations being 60% below the safety limits for PMs (ie, that supposed not to affect the healthy population).Citation64 However, information on associations of asthma mortality with long-term exposure to PMs is sparse. In our study, reduction of PM10 (and its seasonal fluctuations) was associated with decreased asthma mortality in North Carolina. Previous studies on PM10 showed that elevated levels of PM10 were correlated with hospital admissions for asthma among patients aged 65+ yearsCitation65 and children,Citation44,Citation57 and also with increased use of asthma medications among patients aged from 8 to 72 years old.Citation66
Because air-quality and asthma-aggravation associations are reported from the studies typically performed in a single geographic region over a single season, individual study results may not be applicable to different populations and to longer weather/season cycles.Citation43 Also, different components of PMs (eg, sulfates, nitrates, organic chemicals, metals, and soil or dust particles)Citation12 may have different effects on the respiratory system.Citation16,Citation34,Citation67 This makes comparisons between the studies challenging and may explain the diversity of results on health effects of PMs on both geographic and temporal scales.Citation68
Air quality and pneumonia
In our study, a decrease in pneumonia deaths was associated with decreasing SO2 levels. Also, when pneumonia was considered as the underlying cause of death, lower pneumonia death rates were observed for lower CO levels. Some studies have linked an acute respiratory disease with higher levels of SO2 pollution, independently of cigarette smoking,Citation69 while later studies have not confirmed these associations (however, some results were sensitive to the methods used to estimate air-pollutant levels).Citation70,Citation71 For CO, an association has been reported between its increased concentrations and higher pneumonia hospitalization.Citation45
While some epidemiological and experimental studies have suggested relationships between NO2, ozone, and PMs and increased risk for viral respiratory infections,Citation72 we did not find these associations in our study. Our results are in agreement with another study that did not find positive associations between PMs and pneumonia deaths (they found associations only for the group of never-smokers).Citation73 However, most of the studies were performed on pneumonia morbidity (including hospitalizations and emergency department visits), while our study was on mortality. Also, multiple reports on associations between pneumonia risk and PMs levels come from international studies, eg, from Europe (where PMs levels peak in winter), while on the East Coast of the US they typically peak in summer,Citation74 as we also observed in our study. While pneumonia is more frequent in late fall and winter, the relationships between outdoor air quality and health are supposed to be stronger in summer, when people spend more time outdoors. A study from Boston also supports our findings: no associations with pneumonia hospital admissions were found in summer, while in winter the largest effect on pneumonia morbidity was reported not for PMs but for black carbon (a surrogate for traffic particles: 14.3% increase of pneumonia hospitalizations for 1.7 μg/m3 increase of black carbon).Citation45 Higher risk of morbidity and mortality from acute respiratory infections has been also reported for children exposed to PM10.Citation22,Citation75–Citation85 In our study, we did not estimate mortality risks specifically for children; future studies will be performed for age-groups that are potentially at highest risk (ie, children and older adults).
Methodological aspects and study limitations
In our approach, the number of observations sufficient to estimate model parameters was achieved by incorporating monthly changes of air-pollutant levels and respiratory mortality. One advantage of this approach is that the unobserved heterogeneity due to other factors (such as socioeconomic status, quality of health care, migration) is minimal, because these factors do not essentially vary from month to month. In contrast, this unobserved heterogeneity is typical for ecological studies with area-based design, and could result in the occurrence of additional biases if these variables are not sufficiently controlled.
One example of such a factor is the time trend describing improvements in the treatment of respiratory disease that occurred during the recent two decades and which contributed to decreasing trends of mortality from emphysema, asthma, and pneumonia. Both improved air quality and vaccinations against pneumonia could lead to fewer hospital admissions, eg, pneumonia age-adjusted death rates started declining in the late 1990s, while the hospital discharge rate did not change significantly for patients older than 15 years.Citation86–Citation88 Although our approach with measurements at the month level minimizes the bias from this time trend (because only a 12th of our measurements reflect the annual time trend), improvements in treatment (as well as factors other than air pollution and smoking with significant time trends) should be taken into account in further studies. For example, further analysis of disease-specific visits to emergency departments would be important to validate the role of improved medical care in observed respiratory disease trends.
Other factors, such as changes in socioeconomic status, can also impact the dynamics of disease-specific mortality rates. However, it has been reported that for social factors, as well as for race, the effects of modification, eg, of PMs (ie, PM10) on total mortality were weak.Citation20
In our study, the time pattern of smoking was chosen to reflect annual trends in respiratory mortality in addition to air pollution. Inclusion of one additional variable measured annually (ie, not on a monthly basis) could result in difficulty in distinguishing the effect of this variable and smoking. Smoking was chosen because its patterns are concordant with patterns of respiratory mortality, and because of many substantive results on the role of smoking in respiratory mortality (eg, findings that both smoking and exposure to air pollutants [eg, PM2.5] could exacerbate respiratory diseases).Citation28,Citation73 In our study, smoking had a significant stable effect on the dynamics of respiratory mortality from all three studied diseases. However, it can also reflect possible impacts of other variables with similar to smoking time trends and associations with respiratory mortality. Better evaluation of smoking effects (including synergistic effects of smoking and air pollutants) could be achieved in studies with individual records on smoking status.
Study designs based on individual measurements of environmental exposure and health outcomes (which are classic epidemiologic approaches) would be helpful for improvement of the quality of estimates. However, such approaches are expensive and complex, in part due to the difficulty of measuring subjects’ exposure to the relatively low levels of pollutants in the air. Some studies on the use of outdoor monitoring-station data (compared with the personal indoor/outdoor-exposure monitors) demonstrated that personal exposure to pollutants of outdoor origin was more closely related to outdoor air-pollutant levels than interpretations of personal monitoring data.Citation58,Citation89 Furthermore, the frequently high correlations between levels of certain pollutants in the air also make it difficult to identify the impact of a single agent on human health.Citation17
Changes in diagnostic criteria of respiratory diseases that happened during last two decades primarily affected the trends of disease incidence; however, in part, mortality trends were also affected. In children, diagnoses can transfer from chronic bronchitis and pneumonia to asthma, thus contributing to increasing trends in asthma prevalence (with its recent stabilization) and health care utilization.Citation90 If the person dies from pneumonia, but also had an underlying condition of which the pneumonia was probably a result, than that underlying disease but not pneumonia is considered the cause of death in the death certificate, and thus fewer deaths are directly attributable to pneumonia.Citation86 Although asthma death rates increased from 1980 to the mid-1990s, replaced ICD codes from the ninth to the tenth revision makes it challenging to evaluate the decline in asthma mortality since the late-1990s.Citation91,Citation92 With regard to this problem, it has been shown that decline in asthma mortality that occurred from 1998 to 1999 included approximately 11% of decline that resulted from the changes during the ICD codes transition; then, under ICD-10, asthma death rates continued declining.Citation91 Because no definitive asthma laboratory tests exist, asthma estimates rely on the physician, who also should accurately attribute the cause of death to asthma; therefore, the reliability of the death certificates has been questioned (eg, for the chance of misreporting the cause of death in older persons with comorbid conditions). Large well-designed studies have concluded that asthma death coding has 99% specificity and low sensitivity (42%), and asthma as a cause of death was underreported in preference to COPD in all age-groups.Citation91,Citation93
Conclusion
We observed temporal regional associations between long-term dynamics of decreasing death rates of emphysema, asthma, and pneumonia and reductions of the levels of certain air pollutants in North Carolina. Our results support the hypothesis that improvement in air quality, especially declines in SO2, CO, and PM10 levels in the air, contributed to the improved respiratory health of the North Carolina population. Since other factors (in addition to the studied air pollutants) might also account for improved health outcomes, ultimately caution should be exercised in inferring cause–effect relations.
Author contributions
JK, WGR, and HKL developed the concept behind the study; JK and IA designed the study and carried out the data analysis with help from APA, SH, and HKL; JK wrote the paper with help from IA, and SH; APA, WGR, and HKL provided critical reviews of the manuscript. All authors have read and approved the final manuscript.
Acknowledgments
The authors thank Fred and Alice Stanback for supporting this study with a philanthropic donation to the Duke Cancer Center.
Supplementary material
Table S1 Results of the sensitivity analysis
Disclosure
The authors report no competing conflicts of interest in this work.
References
- SchwartzJDockeryDWIncreased mortality in Philadelphia associated with daily air pollution concentrationsAm Rev Respir Dis199214536006041546841
- PopeCA3rdThunMJNamboodiriMMParticulate air pollution as a predictor of mortality in a prospective study of US adultsAm J Respir Crit Care Med19951513 Pt 16696747881654
- TouloumiGKatsouyanniKZmirouDShort-term effects of ambient oxidant exposure on mortality: a combined analysis within the APHEA project. Air Pollution and Health: a European ApproachAm J Epidemiol199714621771859230780
- SametJMZegerSLDominiciFThe National Morbidity, Mortality, and Air Pollution StudyRes Rep Health Eff Inst200094Pt 2579
- KatsouyanniKTouloumiGSamoliEConfounding and effect modification in the short-term effects of ambient particles on total mortality: results from 29 European cities within the APHEA2 projectEpidemiology200112552153111505171
- LipsmanJFrankALAttack on protections against air pollutionAm J Prev Med201141664564722099244
- OstroBOutdoor Air Pollution: Assessing the Environmental Burden of Disease at National and Local LevelsGenevaWorld Health Organization2004
- PopeC3rdDockeryDEpidemiology of particle effectsHolgateSTKorenHMaynardRSametJAir Pollution and HealthSan DiegoAcademic1999673705
- KatsouyanniKTouloumiGSpixCShort-term effects of ambient sulphur dioxide and particulate matter on mortality in 12 European cities: results from time series data from the APHEA project. Air Pollution and Health: a European ApproachBMJ19973147095165816639180068
- SchwartzJAir pollution and hospital admissions for cardiovascular disease in TucsonEpidemiology1997843713779209849
- GryparisAForsbergBKatsouyanniKAcute effects of ozone on mortality from the “Air Pollution and Health: a European Approach” projectAm J Respir Crit Care Med2004170101080108715282198
- SpickettJTBrownHRumchevKClimate change and air quality: the potential impact on healthAsia Pac J Public Health201123Suppl 237S45S21447543
- FriedmanMSPowellKEHutwagnerLGrahamLMTeagueWGImpact of changes in transportation and commuting behaviors during the 1996 Summer Olympic Games in Atlanta on air quality and childhood asthmaJAMA2001285789790511180733
- LinWHuangWZhuTAcute respiratory inflammation in children and black carbon in ambient air before and during the 2008 Beijing OlympicsEnviron Health Perspect2011119101507151221642045
- ClancyLGoodmanPSinclairHDockeryDWEffect of air-pollution control on death rates in Dublin, Ireland: an intervention studyLancet200236093411210121412401247
- BellMLAssessment of the health impacts of particulate matter characteristicsRes Rep Health Eff Inst2012161538
- NavidiWThomasDLangholzBStramDStatistical methods for epidemiologic studies of the health effects of air pollutionRes Rep Health Eff Inst19998615610465799
- State of North CarolinaSession laws and resolutions passed by the 2001 General Assembly at its extra session 2002 and its regular session 2002 Available from: http://www.ncleg.net/EnactedLegislation/SessionLawsCD/SessionLaws/2002SessionLaws.pdfAccessed April 30, 2014
- RossWGJrThe North Carolina Clean Smokestacks ActNC Med J2011722128131
- ZanobettiASchwartzJGoldDAre there sensitive subgroups for the effects of airborne particles?Environ Health Perspect2000108984184511017888
- AvolELGaudermanWJTanSMLondonSJPetersJMRespiratory effects of relocating to areas of differing air pollution levelsAm J Respir Crit Care Med2001164112067207211739136
- BragaALZanobettiASchwartzJThe lag structure between particulate air pollution and respiratory and cardiovascular deaths in 10 US citiesJ Occup Environ Med2001431192793311725331
- RedelingsMDSorvilloFSimonPA comparison of underlying cause and multiple causes of death: US vital statistics, 2000–2001Epidemiology200617110010316357601
- McCoyLRedelingsMSorvilloFSimonPA multiple cause-of-death analysis of asthma mortality in the United States, 1990–2001J Asthma200542975776316316870
- EricSUnderlying and multiple cause mortality at advanced ages: United States 1980–1998N Am Actuar J2002636487
- ViegiGMaioSPistelliFBaldacciSCarrozziLEpidemiology of chronic obstructive pulmonary disease: health effects of air pollutionRespirology200611552353216916323
- SanciniATomeiFCapozzellaAMetanalysis: respiratory effects in the general population exposed to urban pollutionJ Environ Prot (Irvine, Calif)201127974981
- LingSHvan EedenSFParticulate matter air pollution exposure: role in the development and exacerbation of chronic obstructive pulmonary diseaseInt J Chron Obstruct Pulmon Dis2009423324319554194
- LiptonRBanerjeeADowlingKCTrenoAJThe geography of COPD hospitalization in CaliforniaCOPD20052443544417147009
- KarakatsaniAAndreadakiSKatsouyanniKAir pollution in relation to manifestations of chronic pulmonary disease: a nested case-control study in Athens, GreeceEur J Epidemiol2003181455312705623
- SchikowskiTSugiriDRanftULong-term air pollution exposure and living close to busy roads are associated with COPD in womenRespir Res20056115216372913
- QuerolXAlastueyARodriguezSPM10 and PM2.5 source apportionment in the Barcelona metropolitan area, Catalonia, SpainAtmos Environ2001353664076419
- KravchenkoJAbernethyAPFawzyMLyerlyHKMinimization of heatwave morbidity and mortalityAm J Prev Med201344327428223415125
- World Health OrganizationWHO Air Quality Guidelines for Particulate Matter, Ozone, Nitrogen Dioxide and Sulfur Dioxide: Global Update 2005 – Summary of Risk AssessmentGenevaWHO2006
- DanielsMJDominiciFSametJMZegerSLEstimating particulate matter-mortality dose-response curves and threshold levels: an analysis of daily time-series for the 20 largest US citiesAm J Epidemiol2000152539740610981451
- DavidsonKHallbergAMcCubbinDHubbellBAnalysis of PM2.5 using the Environmental Benefits Mapping and Analysis Program (BenMAP)J Toxicol Environ Health A2007703–433234617365595
- EulerGAbbeyDMagieARHodgkinJChronic obstructive pulmonary disease symptom effects of long-term cumulative exposure to ambient levels of total suspended particulates and sulfur dioxide in California Seventh-Day Adventist residentsArch Environ Health19874242132223662608
- MartinsLCde Oliveira LatorreMRSaldivaPHBragaALAir pollution and emergency room visits due to chronic lower respiratory diseases in the elderly: an ecological time-series study in São Paulo, BrazilJ Occup Environ Med200244762262712134525
- ChenRHuangWWongCMShort-term exposure to sulfur dioxide and daily mortality in 17 Chinese cities: the China air pollution and health effects study (CAPES)Environ Res201211810110622831556
- LambertWSametJDockeryDCommunity air pollutionRomWNEnvironmental and Occupational MedicinePhiladelphiaLippincott-Raven199815011522
- ChenRPanGZhangYAmbient carbon monoxide and daily mortality in three Chinese cities: the China Air Pollution and Health Effects Study (CAPES)Sci Total Environ2011409234923492821908017
- BernardSMSametJMGrambschAEbiKLRomieuIThe potential impacts of climate variability and change on air pollution-related health effects in the United StatesEnviron Health Perspect2001109Suppl 219920911359687
- SchildcroutJSSheppardLLumleyTSlaughterJCKoenigJQShapiroGGAmbient air pollution and asthma exacerbations in children: an eight-city analysisAm J Epidemiol2006164650551716798793
- SlaughterJCLumleyTSheppardLKoenigJQShapiroGGEffects of ambient air pollution on symptom severity and medication use in children with asthmaAnn Allergy Asthma Immunol200391434635314582813
- ZanobettiASchwartzJAir pollution and emergency admissions in Boston, MAJ Epidemiol Community Health2006601089089516973538
- US Environmental Protection AgencyNational Air Quality and Emission Trends ReportWashingtonEPA Office of Air Quality Planning and Standards1997
- DominiciFPengRDBellMLFine particulate air pollution and hospital admission for cardiovascular and respiratory diseasesJAMA2006295101127113416522832
- NæssØNafstadPAamodtGClaussenBRoslandPRelation between concentration of air pollution and cause-specific mortality: four-year exposures to nitrogen dioxide and particulate matter pollutants in 470 neighborhoods in Oslo, NorwayAm J Epidemiol2007165443544317135427
- MorrowPEUtellMJBauerMAPulmonary performance of elderly normal subjects and subjects with chronic obstructive pulmonary disease exposed to 0.3 ppm nitrogen dioxideAm Rev Respir Dis19921452 Pt 12913001736733
- SunyerJBasagañaXParticles, and not gases, are associated with the risk of death in patients with chronic obstructive pulmonary diseaseInt J Epidemiol20013051138114011689536
- ImaiMYoshidaKKitabatakeMMortality from asthma and chronic bronchitis associated with changes in sulfur oxides air pollutionArch Environ Health198641129353963884
- SaezMTobiasAMuñozPCampbellMA GEE moving average analysis of the relationship between air pollution and mortality for asthma in Barcelona, SpainStat Med199918162077208610441764
- SunyerJBasagañaXBelmonteJAntoJEffect of nitrogen dioxide and ozone on the risk of dying in patients with severe asthmaThorax200257868769312149528
- BlombergAKrishnaMTBocchinoVThe inflammatory effects of 2 ppm NO2 on the airways of healthy subjectsAm J Respir Crit Care Med199715624184249279218
- SamoliEAgaETouloumiGShort-term effects of nitrogen dioxide on mortality: an analysis within the APHEA projectEur Respir J20062761129113816540496
- FolinsbeeLDoes nitrogen dioxide exposure increase airways responsiveness?Toxicol Ind Health1992852732831455438
- YuOSheppardLLumleyTKoenigJQShapiroGGEffects of ambient air pollution on symptoms of asthma in Seattle-area children enrolled in the CAMP studyEnviron Health Perspect2000108121209121411133403
- SchwartzJAssessing confounding, effect modification, and thresholds in the association between ambient particles and daily deathsEnviron Health Perspect2000108656356810856032
- Global initiative for chronic Obstructive Lung Disease (GOLD)Global Strategy for the Diagnosis, Management, and Prevention of Chronic Obstructive Pulmonary DiseaseBethesda (MD)GOLD2013
- AnthonisenNRConnettJEKileyJPEffects of smoking intervention and the use of an inhaled anticholinergic bronchodilator on the rate of decline of FEV1JAMA199427219149715057966841
- GilmourPSZiesenisAMorrisonERPulmonary and systemic effects of short-term inhalation exposure to ultrafine carbon black particlesToxicol Appl Pharmacol20041951354414962503
- JohnsonRLRelative effects of air pollution on lungs and heartCirculation200410915714707016
- StuartBODeposition and clearance of inhaled particlesEnviron Health Perspect1976164153797567
- SchwartzJSlaterDLarsonTVPiersonWEKoenigJQParticulate air pollution and hospital emergency room visits for asthma in SeattleAm Rev Respir Dis199314748268318466116
- AtkinsonRWAndersonHRSunyerJAcute effects of particulate air pollution on respiratory admissions: results from APHEA 2 projectAm J Respir Crit Care Med2001164101860186611734437
- PopeCA3rdDockeryDWSpenglerJDRaizenneMERespiratory health and PM10 pollution. A daily time series analysisAm Rev Respir Dis19911443 Pt 16686741892309
- NelAEDiaz-SanchezDLiNThe role of particulate pollutants in pulmonary inflammation and asthma: evidence for the involvement of organic chemicals and oxidative stressCurr Opin Pulm Med200171202611140402
- LeikaufGDKlineSAlbertREBaxterCSBernsteinDIBuncherCREvaluation of a possible association of urban air toxics and asthmaEnviron Health Perspect1995103Suppl 62532718549483
- FrenchJGLowrimoreGNelsonWCFinkleaJFEnglishTHertzMThe effect of sulfur dioxide and suspended sulfates on acute respiratory diseaseArch Environ Health19732731291334722867
- NeupaneBJerrettMBurnettRTMarrieTArainALoebMLong-term exposure to ambient air pollution and risk of hospitalization with community-acquired pneumonia in older adultsAm J Respir Crit Care Med20101811475319797763
- WongTWLauTSYuTSAir pollution and hospital admissions for respiratory and cardiovascular diseases in Hong KongOccup Environ Med1999561067968310658547
- CiencewickiJJaspersIAir pollution and respiratory viral infectionInhal Toxicol200719141135114617987465
- PopeCA3rdBurnettRTThurstonGDCardiovascular mortality and long-term exposure to particulate air pollution: epidemiological evidence of general pathophysiological pathways of diseaseCirculation20041091717714676145
- HoekGBrunekreefBVerhoeffAvan WijnenJFischerPDaily mortality and air pollution in the NetherlandsJ Air Waste Manag Assoc20005081380138911002600
- ConceiçãoGMiragliaSKishiHSSaldivaPSingerJMAir pollution and child mortality: a time-series study in São Paulo, BrazilEnviron Health Perspect2001109Suppl 334735011427383
- GouveiaNFletcherTRespiratory diseases in children and outdoor air pollution in Sao Paulo, Brazil: a time series analysisOccup Environ Med200057747748310854501
- SaldivaPHLichtenfelsAPaivaPAssociation between air pollution and mortality due to respiratory diseases in children in São Paulo, Brazil: a preliminary reportEnviron Res19946522182258187738
- Hernández-CadenaLBarraza-VillarrealARamírez-AguilarMInfant morbidity caused by respiratory diseases and its relation with the air pollution in Juarez City, Chihuahua, MexicoSalud Publica Mex20074912736 Spanish17388033
- OstroBDEskelandGSSanchezJMFeyziogluTAir pollution and health effects: a study of medical visits among children in Santiago, ChileEnviron Health Perspect1999107169739872719
- DominiciFDanielsMZegerSLSametJMAir pollution and mortality: estimating regional and national dose-response relationshipsJ Am Stat Assoc200297457100111
- BarnettAGWilliamsGMSchwartzJAir pollution and child respiratory health: a case-crossover study in Australia and New ZealandAm J Respir Crit Care Med2005171111272127815764722
- NgoLMehtaSDoDThachTThe effects of short-term exposure on hospital admissions for acute lower respiratory infections in young children of Ho Chi Minh City, Viet NamEpidemiology2011221S228S229
- KarrCLumleyTShepherdKA case-crossover study of wintertime ambient air pollution and infant bronchiolitisEnviron Health Perspect2006114227728116451867
- SegalaCPoizeauDMesbahMWillemsSMaidenbergMWinter air pollution and infant bronchiolitis in ParisEnviron Res200810619610017585899
- CohenAJAndersonHROstroBUrban air pollutionEzzatiMLopezADRodgersAMurrayCJComparative Quantification of Health RisksGenevaWHO200413531433
- American Lung AssociationTrends in Pneumonia and Influenza Morbidity and MortalityChicagoALA2010
- GetahunDDemissieKRhoadsGGRecent trends in asthma hospitalization and mortality in the United StatesJ Asthma200542537337816036412
- LiYCNortonECDowWHInfluenza and pneumococcal vaccination demand responses to changes in infectious disease mortalityHealth Serv Res2004394 Pt 190592615230934
- JanssenNAHoekGBrunekreefBHarssemaHMenswikIZuidhofAPersonal sampling of particles in adults: relation among personal, indoor, and outdoor air concentrationsAm J Epidemiol199814765375479521180
- AkinbamiLJSchoendorfKCTrends in childhood asthma: prevalence, health care utilization, and mortalityPediatrics2002110231532212165584
- MoormanJERuddRAJohnsonCANational surveillance for asthma – United States, 1980–2004MMWR Surveill Summ200756815417947969
- LoddenkemperREuropean Lung White Book: The First Comprehensive Survey on Respiratory Health in EuropeLausanne, SwitzerlandEuropean Respiratory Society2003
- HuntLWJrSilversteinMDReedCEO’ConnellEJO’FallonWMYungingerJWAccuracy of the death certificate in a population-based study of asthmatic patientsJAMA199326915194719528464126