
 ?Mathematical formulae have been encoded as MathML and are displayed in this HTML version using MathJax in order to improve their display. Uncheck the box to turn MathJax off. This feature requires Javascript. Click on a formula to zoom.
Abstract
Background
The chronic obstructive pulmonary disease (COPD) assessment test (CAT) is a validated simple instrument to assess health status, and it correlates well with the severity of airway obstruction in COPD patients. However, little is known about the relationships between CAT scores and quantitative computed tomography (CT) measurements of emphysema and airway wall thickness in COPD patients in the People’s Republic of China.
Methods
One hundred and twelve participants including 63 COPD patients and 49 normal control subjects were recruited. All participants were examined with high-resolution CT to get the measurements of emphysema (percentage of pixels below −950 HU [%LAA–950]) and airway wall thickness (wall area percentage and the ratio of airway wall thickness to total diameter). Meanwhile, they completed the CAT and modified Medical Research Council questionnaire independently.
Results
Significantly higher CAT scores and CT measurements were found in COPD patients compared with normal control subjects (P<0.05), and there was a tendency of higher CAT scores and CT measurements with increasing disease severity measured by GOLD staging system. Positive correlations were found between CAT scores and CT measurements (P<0.01). Using multiple linear stepwise regression, CAT score =−46.38+0.778× (wall area percentage) +0.203× (%LAA–950) (P<0.001). Meanwhile, CAT scores and CT measurements in COPD patients all positively correlated with the modified Medical Research Council grades and negatively correlated with FEV1% (P<0.01).
Conclusion
CAT scores correlate well with the quantitative CT measurements in COPD patients, which may provide an imaging evidence that the structural changes of the lungs in this disease are associated with the health status measured by CAT.
Introduction
The chronic obstructive pulmonary disease (COPD) assessment test (CAT) is a simple, validated, patient-completed questionnaire to assess and quantify health status and symptoms burden in COPD patients.Citation1,Citation2 It comprises eight questions, each presented as a semantic six-point (0–5) differential scale, providing a total score out of 40. Scores of 0–10, 11–20, 21–30, and 31–40 represent mild, moderate, severe, or very severe clinical impact, respectively.Citation3 The CAT has good internal consistency and test–retest reliability;Citation1 previous studies have shown its significance in diagnosis, response to therapies, and management both in stable and exacerbating COPD patients.Citation4–Citation8 CAT scores correlate well with important parameters of the disease, such as dyspnea grades, pulmonary function parameters, etc.Citation7–Citation9 Nowadays, it is widely used in clinical practice all over the world.
COPD is a chronic lung disease, and it can lead to certain irreversible structural changes in the lungs, including airway wall remodeling and emphysematous lung destruction.Citation10 With the advances both in computed tomography (CT) technology and computer software, the multi-slice spiral CT has not only improved the early diagnosis of pulmonary microstructures and morphologic changes, but also made the quantitative measurements of structural changes in the lungs possible.Citation11–Citation13 Since the high-resolution CT (HRCT) technology has a good spatial resolution, it is currently a better imaging technology to observe small airway and lung tissue disease.Citation14 Studies have demonstrated that −950 Hounsfield units (HU) in the inspiratory phase is a suitable threshold for the measurements of retention volume in emphysema,Citation15,Citation16 and the ratio of airway wall thickness to total diameter (WT/D) and wall area percentage (%WA) from CT scans can represent the airway dimensions in COPD patients.Citation17,Citation18 Moreover, researchers have conducted a series of studies on the relationships between disease-specific parameters and quantitative CT measurements.Citation18–Citation20 As far as we know, little is known about the relationships between CAT scores and quantitative CT measurements of emphysema and airway wall thickness in COPD patients in the People’s Republic of China.
In the present study, we hypothesized that CAT scores might be related to the extent of emphysema and airway wall thickness in COPD patients. By measuring the extent of emphysema and airway wall thickness with HRCT, and investigating the relationships between CAT scores and quantitative CT measurements, we explored if there is any association of CAT scores and structural changes of the lungs in COPD patients.
Materials and methods
Subjects
One hundred and twelve participants including 63 COPD patients and 49 normal control subjects (inclusion and exclusion criteria shown in and , respectively) were recruited. The COPD patients came from the Pulmonary Department, First Affiliated Hospital of Anhui Medical University, Hefei, Anhui, People’s Republic of China, and the normal control subjects were all volunteers. Demographic information such as height, weight, age, and smoking history were recorded at recruitment. The study was approved by the ethics committee of the First Affiliated Hospital of Anhui Medical University. All participants had given written informed consent to participate in the study and were informed of the possible risks of the study. The study was performed from July 1, 2013 to February 28, 2014.
Table 1 Inclusion and exclusion criteria for COPD patients
Table 2 Inclusion and exclusion criteria for normal control subjects
Assessment of health status and dyspnea
The health status was evaluated by CAT, which can also provide an assessment of symptoms burden. The degree of dyspnea was evaluated with the modified Medical Research Council (mMRC) questionnaire. All subjects completed CAT and mMRC questionnaires independently on the day of taking HRCT scans. The effect of COPD on health status was measured by the CAT scores, and the COPD patients were classified into group I (mild), II (moderate), III (severe), and IV (very severe) according to their CAT scores.Citation3
HRCT scans and analysis
We measured emphysema and airway wall thickness using HRCT scans, which was performed using a 64-slice spiral CT scanner (Discovery HD750; GE, USA) at full inspiration without receiving contrast medium. Images were obtained at 120 kVp and 30–60 mAs. The exposure time was 1 second and the matrix size was 512×512 pixels. Images were contiguously reconstructed using a standard algorithm with a slice thickness of 0.625 mm and a slice interval of 5 mm. In transverse reconstructed images with a window width of 1,500 HU and window level of −600 HU on the workstation monitor. Reconstructed data were transferred to advantage workstation, and measurements of CT metrics were obtained with commercial software (Pulmonary Workstation; Vida Diagnostics, Coralville, IA, USA). All CT scans were reviewed by two experienced chest radiologists. Airway measurements were collected in the apical bronchus of the right upper lobe. %WA was calculated as (total airway area − oairway lumen)/total airway area ×100, and WT/D was calculated as airway wall thickness/outer diameter.Citation18 Emphysema was defined as low attenuation areas using the HU threshold of −950;Citation15,Citation16 we calculated the percentage of pixels below this threshold (%LAA–950) from the total number within lung parenchyma.
Pulmonary function test
Post-bronchodilator FEV1 was measured at 15 minutes after inhaling salbutamol (Ventolin; GlaxoSmithKline plc, London, UK) 400 μg, and the pulmonary function test was performed using a dry spirometer device (Erich Jaeger GmbH, Hoechberg, Germany). Subjects with FEV1/FVC <0.70 were defined as having COPD, and FEV1 higher than 50% predicted were classified as GOLD I–II group; subjects with FEV1 lower than 50% predicted were classified as GOLD III–IV group according to the GOLD staging system.Citation10
Statistical analysis
Demographic and clinical characteristics of all subjects were summarized descriptively. Data were expressed as mean ± standard deviation. Data of CT measurements were all expressed as percentages. SPSS Statistics version 17.0 was used for statistical analysis. Group comparisons were tested using one-way analysis of variance. Differences between sex ratios were compared with the chi-square test. Pearson’s correlation test was used to verify the relationship between numerical variables with normal distributions. The Spearman’s rank correlation test was applied to nonparametric variables. Multiple linear stepwise regression analysis was used to explore the relationship between CAT scores and quantitative CT measurements. Values of P<0.05 were considered to be significant.
Results
Demographic characteristics of all subjects
One hundred and twelve participants were recruited, and the average age was 66.97±10.46 years. The subjects were classified into three groups: GOLD I–II group (n=30), GOLD III–IV group (n=33), and control group (n=49). shows the clinical characteristics of each group. The three groups were statistically similar with respect to age, sex, and body mass index (BMI) (P>0.05), but the smoking index and mMRC grades were significantly higher in the COPD groups compared to the control subjects (P<0.01), the pulmonary function parameters (FEV1% and FEV1/FVC) were significantly lower in the COPD groups (P<0.01). Moreover, mMRC grade was significantly higher in the GOLD III–IV group compared to the GOLD I–II group (P<0.01), and the pulmonary function parameters were significantly lower in the GOLD III–IV group compared to the GOLD I–II group (P<0.01).
Table 3 Characteristics of all subjects
Relationships between CAT scores and CT measurements in COPD patients
The CAT scores and CT measurements of emphysema and airway wall thickness in COPD patients were all significantly higher than in control subjects (P<0.05), as shown in . There was a tendency of higher CAT scores and CT measurements with increasing disease severity measured by GOLD staging system. CAT scores were taken as a dependent variable, while quantitative CT measurements, age, sex, and BMI were taken as independent variables in multiple linear stepwise regression analysis. Age, sex, BMI, and WT/D were not retained, but %LAA–950 and %WA were independent predictors of CAT score, giving the equation:
Table 4 CAT score and CT measurements in the total subjects
Figure 1 Positive correlation between the CAT score and %LAA–950.
Notes: r=0.46, P=0.000.
Abbreviations: %LAA–950, percentage of pixels below −950 HU; CAT, chronic obstructive pulmonary disease assessment test.
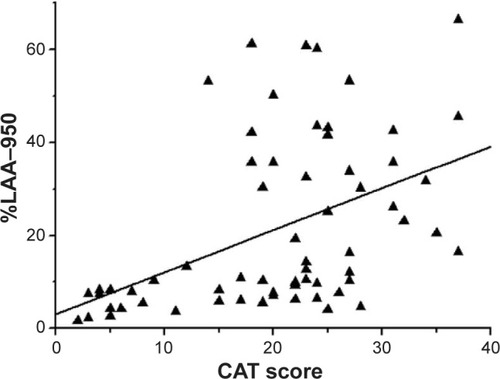
Figure 2 Positive correlation between the CAT score and %WA.
Notes: r=0.48, P=0.000.
Abbreviations: %WA, wall area percentage; CAT, chronic obstructive pulmonary disease assessment test.
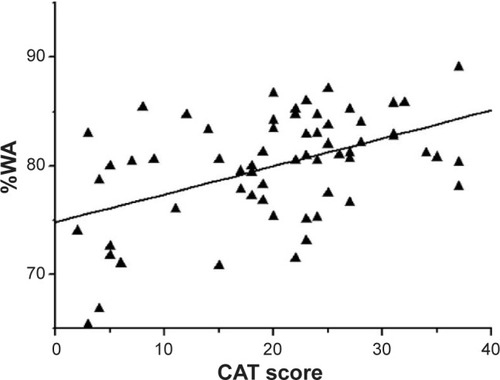
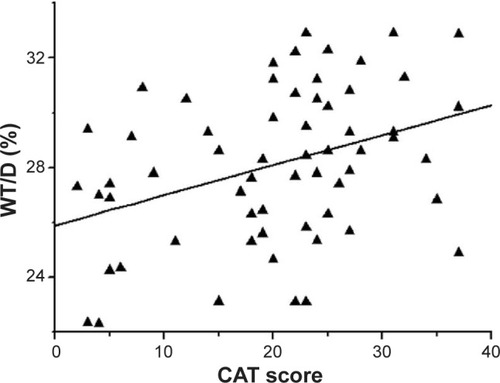
Figure 3 Positive correlation between the CAT score and WT/D.
Abbreviations: CAT, chronic obstructive pulmonary disease assessment test; WT/D, ratio of airway wall thickness to total diameter.
After classifying the COPD patients into four groups according to their CAT scores, 12 patients were group I (mild), 17 patients were group II (moderate), 25 patients were group III (severe), and nine patients were group IV (very severe). shows the CT measurements in different CAT groups, and significant differences were found in %LAA–950 and %WA between group I and other groups (P<0.05), but no difference was found in WT/D among CAT groups (P>0.05).
Table 5 CT measurements in different CAT groups
Relationships between pulmonary function and CT measurements, CAT scores in COPD patients
The mean value of pulmonary function parameters (FEV1% and FEV1/FVC) in each group are shown in . The FEV1% predicted was inversely correlated with %LAA–950 (r=−0.65, P=0.000), %WA (r=−0.54, P=0.000), and WT/D (r=−0.44, P=0.000). Similar relationships were also found between FEV1/FVC and %LAA–950, %WA, and WT/D (r=−0.60, −0.45, and −0.37, respectively, all P=0.000). CAT scores were inversely correlated with FEV1% (r=−0.63, P=0.000) and FEV1/FVC (r=−0.47, P=0.000).
Relationships between mMRC grades and CT measurements, CAT scores in COPD patients
With the Spearman’s correlation analysis, the mMRC grades were positively correlated with %LAA–950 (rs=0.58, P=0.000), %WA (rs=0.40, P=0.001), and WT/D (rs=0.33, P=0.008), as well as the CAT scores (rs=0.66, P=0.000).
Discussion
In the present study, we have demonstrated that the CAT scores and quantitative CT measurements of emphysema and airway wall thickness were significantly higher in COPD patients, which were consistent with the increasing disease severity measured by GOLD staging system. The CAT scores were significantly and positively correlated with the quantitative CT measurements in COPD patients. With a multiple linear stepwise regression analysis, both %LAA–950 and %WA were independent predictors of CAT scores. Meanwhile, both CAT scores and CT measurements were positively correlated to mMRC grades and inversely correlated to FEV1%. After classifying the COPD patients according to the CAT scores, significant differences were found in %WA and %LAA–950 between group I and other groups.
COPD is a chronic inflammatory disease, and the chronic inflammatory responses can induce parenchymal tissue destruction (resulting in emphysema) and disrupt normal repair and defense mechanisms (resulting in small airway fibrosis).Citation21 These pathological changes can lead to air trapping and progressive airflow limitation, which may directly cause dyspnea and other characteristic symptoms, as well as impaired health status.Citation10 The CAT is a good measurement of health status and symptoms burden in COPD patients.Citation1 Considering the CAT is a questionnaire completed by the patients, some problems such as subjectivity and being unilateral are inevitable during the examinations. While previous studies have shown the validated correlations between CAT scores and some other important parameters of COPD – such as dyspnea grades, pulmonary function parameters, and systemic inflammatory markers,Citation7–Citation9 which provided functional, physiologic, and serologic evidences for clinical practice of CAT – to our knowledge, correlation between CAT scores and the imaging parameters in COPD patients has not yet been carried out in the People’s Republic of China.
Chest CT is the most prevalent examination to characterize the structural changes and offer various imaging parameters of lungs in clinic. The chest HRCT can not only give a more accurate quantification of airway dimensions and emphysema, but also allows for the phenotypic stratification of patients who have COPD into parenchymal- and airway-predominant categories.Citation11–Citation14,Citation18 In COPD, the small airways (2 mm or less in diameter) are the site of major airflow resistance.Citation10 Former studies have established that %WA of the segment bronchus of the right upper lobe is a surrogate for the dimensions of those small airways measured by histological means,Citation22 and that is also why the apical bronchus of the right upper lobe was chosen as our target measuring site in the present study. Madani et al reported that the best correlation between CT measurements and macroscopic and microscopic measures of emphysema can be obtained using a density mask technique with a threshold level of −960 or −970 HU.Citation23 In our study we chose the threshold of −950 HU in the inspiratory phase since we concerned that a threshold of −960 or −970 HU might exclude milder degrees of emphysema.
Previous studies have shown the relationships between quantitative CT measurements and respiratory symptoms in COPD patients.Citation24–Citation26 Grydeland et al found that both emphysema and airway wall thickness were independently and significantly related to the symptoms burden in COPD patients.Citation24 A report from the COPDGene trial found that the extent of airway wall thickness was more strongly related to the symptoms burden than was emphysema.Citation26 CAT is also a good instrument to assess the symptoms burden. In the present study, we demonstrated that the CAT scores in COPD patients increased with the increasing level of emphysema and airway wall thickness measured by HRCT. Positive correlations were found between CAT scores and %LAA–950, %WA, and WT/D, which might indicate that the change of symptoms burden correspond with the changes of quantitative CT measurements in COPD patients. Regression analysis showed that the independent predictors of CAT scores were %LAA–950 and %WA, but not WT/D; the specific reason for this difference is unknown, and further studies are needed to gain much more insight into answering this question. Interestingly, after classifying the COPD patients into four groups according to the CAT scores, significant differences were found only in %WA and %LAA–950 between group I (mild) and other groups. According to the GOLD guidelines, a CAT score <10 indicates a low level of symptoms, and a CAT score ≥10 indicates a high level symptoms.Citation10 A potential explanation for the differences in %WA and %LAA–950 between group I and other groups is that patients with a high level of symptoms may experience more serious destruction of lung parenchymal tissue and airway remodeling than the ones with less severe symptoms. While the WT/D is the ratio of airway wall thickness to total diameter, the differences might have been counterbalanced and caused the non-significant difference in WT/D between COPD patients with different levels of symptoms. However, more studies with large sample sizes are needed to gain more insight into these questions.
Dyspnea is usually the most prominent and distressing symptom of COPD patients.Citation10 The correlations between dyspnea and imaging parameters in COPD patients were presented in several studies,Citation20,Citation24 as well as the association of dyspnea and CAT scores.Citation9,Citation27 Our study showed that both CT measurements and CAT scores were positively correlated with mMRC grades. Several explanations for these independent associations of the CT indices with dyspnea were discussed in previous studies.Citation28,Citation29 A number of studies have testified to the relationships between CT measurements and pulmonary function in COPD patients.Citation18,Citation19,Citation30 Here we found that CT measurements and CAT scores were all negatively correlated with pulmonary function parameters; furthermore, the CT measurements and CAT scores all correspond well with the increasing disease severity measured by GOLD staging system, indicating that greater air trapping or thicker airway walls correlates with lower lung function, as well as more symptoms and worse health status. We speculate that both CAT and quantitative CT measurements might be used to partially reflect the extent of airflow limitation in COPD patients.
There are some limitations in this study. Firstly, only the apical bronchus of the right upper lobe was measured in this study, although previous studies have demonstrated that the apical bronchus of the right upper lobe can be a surrogate for the dimensions of the small airways.Citation22 In the future, we need to collect more data for each lung lobe of COPD patients to obtain more accurate relationships between CAT scores and quantitative CT measurements. Secondly, the sample size in our study was relatively small, which may partially account for the weak correlations between some measurements in our results. Further prospective studies involving multicenter and large sample size of COPD patients are needed.
Conclusion
In conclusion, this study shows that CAT scores in COPD patients in the People’s Republic of China correlate well with the quantitative CT measurements. Not only can it give assessments of health status or symptoms burden, but it can also be associated with the extent of emphysema and airway thickening in COPD patients. For the first time in the People’s Republic of China, we provide an imaging evidence that the structural changes in lungs in COPD correlate with the health status measured by CAT. We suggest that a wide use of CAT may be performed in COPD patients in the People’s Republic of China.
Acknowledgments
The authors would like to sincerely thank Rui Xu, Rong-huai Li, and Xian-wei Hu for assistance with recruitment and clinical assessment of participants.
Disclosure
This work was supported by the National Science Foundation of China [No: 81270081]. The authors report no other conflicts of interest in this work.
References
- JonesPWHardingGBerryPWiklundIChenWHKline LeidyNDevelopment and first validation of the COPD Assessment TestEur Respir J20093464865419720809
- JonesPHardingGWiklundIBerryPLeidyNImproving the process and outcome of care in COPD: development of a standardised assessment toolPrim Care Respir J200918320821519690787
- COPD assessment test-healthcare professional user-guide [webpage on the Internet]CAT Development Steering Group2009 Available from: http://www.catestonline.org/images/UserGuidesAccessed June 15, 2013
- RaghavanNLamYMWebbKAComponents of the COPD Assessment Test (CAT) associated with a diagnosis of COPD in a random population sampleCOPD20129217518322409441
- DoddJWHoggLNolanJThe COPD Assessment Test (CAT): response to pulmonary rehabilitation. A multicentre, prospective studyThorax201166542542921398686
- JonesPWHardingGWiklundITests of the responsiveness of the COPD assessment test following acute exacerbation and pulmonary rehabilitationChest2012142113414022281796
- TuYHZhangYFeiGHUtility of the CAT in the therapy assessment of COPD exacerbations in ChinaBMC Pulm Med2014144224618290
- MackayAJDonaldsonGCPatelARJonesPWHurstJRWedzichaJAUsefulness of the Chronic Obstructive Pulmonary Disease Assessment Test to evaluate severity of COPD exacerbationsAm J Respir Crit Care Med2012185111218122422281834
- OkutanOTasDDemirerEKartalogluZEvaluation of quality of life with the chronic obstructive pulmonary disease assessment test in chronic obstructive pulmonary disease and the effect of dyspnea on disease-specific quality of life in these patientsYonsei Med J20135451214121923918572
- VestboJHurdSSAgustiAGGlobal strategy for the diagnosis, management and prevention of chronic obstructive pulmonary disease: GOLD executive summaryAm J Respir Crit Care Med2013187434736522878278
- LeeYKOhYMLeeJHQuantitative assessment of emphysema, air trapping, and airway thickening on computed tomographyLung2008186315716518351420
- Van ThoNWadaHOgawaENakanoYRecent findings in chronic obstructive pulmonary disease by using quantitative computed tomographyRespir Investig20125037887
- MatsuokaSYamashiroTWashkoGRKuriharaYNakajimaYHatabuHQuantitative CT assessment of chronic obstructive pulmonary diseaseRadiographics201030556620083585
- OrlandiIMoroniCCamiciottoliGChronic obstructive pulmonary disease: thin-section CT measurement of airway wall thickness and lung attenuationRadiology200523460461015671010
- ParrDGStoelBCStolkJNightingalePGStockleyRAInfluence of calibration on densitometric studies of emphysema progression using computed tomographyAm J Respir Crit Care Med2004170888389015271692
- GevenoisPAde MaertelaerVDe VuystPZanenJYernaultJCComparison of computed density and macroscopic morphometry in pulmonary emphysemaAm J Respir Crit Care Med19951526536577633722
- CoxsonHOQuineyBSinDDAirway wall thickness assessed using computed tomography and optical coherence tomographyAm J Respir Crit Care Med20081771201120618310475
- KosciuchJKrenkeRGorskaKZukowskaMMaskey-WarzechowskaMChazanRRelationship between airway wall thickness assessed by high-resolution computed tomography and lung function in patients with asthma and chronic obstructive pulmonary diseaseJ Physiol Pharmacol200960Suppl 5717620134043
- MetsOMMurphyKZanenPThe relationship between lung function impairment and quantitative computed tomography in chronic obstructive pulmonary diseaseEur Radiol201222112012821837396
- CamiciottoliGBartolucciMMaluccioNMSpirometrically gated high-resolution CT findings in COPD: lung attenuation vs lung function and dyspnea severityChest200612955856416537852
- HoggJCPathophysiology of airflow limitation in chronic obstructive pulmonary diseaseLancet200436470972115325838
- NakanoYWongJCde JongPAThe prediction of small airway dimensions using computed tomographyAm J Respir Crit Care Med200517114214615516531
- MadaniAZanenJde MaertelaerVGevenoisPAPulmonary emphysema: objective quantification at multi-detector row CT – comparison with macroscopic and microscopic morphometryRadiology20062381036104316424242
- GrydelandTBDirksenACoxsonHOQuantitative computed tomography measures of emphysema and airway wall thickness are related to respiratory symptomsAm J Respir Crit Care Med2010181435335919926869
- HanMKBartholmaiBLiuLXClinical significance of radiologic characterizations in COPDCOPD20096645946719938970
- MartinezCHChenYHWestgatePMRelationship between quantitative CT metrics and health status and BODE in chronic obstructive pulmonary diseaseThorax201267539940622514236
- ZhouQTMeiJJHeBChronic obstructive pulmonary disease assessment test score correlated with dyspnea score in a large sample of Chinese patientsChin Med J (Eng)201312611115
- O’DonnellDELavenezianaPDyspnea and activity limitation in COPD: mechanical factorsCOPD2007422523617729066
- WoutersEFLocal and systemic inflammation in chronic obstructive pulmonary diseaseProc Am Thorac Soc20052263316113466
- SchroederJDMcKenzieASZachJARelationships between airflow obstruction and quantitative CT measurements of emphysema, air trapping, and airways in subjects with and without chronic obstructive pulmonary diseaseARJ Am J Roentgenol20132013W460W470