
 ?Mathematical formulae have been encoded as MathML and are displayed in this HTML version using MathJax in order to improve their display. Uncheck the box to turn MathJax off. This feature requires Javascript. Click on a formula to zoom.
Abstract
Background
Hyperuricemia has been proposed to be a risk factor for cardiovascular disease and chronic kidney disease. Since diabetes is often complicated by hypertension and hyperuricemia, efficient therapeutic strategy against these two complications is very important in diabetic treatment. It has been reported that the antihypertensive drug, irbesartan, inhibits the renal uric acid reabsorptive transporters, URAT1 and GLUT9; this result suggests that irbesartan decreases serum uric acid level (SUA).
Subjects and methods
A retrospective study of 107 patients with hypertension and diabetes was performed to analyze the effects of irbesartan on blood pressure, estimated glomerular filtration rate (eGFR), and SUA. The follow-up period was 6–12 months. Seventy percent of the patients were diagnosed with diabetic nephropathy stage II–IV. We excluded patients treated with drugs that influenced SUA. The multiple logistic regression analysis was introduced to identify the relative factors for SUA decline. The time-dependent SUA changes were examined in a mixed-linear model.
Results
Irbesartan reduced blood pressure significantly after 1, 6, and 12 months’ treatment. No subject showed significant change in eGFR from baseline level throughout the period. The multiple logistic regression analysis revealed that SUA baseline significantly influenced SUA decline after 6–12 months. In patients whose SUA baseline was ≥5.9 mg/dL, the SUA was significantly decreased from 6.6±0.16 mg/dL to 6.2±0.16 mg/dL (P=0.010), after 12 months’ irbesartan treatment. In the SUA baseline <5.9 mg/dL group, the SUA did not show significant change over the monitoring period.
Conclusion
Our results demonstrate that irbesartan reduces the risk of hyperuricemia. No decline in renal function was observed after the initiation of irbesartan treatment. The present report determines the criteria of SUA baseline for introducing an antihyperuricemic effect using irbesartan. Its antihypertensive effect coupled with SUA decline would be effective for the treatment of hypertension complicated by hyperuricemia.
Introduction
Hyperuricemia has been reported to be an independent risk factor for hypertension,Citation1,Citation2 cardiovascular diseases,Citation3 and kidney diseases.Citation4 Approximately 25% of patients with hypertension have hyperuricemia,Citation1 while approximately 30% of patients with hyperuricemia or gout have hypertension.Citation2 In diabetic patients, hypertension and decreased renal function with hyperuricemia are major problems.Citation5 Therefore, the effects of antihypertensive drugs on serum uric acid level (SUA), especially angiotensin II receptor blockers (ARBs), have been closely scrutinized in recent years.
We have examined the influence on SUA by ARBs and shown that one of the ARBs, irbesartan, inhibits uric acid (UA) transport via the renal UA transporters, urate transporter 1 (URAT1) and glucose transporter 9 (GLUT9).Citation6 URAT1 is involved in lumen-to-cytosol reabsorption of UA at the apical membrane of proximal tubules,Citation7 whereas GLUT9 functions as a UA efflux transporter from tubular cells at the basolateral membrane.Citation8 Mutations of URAT1 or GLUT9 are associated with renal hypouricemia,Citation9–Citation11 indicating that these two transporters play a dominant role in renal UA reabsorption and regulation of SUA. We previously reported that irbesartan (100–500 μM) inhibited the uptake of UA via both URAT1 and GLUT9 in vitro.Citation6 Losartan has been shown to increase urinary UA excretion and to decrease SUA.Citation12 Losartan is associated with a lower risk of incident gout among patients with hypertension.Citation13 Since losartan is not effective for hypouricemic patients harboring URAT1 mutation, it has been demonstrated that the uricosuric action of losartan is via the inhibition of URAT1.Citation14 The URAT1 inhibitory effects of irbesartan exceeded those of losartan in vitro, and the results suggest that irbesartan has the effect of decreasing SUA through increasing urinary UA excretion.Citation6 Except for losartan and irbesartan, ARBs have been reported to increase the risk of goutCitation13 and to increase the SUA.Citation15 If irbesartan decreases SUA, its multiple effects would also make it useful for the treatment of hypertension combined with hyperuricemia.
A large study was performed in hypertensive patients with hyperuricemia to examine the effects of irbesartan on SUA for 2 months.Citation16 Although the SUA decrease was observed in irbesartan-treated subjects (from 7.06 mg/dL baseline to 6.85 mg/dL), it was not significant and was less than in those treated with losartan (from 7.09 mg/dL to 6.03 mg/dL).Citation16 In contrast, irbesartan was reported to decrease SUA significantly in hypertensive patients with advanced chronic renal disease.Citation17 Since inconsistent results have been reported regarding its effects on SUA, it is necessary to determine whether irbesartan has an SUA decreasing effect. In the present study, we investigated the effects of irbesartan on SUA in hypertensive diabetic patients treated with 50–150 mg irbesartan.
Subjects and methods
Subjects
The study was approved by the Ethics Committee of Tokyo University of Pharmacy and Life Sciences and carried out in accordance with recommendations from the Declaration of Helsinki. This was a retrospective study performed at a diabetic clinic in Chigasaki (Japan). The subjects were 134 stable diabetic outpatients treated with irbesartan for 6–12 months in 2011–2012. We excluded 27 patients treated with drugs that influenced SUA such as allopurinol, diuretics, or fenofibrate. The remaining 107 patients were examined in this study. Out of these, 72 patients had been previously treated with other ARBs and the medicine was switched to irbesartan (designated the ARBs–IRB switch group). Other patients were started on irbesartan as the first ARB (designated the IRB group). Diabetic nephropathy was staged according to an analysis of the urinary albumin excretion (UAE) and eGFR as defined by the Japanese Society of Nephrology from the Japanese historical cohort study:Citation18 stage I, UAE <30 mg/g creatinine; stage II, 30≤ UAE <300 mg/g creatinine; stage III, UAE ≥300 mg/g creatinine or continuous proteinuria (0.5 g/g creatinine ≤); stage IV, eGFR <30 mL/min/1.73 m2. Seven patients had the complication of myocardial disease and four of them were treated with a calcium channel blocker in combination with irbesartan. Three other patients had stopped treatment with anticoagulant, calcium channel blocker or nitrate before irbesartan was started. The dose of irbesartan was 50–150 mg. The follow-up period was 12 months for 101 patients and 6 months for the other six patients. Systolic blood pressure (SBP) and diastolic blood pressure (DBP) were recorded before irbesartan treatment (pre), at the beginning of the study (0 month), and 1, 3, 6, and 12 months after irbesartan was started. Serum creatinine (SCr) and SUA were measured at the same time point as SBP and DBP. Estimated glomerular filtration rate (eGFR) was calculated from SCr, sex, and patients’ age. The calculation formula defined by the Japanese Society of Nephrology is:
Baseline values were calculated as the average of values between pre-treatment examinations and month zero.
Statistical analysis
The data are presented as means ± SD. Student’s t-test was adopted to compare continuous variables and a value of P<0.05 was considered significant. Univariate logistic regression analysis was used to identify the factors associated with SUA changes. SUA decline after 6 or 12 months’ irbesartan treatment was employed as the dependent variable. We introduced significant (P<0.05) independent variables from the univariate analysis into multiple logistic regression analysis. The sex, history of alcohol intake, and diabetic disease duration were included in the multiple logistic regression analysis as independent variables. The receiver operating characteristic (ROC) curves were used to estimate the SUA cut-off point and this was determined to be where the sum of sensitivity and specificity was maximized. The Bonferroni multi-comparison test methodCitation19 was used when correcting for redundancy as required and P-values <0.05 were again considered to be statistically significant. To compare the time-series data, we introduced a mixed-linear model adjusted for the cutoff of SUA baseline (<5.9 mg/dL or ≥5.9 mg/dL) and the treatment before irbesartan (the IRB group or the ARBs–IRB switch group) as fixed effects. Analyses were performed with subjects as random effects. Data were analyzed using SPSS statistical software package for Windows (v21.0; SPSS Inc., Chicago, IL, USA).
Results and discussion
Here, the SUA-depressing effect of irbesartan was investigated retrospectively in 107 hypertensive outpatients with diabetes. The clinical characteristics of the patients are shown in . Patients in the ARBs–IRB switch group had significantly lower baselines of SBP and DBP than those of the IRB group because of their antihypertensive treatment. The ARB treatment is reported to decrease blood glucose level and total cholesterol.Citation20,Citation21 In agreement with those reports, the ARBs–IRB switch group showed significantly lower glucose baseline and low density lipoprotein-cholesterol baseline than the IRB group (). There were no significant differences between baseline values of SCr and eGFR in the IRB and ARBs–IRB switch groups. The ARBs–IRB switch group had statistically significantly higher SUA baseline than the IRB group. The possibility of SUA increase by the pre-treatment of ARBs was examined in 53 cases from 72 patients of the ARBs–IRB switch group. The SUA at 6–12 months did not change significantly from the ARB-naïve baseline values. The number of patients who had elevated SUA from the start of ARB use was almost the same as that of patients with decreased SUA (Table S1). From those results, the ARB pre-treatment was estimated not to be correlated with SUA increase. The baseline values of BP, SCr, eGFR, and SUA of the patients diagnosed with diabetic nephropathy are shown in Table S2. The stages of diabetic nephropathy did not significantly influence these baseline values. No patients developed gout or showed renal stone formation during the study period.
Table 1 Clinical characteristics of the patients
The HbA1c values at 6–12 months did not change significantly from the baseline values (data not shown) and it was suggested that diabetes progression did not occur in the patients over the monitoring period.
Results for the change in blood pressure (BP) are shown in . The BP baseline values were compared with BP levels at 1–12 months. In all patients, BP was well-controlled in the follow-up period (). SBP levels were decreased significantly at 1, 6, 12 months from baseline and DBP levels were decreased significantly at 1, 3, 6, and 12 months (). There was no significant difference in BP between the IRB group and the ARBs–IRB switch group during the study (data not shown).
Figure 1 Changes in blood pressure (A) and eGFR (B) of a total of 107 patients from the baseline compared with 12 months’ irbesartan treatment.
Abbreviations: DBP, diastolic blood pressure; eGFR, estimated glomerular filtration rate; SBP, systolic blood pressure.
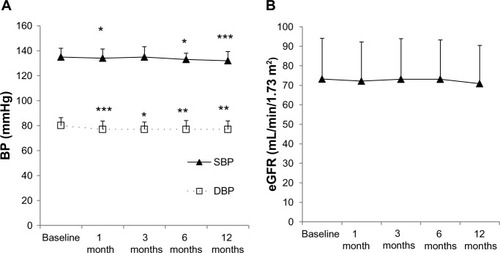
The eGFR did not change significantly from the baseline since irbesartan treatment started ().
The SUA of the subjects at the end of the study period was compared with the baseline values and the number of the patients with SUA decline was more than half of the patients (Table S3). Thus, we performed univariate logistic regression analysis to identify the factors that influenced SUA changes after 6–12 months (Table S4). SUA decline after 6–12 months was introduced as the dependent variable and some clinical factors were examined with positive effects for SUA changes. The SUA baseline tended to be higher in men than women (); however, sex was not found to be a significant relative factor for SUA changes (Table S4). The dose of irbesartan, the BP or SCr baseline values, and existence of diabetic nephropathy (stage II and III) were not found to be correlated to SUA. Cardiovascular diseases such as myocardial disease, cerebrovascular disease, and arteriosclerosis showed no significant effect on the SUA changes. The univariate logistic regression analysis revealed that ARBs–IRB switch, a history of alcohol intake, and higher SUA baseline caused significant SUA decline. Subsequently, we introduced the three significant variables from the univariate analysis into the multiple logistic regression analysis (Table S4). The history of alcohol intake was not a significant variable in the multiple analyses. This may be due to the common restriction of alcohol intake under diabetes treatment. The ARBs–IRB switch and SUA baseline were determined to be significant relative factors in the final model. The ARBs–IRB switch group had significantly higher SUA baseline than the IRB group (), and this could be the reason why the ARBs–IRB switch was a positive factor for SUA decline. The result of the multiple logistic regression analysis suggested that the higher SUA baseline led to SUA decline after irbesartan treatment.
We performed an ROC analysis to determine the cutoff SUA baseline for evaluating dependence of its effect on SUA decreases (Figure S1). The ROC analysis showed that patients with ≥5.9 mg/dL SUA at baseline had a positive benefit in terms of SUA decline.
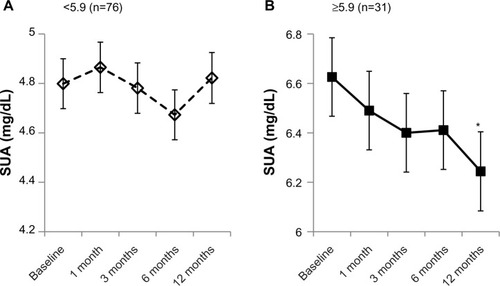
Based on the results of the ROC analysis, the subjects were classified into those with an SUA baseline <5.9 mg/dL and those ≥5.9 mg/dL. There was no significant difference in the SUA between the ARBs–IRB and IRB groups except at baseline (data not shown). The irbesartan efficacy on SUA decrease was validated with a mixed-linear model using the 5.9 mg/dL cutoff. The results are shown in . The group with an SUA baseline <5.9 mg/dL showed no significant SUA changes during the study period with the mixed-linear model. Subjects in the SUA baseline ≥5.9 mg/dL group had significantly higher SUA than the other group over the monitoring period (P<0.001) and their SUA decreased gradually in a time-dependent manner, with a significant decrease observed at 12 months (from the SUA baseline value 6.6±0.16 mg/dL to 6.2±0.16 mg/dL, P=0.010 by the Bonferroni method).
Figure 2 Mixed-linear model plots for SUA changes of patients classified according to SUA baseline value (<5.9 mg/dL (A) or ≥5.9 mg/dL (B)). Estimated marginal means of SUA were plotted from SUA at 0–12 months in covariance with diabetic disease duration.
Abbreviation: SUA, serum uric acid.
Conclusion
The present study revealed that irbesartan showed a significant effect on SUA decline on patients with higher SUA baseline and that the effect of irbesartan was seen markedly in patients with SUA ≥5.9 mg/dL. This result demonstrates that irbesartan treatment could achieve a decrease of SUA in hyperuricemic patients. This multiple effect of irbesartan enables efficient treatment for diabetic patients with hypertension and hyperuricemia.
Supplementary material
Figure S1 ROC analysis of SUA baseline values.
Notes: Decrease of SUA over 12 months was set to a positive influence and specificity and sensitivity of SUA baseline value were plotted. The cutoff point of SUA when the sum of specificity and sensitivity is maximized was 5.9 mg/dL (specificity, 0.860; sensitivity, 0.414). Area under the curve: 0.6540 and 95% CI: 0.5510–0.7569.
Abbreviations: CI, confidence interval; ROC, receiver operating characteristic; SUA, serum uric acid.
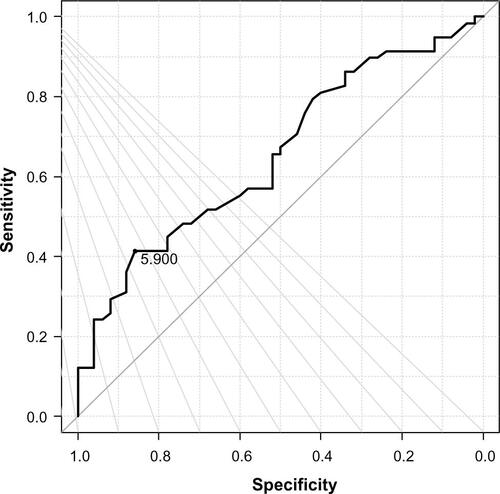
Table S1 SUA changes of the ARBs–IRB switch group by the pre-treatment of ARBs
Table S2 The baseline values of the subjects classified with the stages of diabetic nephropathy
Table S3 SUA changes from baseline after 6–12 months of irbesartan treatment
Table S4 Logistic regression analysis of the factors associated with SUA decline
Disclosure
This work was funded by Dainippon Sumitomo Pharma Co, Ltd, Osaka, Japan. The authors report no other conflicts of interest in this work.
References
- MesserliFHFrohlichEDDreslinskiGRSuarezDHAristimunoGGSerum uric acid in essential hypertension: an indicator of renal vascular involvementAnn Intern Med1980938178217447188
- LinKCLinHYChouPThe interaction between uric acid level and other risk factors on the development of gout among asymptomatic hyperuricemic men in a prospective studyJ Rheumatol2000271501150510852278
- SavareseSFerriCTrimarcoBChanges in serum uric acid levels and cardiovascular events: a meta-analysisNut Metabol Cardiovas Dis201323707714
- SedaghatSHoornEJvan RooijFJSerum uric acid and chronic kidney disease: The role of hypertensionPLOS One20138e7682724265674
- ItoHAbeMMifuneMHyperuricemia is independently associated with coronary heart disease and renal dysfunction in patients with type 2 diabetes mellitusPLOS One20116e2781722125626
- NakamuraMAnzaiNJutabhaPSatoHSakuraiHIchidaKConcentration-dependent inhibitory effect of irbesartan on renal uric acid transportersJ Pharmacol Sci201011411511820736511
- EnomotoAKimuraHChairoungduaAMolecular identification of a renal urate-anion exchanger that regulates blood urate levelsNature200241744745212024214
- AnzaiNIchidaKJutabhaPPlasma urate level is directly regulated by a voltage-driven urate efflux transporter URATv1 (SLC2A9) in humansJ Biol Chem2008283268342683818701466
- IchidaKHosoyamadaMHisatomeIClinical and molecular analysis of patients with renal hypouricemia in Japan: influence of URAT1 gene on urinary urate excretionJ Am Soc Nephrol20041516417314694169
- MatsuoHChibaTNagamoriSMutations in glucose transporter 9 gene SLC2A9 cause renal hypouricemiaAm J Hum Genet20088374475119026395
- DinourDGrayNKCampbellSHomozygous SLC2A9 mutations cause severe renal hypouricemiaJ Am Soc Nephrol201021647219926891
- FauvelJPVelonSBerraNEffects of losartan on renal function in patients with essential hypertensionJ Cardiovasc Pharmacol1996282592638856482
- ChoiHKSorianoLCZhangYRodríguezLAAntihypertensive drugs and risk of incident gout among patients with hypertension: population based case-control studyBMJ2012344d819022240117
- HamadaTIchidaKHosoyamadaMUricosuric action of losartan via the inhibition of urate transporter 1 (URAT1) in hypertensive patientsAm J Hypertens2008211157116218670416
- NishidaYTakahashiYSusaNKanouNNakayamaTAsaiSComparative effect of angiotensin II type I receptor blockers on serum uric acid in hypertensive patients with type 2 diabetes mellitus: a retrospective observational studyCardiovasc Diabetol20131215924180232
- DangAZhangYLiuGChenGSongWWangBEffects of losartan and irbesartan on serum uric acid in hypertensive patients with hyperuricaemia in Chinese populationJ Hum Hypertens200620455016281062
- CoronelFCigarránSGarcía-MenaMHerreroJACalvoNPérez-FloresIIrbesartan in hypertensive non-diabetic advanced chronic kidney disease. Comparative study with ACEINefrologia2008285660 Spanish18336132
- WadaTHanedaMFuruichiKClinical impact of albuminuria and glomerular filtration rate on renal and cardiovascular events, and all-cause mortality in Japanese patients with type 2 diabetesClin Exp Nephrol Epub10172013
- Curran-EverettDMultiple comparisons: philosophies and illustrationsAm J Physiol Regul Integr Comp Physiol2000279R1R810896857
- KitamuraNTakahashiYYamadateSAsaiSAngiotensin II receptor blockers decreased blood glucose levels: a longitudinal survey using data from electronic medical recordsCardiovasc Diabetol200762617903269
- NishidaYTakahashiYNakayamaTAsaiSComparative effect of angiotensin II type I receptor blockers and calcium channel blockers on laboratory parameters in hypertensive patients with type 2 diabetesCardiovasc Diabetol2012115322594344