
 ?Mathematical formulae have been encoded as MathML and are displayed in this HTML version using MathJax in order to improve their display. Uncheck the box to turn MathJax off. This feature requires Javascript. Click on a formula to zoom.
Abstract:
This is the first report in which seasonal patterns in nativity and mortality were analyzed in a single family, branches of which have resided in the middle of Europe as well as in South Africa for several hundreds of years. The family included a total of 3,645 members. The data convincingly demonstrate the effect of the seasonal amplitude of the photoperiod, as represented by the different latitudes, on the seasonal rhythm in nativity and mortality, discernible from 1500–1950 in Europe at 51° N but not in South Africa at 30° S. Most interestingly, this pattern in Germany was lost in the second half of the 20th century, possibly because of socioeconomic conditions and masking effects from the introduction of new technology to better control environmental conditions, greater use of artificial light, further incorporation of shiftwork schedules in industry, stronger advances in medical treatment of many diseases (including increased availability of intensive care in hospitals), and finally, greater longevity of the population.
Introduction
Seasonal variation in human births and deaths has often been reported, dating from the beginning of the 19th century.Citation1–Citation13 An initial extensive review on such periodicities of human populations was published by Smolensky et alCitation14 and Smolensky,Citation15 in which the limitations of unknown and/or uncontrolled factors of historical observations/reports also were extensively discussed. Socioeconomic aspects of seasonal variations were presented by several authors.Citation16,Citation17 Smolensky et alCitation14 and Batschelet et alCitation18 compiled population data on the calendar date of birth and death events from various regions of the world, representing different decades and a vast number of different families. More recently, Roenneberg and AschoffCitation13,Citation19 were able to demonstrate that the annual rhythm in conception rate and human reproduction, using a worldwide selection of statistics, was based on photoperiod and ambient temperature. It is well known that photoperiod greatly varies with latitude. Even a small difference in latitude (San Diego, CA, USA [32° 43′ N], versus Rochester, NY, USA [44° 1′ N]) results in a significantly greater seasonal variation in outdoor illumination in Rochester than in San DiegoCitation20 during each of the four quarters of the year. To the best of my knowledge, it has not yet been studied whether residing at different latitudes results in different seasonal rates in natality and mortality in a single family with more or less the same genetic background.
In a recent paper, I analyzed seasonal data in birth and death in 1,632 persons of my own family residing in the middle of Germany over the course of 6 centuries (1500–2000).Citation21 Significant seasonal variation was found both in births and deaths up to the 19th century, but in the second half of the 20th century, these rhythms were lost. Luckily, thanks to an inheritance from a family member, I received access to another set of data for the Lemmer family from Harry Lemmer’s son Ulrich.Citation22 The additional data increased the total time span up to the year 2013 and the number of family members up to 2,361 persons. It should be mentioned that the roots of the German Lemmer family are supposed to be in the NetherlandsCitation22,Citation23 (the little city of “Lemmer” still exists at the Zuider Sea), from which the family’s ancestors went up the Rhine and settled east of Cologne. From this new set of data, I also received the information that one of my forefathers, Johann Caspar Lemmer, born in 1762 in Wiedenest, Northrhine-Westfalia, Germany, emigrated to South Africa in 1786 on board the ship De Arend, and 5 years later, he became a citizen of South Africa. He was the father of the South African branch of the Lemmer family.Citation24 In 1826, Johann Caspar Lemmer married Marietta Uys. They had three children, 28 grandchildren, and 89 great-grandchildren, and the family has continued to grow rapidly up to now. The family’s marriages were nearly exclusively made with other Dutch and German immigrants.
These data from the German and the South African branches of the Lemmer family, from a predominantly Caucasian background, created a unique opportunity to compare seasonal variation in births and deaths and additional socioeconomic data within the same family living for several hundred years in different parts of the earth, differing mainly by latitude.
Material and methods
German branch of the family
Biographic data of the German Lemmer family were available from 1500–2013, for a total of 2,361 persons. Data were collected from various sourcesCitation22,Citation23,Citation25–Citation27 and from parish registers. Date of birth and death was documented for 1,265 and 957 persons, respectively (); there were 454 weddings.
Table 1 Statistics on seasonal variation data on births and deaths of the Lemmer family
The family members lived at approximately the same latitude and nearly the same longitude (regions/geographic coordinates: Northrhine-Westfalia [eg, Dümmlinghausen, Lieberhausen/51° 02′ N, 07° 37′ E; Niester-Möhrendorf, Erdbach/50° 41′ N, 08° 13′ E], Hesse [eg, Dorla, Werkel/51° 10 N, 10° 25′ E], and Upper Silesia [eg, Neustadt, Neisse/51° 19′ N, 17° 35′ E]), indicating that they were exposed to comparable seasonal variations of light and darkness, ambient temperature (latitude 43°–52° N; peak in air temperature in the years 1800–1950: summer, 15.4°C–17.7°C; winter, −3.4°C–1.7°C),Citation28 and most likely, diet and work patterns. The family members resided in predominantly rural areas in middle Europe and mostly stayed in “their areas” until World War II and the political/regional changes that occurred thereafter in Germany.
South African branch of the family
Data from the South African branch of the Lemmer family were obtained from a family document published by Lemmer & Lemmer in 2000.Citation24 Between 1800 and 2000, data from births and deaths were documented in 1,284 persons, with 932 dates for births and 352 for deaths, respectively (), and 126 couples’ wedding dates also were reported.
These family members lived mainly in the region of Johannesburg (26° 12′ S, 28° 2′ E), Bloemfontein (29° 7′ S, 26° 12′ E), Pretoria (25° 44′ S, 28° 11′ E), Swellendam (34° 1′ S, 20° 26′ E), Kapstadt (33° 55′ E, 18° 25′ E), and Hartbeesfontein (30° 8′ S, 26° 8′ E). Highest/lowest air temperatures were recorded in Durban (summer, 28°/21°C; winter, 23°/11°C), Johannesburg (summer, 26°/15°C; winter, 17°/11°C), and Pretoria (summer, 19°/18°C; winter, 20°/5°C).Citation29
The location (coordinates) of the living area of the two family branches show that both branches lived at approximately the same longitude east, whereas the latitude differed greatly, being about 51° N of the equator for the German branch and about 26°–34° S of the equator for the South African branch of the Lemmer family.
Statistical analyses
The ancestor computer program MacFamilyTree 7Citation30 was used to collect all data from the members of the family. Then, data on births and deaths were grouped on a monthly basis by a program subroutine. All seasonal data were normalized to 30 days per month and were used for statistical analyses.
Collected data were analyzed in two ways: to test for significant seasonal variations in births and deaths, the chi-squared test for goodness of fit for equal frequencies (Chi2ef) was used, with a significance level of P<0.05,Citation31 and for seasonal rhythm analysis in the different times series for annual variation, the program Chronos-FitCitation32 was used. For rhythm analysis, the following equation was used:
By means of the Chronos-Fit program, the data were fitted by partial Fourier series up to six harmonics ([i] 24, 12, 8, 6, 4.8, and 4 hours). This method allows statistical verification of a cosine-shaped waveform rhythm pattern by testing the null hypothesis of the amplitude being equal to zero. The following parameters were calculated for each of the fitted curves: mesor (mean of the fitted 24 hour curve), acrophase (maximum value of each harmonic), amplitude of each harmonic, peak and trough values of the combined cosine curve, and the significance of rhythmicity (P<0.05). Significance of a seasonal rhythm is presented in .
Results
German branch: seasonal variation in natality and mortality
shows the normalized seasonal variations in the births and deaths of 2,361 family members of the German branch from 1500–2013. For the 300 year span from 1500–1799, peak value in nativity rhythm was found in January, and trough value was found in June. Analysis of data revealed both a significance in chi-squared test as well a significant seasonal rhythm (P<0.0021; ). No significant seasonal rhythm in births was found during 1800–2013 and 1950–2013 ().
Figure 1 Seasonal variation in natality and mortality in the German family branch.
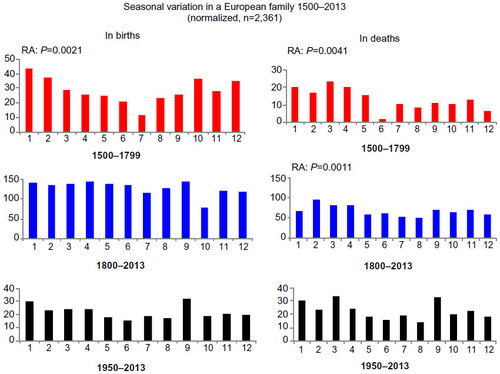
The number of deaths displayed a significant seasonal rhythm for the time spans of 1500–1799 (P<0.0041) and 1800–2013 (P<0.0011), both showing the rhythmic peak value in March and the trough value in June by rhythm analysis ( and ); in addition, the variation was significant by chi-squared test (). In the second half of the 20th century, no seasonal rhythm was found ( and ).
South African branch: seasonal variation in natality and mortality
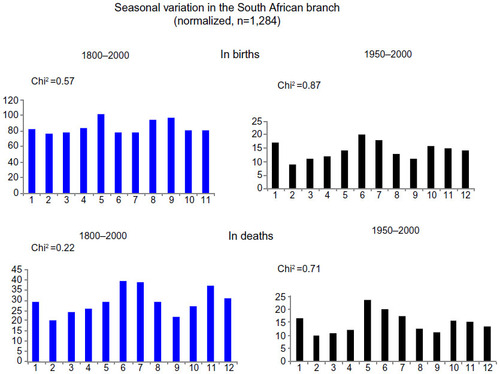
In , normalized seasonal distribution in the births and deaths of 1,284 family members of the South African branch between the years 1800–2000 and 1950–2000 are presented. Neither a significant seasonal variation by chi-squared test nor a significant seasonal rhythm by rhythm analysis was found ( and ).
Figure 2 Seasonal variation in natality and mortality in the South African family branch.
Socioeconomic data
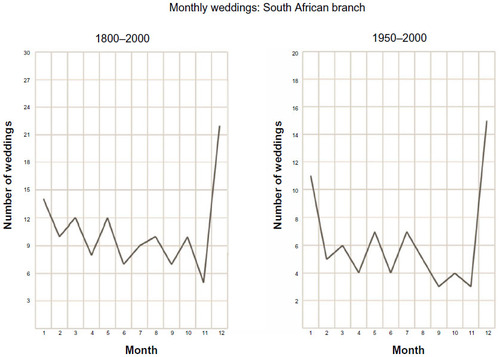
Interestingly, there was a pronounced seasonal pattern in the number of weddings in the German branch in the years 1500–1799 and 1800–2013, with two peaks in spring and autumn/winter (). During the second half of the 20th century, a peak in weddings was observed only in winter. In contrast, no seasonal pattern in the number of weddings was found in South Africa, and only one peak was seen in both time spans (1800–2000, 1950–2000), in December ().
Figure 3 Seasonal number of weddings in the German family branch.
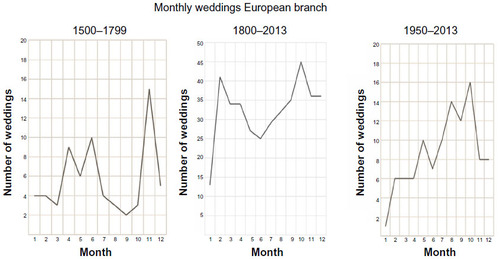
Figure 4 Seasonal number of weddings in the South African family branch.
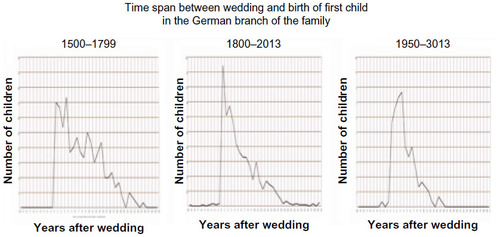
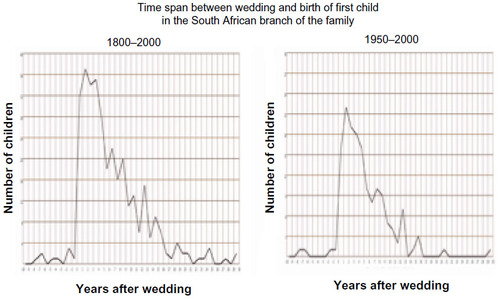
In both the German and the South African branches of the family, the first child was born some time before up to ≈15 years after the marriage ( and ), clearly indicating that reproduction does not occur immediately after the wedding feast.
Figure 5 Birth of first child after marriage in the German family branch.
Discussion
Here we present for the first time seasonal data on natality and mortality in a single family with Caucasian heritage residing for several hundred years at different latitudes (≈51° N in Germany and ≈30° S in South Africa, respectively) and at about the same longitude.
Considering the previous commentary,Citation21 the additional data obtained for the German branch of the family doubled the data set previously available for detailed analyses. Whereas clearcut seasonal variations with a peak in winter/early springtime were found in the northern hemisphere for the time spans of 1500–1799 and 1800–2013, no such pattern was observed in the second half of the 20th century. The seasonal swing in maximum and minimum hours of sunshine and in temperature is much less in Capetown than in Munich,Citation13 as expected from the difference in the closeness of the latitude to the equator. Thus, the contribution of outside temperature to seasonal rhythms cannot be excluded. In fact, in 1832, Quételet and Smits reported that the seasonal variation in outside temperature in Belgium was negatively correlated with seasonal rhythm in mortality.Citation11
Additional socioeconomic data could be collected by the available documents in both branches of the family. Most interestingly, the yearly pattern in the number of weddings mirrored the presence or absence in the pattern in nativity and mortality at the different latitudes ( and ); however, there is no obvious causal link between these patterns. It has sometimes been assumed that the first child is born around 1 year after the wedding and first conception. This hypothesis was not verified by the data we collected, neither in Germany nor in South Africa, as documented in and .
Figure 6 Birth of first child after marriage in the South African family branch.
We consider the time around the end of World War II as the great cut in history. Roenneberg and AschoffCitation13 limit the dominance of the photoperiod in such events to the 1930s. Since MacFamilyTreeCitation30 allows us to analyze each time span selected, a double peak was still observed in the 1930s, when our set of data was analyzed (not shown). Interestingly, in the new data available for the South African branch of the family, living approximately at a latitude of about 30° S, no significant seasonal variation was found between the years 1800–2000, as well as in the second half of the 20th century.
The data analyzed here support the notion of the importance of the natural light–dark cycle of the photoperiod, or even better, a greater seasonal swing in the photoperiod, for natality and mortality, when the subjects are mainly living under natural environmental conditions of light and darkness, work and activity, and ambient temperature. Although no direct genetic data are available for both family branches, the marriage certificates of the two branches clearly indicate their Caucasian heritage.
We consider that approximately from the second half of the 20th century, there was a great change in these environmental conditions with additional impact factors: Not only did oral contraceptives become available, allowing the manipulation of the time of conception, pregnancy, and birth, but also there was introduction of new technology to better control environmental conditions, greater use of artificial light to extend the hours of light during the 24 hour period, further incorporation of shiftwork schedules in industry and other settings, stronger advances in medical treatment of many diseases, including increased availability of intensive care in hospitals, and finally, greater longevity of the population.
Aside from the recent work of Roenneberg and Aschoff,Citation13,Citation19 the influence of region and weather on the seasonal variation of mortality in several countries was reviewed some years ago by Momiyama and Katayama,Citation9 who showed a moderation (reduction) of the amplitude of difference in the annual pattern of human deaths in the United States and other countries in the 1960s, which was ascribed to the introduction of central heating and air conditioning into homes. There are also numerous papers indicating that mainly a low winter temperature may contribute to an excess in mortality.Citation16,Citation33–Citation35 However, seasonality in mortality in a tropical zone could not be explained by temperature but was associated with humidity.Citation36 Furthermore, low income seems also to play a role in winter mortality.Citation16 The very early data from Quételet and Smits,Citation11 from 1832 on, showing higher winter mortality both in the cities and the country of Belgium, was already mentioned. However, the winter/spring excess in nativity in a rural population is hardly to be explained by seasonal variation of outside temperature.
In agreement with various reports by Smolensky,Citation14,Citation15,Citation18 our data on the German branch of the family further support a pronounced spring peak in mortality based on the data of a span of about 500 years, but the seasonal variation was no longer observed during the second half of the 20th century. In general, seasonal variation in birth was less pronounced than that in mortality. Although no direct data are available for temperature and weather for the whole 500 year span, even greater changes during this period are unlikely to explain the loss of seasonality, as the family members contributing the data all lived at approximately the same latitude and longitude in the middle of Europe. Considering the great span of 200 years (South African branch) and 500 years (European branch) of the data set included, it is not possible to have data on detailed socioeconomic conditions of the family members over the centuries. The role of more recent technological changes from the middle of the 20th century affecting the temporal features and signals of environmental time cues, along with lifestyle, working habits, birth control, life-extending medications, and medical procedures, seems to have masked the possible underlying human circannual rhythmsCitation37 on birth and death in the population.
In conclusion, the present data set is the first in which the seasonal variation in nativity, mortality, and number of weddings in a single family could be shown to be correlated with the degree of latitude/photoperiod. However, environmental and socioeconomical factors are likely to be involved, as discussed.
Acknowledgments
This article is dedicated to my granddaughters Lea Sophie, Laura Flurina, Luisa Marie, and Marie Eliane. I am grateful to U and S Lemmer, who made much of the family data available for the analyses.
Disclosure
The author reports no conflicts of interest in this work.
References
- Quételet LAJ. Recherches sur la population, les naissances, les décès, les prisons, les dépôts de mendicité, etc, dans le royaume des Pays-Bas. Bruxelles: Chez H. Tarlier; 1827.
- Virey J-J. Éphémerides de la vie humaine, ou recherches sur la révolution journalière, et la périodicité de ses phénomènes dans la santé et les maladies. Paris: Didot Jeune; 1814:6–40.
- Quételet LAJ. De l’Influence des saisons sur la mortalité aux differens ages dans la Belgique. Bruxelles: M. Hayez, Imprimeur de l’Academie Royale; 1838.
- Casper JL. Denkwürdigkeiten zur medizinischen Statistik und Staatsarzneikunde. Berlin: Duncker und Humblot; 1846.
- Buek J. Untersuchungen über den Einfluss Tageszeiten auf die Geburten. In: Magazin der ausländischen Literatur der gesammten Heilkunde, und Arbeiten des Aerztlichen Vereins zu Hamburg. Hamburg: Julius, NH Gerson, GH; 1829:336 ff.
- Schneider CF. Ein Beitrag zur Ermittlung der Sterblichkeits-Verhältnisse in Berlin nach den Tageszeiten. Arch für pathologische Anatomie und Physiologie und für klinische Medicin. R Virchow (editor). Vol 16. Georg Reimers, Berlin. 1859;95–119.
- Verdam GJ. Tableau des naissances, décès et marriages pendant l’année 1826, pour la ville de Groningen. In: Quetelet. Paris; 1835.
- Calcagni F. Tavole Sinottiche sulla Popolazione di Palermo, da Settembre 1805 a tutto Dicembre 1825. In: Quetelet. Paris; 1835.
- Momiyama M, Katayama K. A medico climatorogical study in moderation of mortality seasonal variation. J Meterolol Soc.1969;47:466–481.
- Quételet LAJ. Sur l’homme et le developpement de ses facultés, essai d’une physique sociale. Paris; 1835.
- Quételet LAJ, Smits E. Recherches sur la reproduction et la mortalité de l’homme aux differens ages et sur la population de la Belgique. Bruxelles: Louis Haumann et Comp; 1832.
- Momiyama M, Katayama K. Deseasonalization of mortality in the world. Int J Biometeorol. 1972;16(4):329–342.
- Roenneberg T, Aschoff J. Annual rhythm of human reproduction: II. Environmental correlations. J Biol Rhythms. 1990;5(3):217–239.
- Smolensky M, Halberg F, Sargent F. Chronobiology of the life sequence. In: Ito S, Ogata K, Yoshimura H, editors. Advances in Climatic Physiology. Tokio: Igaku Shoin. 1972:281–318.
- Smolensky MH. 6. Aspects of human chronopathology. In: Reinberg A, Smolensky MH, editors. Biological Rhythms and Medicine. New York, Berlin, Heidelberg: Springer-Verlag; 1983:131–209.
- Hales S, Blakely T, Foster RH, Baker MG, Howden-Chapman P. Seasonal patterns of mortality in relation to social factors. J Epidemiol Community Health. 2012;66(4):379–384.
- Rau R. Seasonality in Human Mortality. Berlin, Heidelberg: Springer; 2007.
- Batschelet E, Hillman D, Smolensky M, Halberg F. Angular-linear correlation coefficient for rhythmometry and circannually changing human birth rates at different geographic latitudes. Int J Chronobiol. 1973;1(3):183–202.
- Roenneberg T, Aschoff J. Annual rhythm of human reproduction: I. Biology, sociology, or both? J Biol Rhythms. 1990;5(3):195–216.
- Cole RJ, Kripke DF, Wisbey J, et al. Seasonal variation in human illumination exposure at two different latitudes. J Biol Rhythms. 1995;10(4):324–334.
- Lemmer B. Masking effect of modern technology on annual rhythms: variation in births and deaths in a single family history over five centuries. Chronobiol Int. 2012;29(9):1176–1179.
- Lemmer H. Ahnentafel Lemmer. Dannenberg; 1992.
- Lemmer H. Beiträge und Aufzeichnungen zur Geschichte der Familie Lemmer, 1. Teil. Lieberhauser Linie. Eigenverlag; 1992.
- Lemmer SR, Lemmer SRJ. Familia Lemmer. 2nd ed. Posbus, South Africa: CM Lemmer; 2000.
- Lemmer W. Festschrift zum 1. Sippentag in Honrath, 26.3.1939. Hoffnungsthal-Köln: Buchdruckerei Emil Pilgram; 1939.
- Engel I, Engel A. Vor- und Nachfahren von Jacob Scheidemantel. Bad Orb: Engel and Engel; 1993.
- Steinmetz W. Stammtafel der Familie Steinmetz-Lohne, Tafel II. Stuttgart: W Steinmetz; 1965.
- Wikipedia. Zeitreihe der Lufttemperatur in Deutschland. Available from: http://de.wikipedia.org/wiki/Zeitreihe_der_Lufttemperatur_in_Deutschland. Accessed June 1, 2014.
- SouthAfrica.info. South Africa’s weather and climate. http://www.southafrica.info/travel/advice/climate.htm. Accessed May 4, 2014.
- MacFamily Tree, version 7.2.3, Synium Software GmbH, Mainz, Germany.
- Ackermann H. BIAS. Biometrische Analyse von Stichproben. Hochheim. Darmstadt: Epsilon-Verlag; 2002.
- Zuther P, Gorbey S, Lemmer B. Chronos-Fit revised Version 1.06. Available from: http://www.ma.uni-heidelberg.de/inst/phar/lehre/chrono.html. Accessed June 15, 2014.
- Kimura T, Senda S, Masugata H, et al. Seasonal blood pressure variation and its relationship to environmental temperature in healthy elderly Japanese studied by home measurements. Clin Exp Hypertens. 2010;32(1):8–12.
- Nakanishi N, Nishizawa S, Kitamura Y, et al. Circadian, weekly, and seasonal mortality variations in out-of-hospital cardiac arrest in Japan: analysis from AMI-Kyoto Multicenter Risk Study database. Am J Emerg Med. 2011;29(9):1037–1043.
- Lewington S, Li L, Sherliker P, et al; China Kadoorie Biobank study collaboration. Seasonal variation in blood pressure and its relationship with outdoor temperature in 10 diverse regions of China: the China Kadoorie Biobank. J Hypertens. 2012;30(7):1383–1391.
- Motohashi Y, Takano T, Nakamura K, Nakata K, Tanaka M. Seasonality of mortality in Sri Lanka: biometeorological considerations. Int J Biometeorol. 1996;39(3):121–126.
- Lachowicz A, Ocedalski T, Pawlikowski M, Rebas E. Effect of 17-beta-estradiol and progesterone on angiotensin II-induced changes in inositol-1,4,5-trisphosphate content and protein kinase C activity in anterior pituitary. Biochem Biophys Res Commun. 2000;275(1):7–10.